What you'll learn
- What sociologists mean by health chances and health inequalities.
- How health chances vary by social class, gender, ethnicity and region in the UK.
- How to explain these patterns using material, cultural, psychosocial and healthcare-access explanations.
- How to evaluate evidence and avoid simplistic “individual choice” answers.
Starting point: health chances are socially patterned
In sociology, health is not treated as simply a matter of biology, luck, or personal choices. Sociologists ask why some groups are more likely than others to experience illness, disability, poor mental health, shorter life expectancy, or early death.
Health chances
Health chances are the socially patterned probabilities that different groups have of experiencing good health, illness, disability, long life, or premature death. The key idea is that your chances of health are shaped by your social position, not just your individual body.
Useful health terms
- Morbidity means the level of illness or disease in a population.
- Mortality means death rates in a population.
- Life expectancy means the average number of years a person is expected to live.
- Healthy life expectancy means the average number of years a person is expected to live in good health.
- Health inequalities are systematic differences in health between social groups.
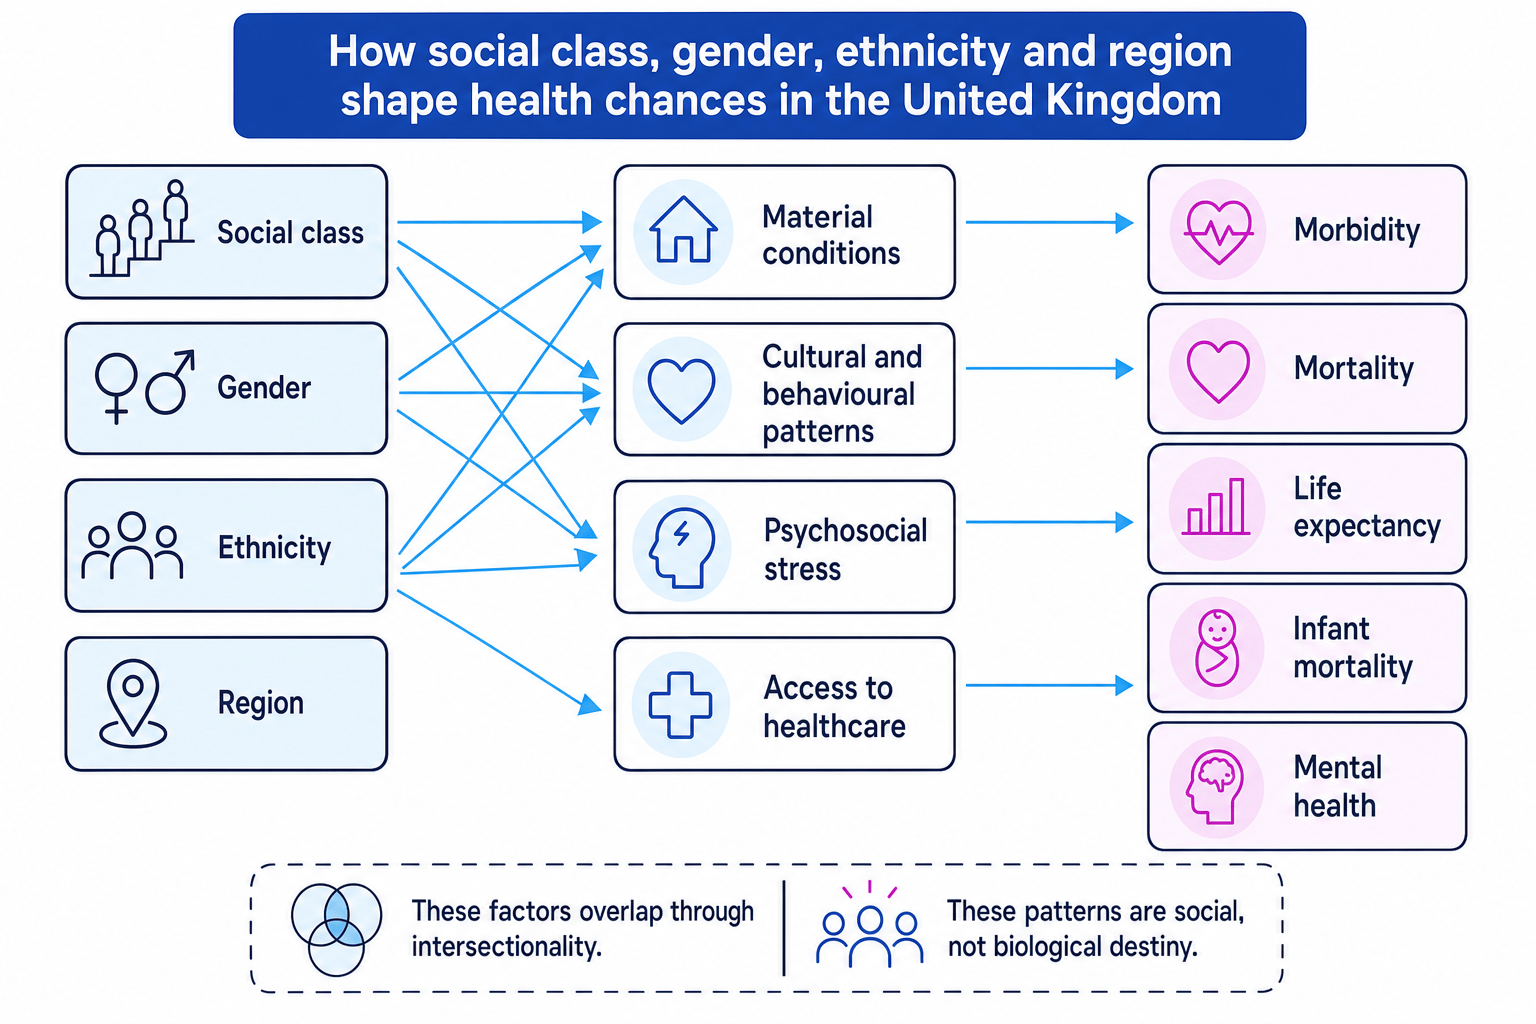
The big picture is that health inequalities are produced through overlapping social factors: class, gender, ethnicity and region all affect people’s material conditions, identities, lifestyles, stress levels and access to services.
The social gradient in health
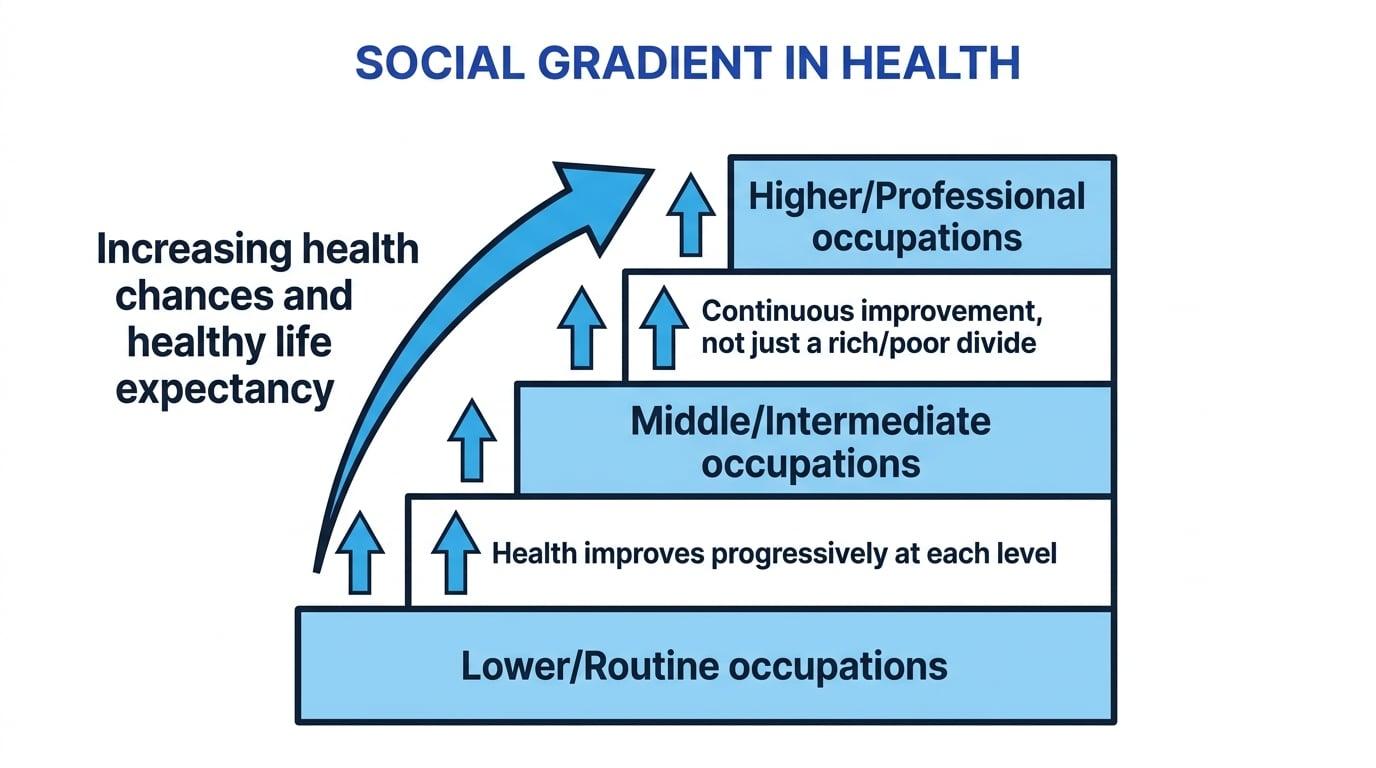
Health inequalities usually form a social gradient: health tends to improve at each step up the social hierarchy. This means it is not only the poorest who are disadvantaged; people in the middle often have worse health chances than those above them too.
Main explanations for health inequalities
A strong answer does not just list inequalities. It explains the mechanisms linking social position to health outcomes.
Material and structural explanations
A material explanation argues that health is shaped by access to resources such as income, housing, safe work, nutritious food, transport and heating. A structural explanation goes further by focusing on how society is organised: labour markets, welfare policy, housing markets and power inequalities create unequal living conditions.
This approach is associated with the Black Report (1980), which found major class inequalities in health and argued that material deprivation was a key cause. The Acheson Report (1998) and Marmot Review (2010; updated 2020) also emphasised the social determinants of health: the wider social and economic conditions in which people are born, grow, work, live and age.
Cultural and behavioural explanations
A cultural explanation focuses on shared norms, values and habits within groups. A behavioural explanation focuses on practices such as smoking, diet, alcohol use, exercise and healthcare-seeking.
These explanations can be useful because health-related behaviours are not randomly distributed. For example, smoking rates and diet patterns are linked to class, stress, advertising, local food environments and workplace routines.
Blaming individuals
Do not write as if poorer groups simply “choose” bad health. Sociologists ask why some choices are easier, cheaper, more socially accepted, or more available to some groups than others.
Psychosocial explanations
A psychosocial explanation focuses on the health effects of stress, low status, insecurity, stigma and lack of control. Wilkinson and Pickett argue that more unequal societies can produce worse health because inequality damages trust, increases status anxiety and creates chronic stress.
This links closely to the theme of social differentiation, power and stratification: unequal power affects not only income, but also dignity, security and control over daily life.
Access to healthcare
The UK has the NHS, which is free at the point of use, so health inequalities cannot be explained simply by whether people can pay for treatment. However, access still varies. Some groups face longer waiting times, transport barriers, language barriers, digital exclusion, distrust of services, discrimination or poorer-quality interactions with professionals.
Tudor Hart’s inverse care law (1971) argues that those who need healthcare most are often least likely to receive high-quality care, especially in areas with fewer resources.
Explaining lower healthy life expectancy
-
Start with the pattern: people in more deprived areas often have lower healthy life expectancy than those in affluent areas.
-
Apply a material explanation: lower income can mean poorer housing, fuel poverty, insecure work, more exposure to pollution and less access to good-quality food.
-
Add a psychosocial mechanism: financial insecurity and low control at work can create long-term stress, which may worsen mental and physical health.
-
Evaluate the explanation: the pattern is strong, but official statistics show association rather than proving one single cause. You can strengthen the answer by combining material, cultural and healthcare-access explanations.
Social class and health chances
Social class
Social class refers to a person’s position in society based on factors such as occupation, income, education, wealth and market power. In UK statistics, class is often measured through occupation-based schemes such as the National Statistics Socio-economic Classification.
Social class is one of the strongest predictors of health in the UK. People in routine or manual occupations, unemployed people, and those living in deprived areas are more likely to experience chronic illness, disability, lower life expectancy, poorer mental health and higher infant mortality.
The Black Report identified four possible explanations for class inequalities in health:
- Artefact explanation: inequalities may appear larger or smaller because of how data is collected or categories are measured.
- Social selection explanation: poor health may push people down the class structure.
- Cultural/behavioural explanation: class groups may have different lifestyles and health behaviours.
- Material/structural explanation: unequal access to resources creates unequal health chances.
Most sociologists see material and structural explanations as especially important, while accepting that behaviour and culture also matter.
AO2 examples include damp housing linked to respiratory illness, food deserts limiting healthy diets, insecure work creating stress, and manual jobs increasing the risk of injury. During the COVID-19 pandemic, class mattered because many working-class people were less able to work from home and were more exposed through public-facing or insecure jobs.
AO3 evaluation: class is powerful, but it overlaps with gender, ethnicity and region. Also, “class” can be measured in different ways: occupation, income, wealth and education may not produce identical patterns.
Gender and health chances
Gender
Gender refers to socially constructed expectations, identities and roles associated with being male, female or another gender identity. It is different from sex, which refers to biological characteristics.
Gender patterns in health are complex. Women in the UK generally have longer life expectancy than men, but they often report higher levels of illness, pain, disability and mental health problems. Men are more likely to die earlier, experience workplace deaths, avoid seeking medical help, and die by suicide.
A sociological explanation focuses on gender socialisation. Boys may be encouraged to appear tough, take risks and avoid showing vulnerability. This links to Connell’s idea of hegemonic masculinity, where dominant ideals of masculinity value strength, control and emotional restraint. These norms may discourage some men from using health services early.
For women, feminist sociologists point to patriarchy, unpaid caring responsibilities, domestic abuse, poverty among lone parents, reproductive health inequalities, and medical dismissal of women’s pain. Women’s health can be affected by both biological processes and social inequalities around care, work and power.
Applying gender socialisation to health
-
Identify the pattern: men may be less likely to seek help for mental health problems or early symptoms of disease.
-
Link it to identity: masculine norms can define asking for help as weakness, so some men delay using services.
-
Connect to outcome: delayed help-seeking can mean conditions are treated later, when they are more severe.
-
Evaluate: not all men follow the same masculine norms, and class, ethnicity, sexuality and region affect how gender identities are lived.
Ethnicity and health chances
Ethnicity
Ethnicity refers to shared cultural identity, ancestry, history, language, religion or national background. Ethnic groups are socially defined and internally diverse.
Ethnic inequalities in health are significant, but they are not uniform. Different minority ethnic groups have different health profiles. For example, some South Asian groups have higher rates of type 2 diabetes, Gypsy, Roma and Traveller communities often experience very poor health outcomes, and Black women in the UK face much higher risks in maternal health than White women.
During COVID-19, some Black and Asian groups experienced higher mortality. Sociological explanations focus on overcrowded housing, public-facing work, pre-existing inequalities, racism, poverty and barriers to healthcare rather than simple biological difference.
Nazroo argues that ethnic health inequalities are strongly linked to racism and socioeconomic disadvantage. Karlsen and Nazroo also found that experiences of racism are associated with poorer health, showing that discrimination itself can be a health risk.
Treating ethnicity as biology
Avoid saying an ethnic group has poorer health “because of their ethnicity” as if ethnicity itself is a biological cause. Ask what social conditions, inequalities, racism, migration histories or service barriers are affecting that group.
AO3 evaluation is important here. Ethnic categories used in official statistics are broad and can hide major differences by religion, migration generation, class, language and region. For example, “Asian” may include people with very different backgrounds, incomes and health risks.
Region and health chances
Region
Region refers to geographical location, such as nations of the UK, English regions, local authorities, neighbourhoods, rural areas, coastal areas or urban areas.
Health chances vary sharply by place. In general, more deprived areas, including many parts of the North East, North West, Wales, Scotland, and some coastal or former industrial areas, have worse health outcomes than more affluent areas. However, there are also major inequalities within London and the South East, so the pattern is not a simple “North bad, South good” divide.
Regional inequalities are linked to deindustrialisation, unemployment, housing quality, environmental pollution, transport, local public services, GP availability, and the concentration of poverty. The “Glasgow effect” is often used to describe unusually poor health outcomes in Glasgow even compared with other deprived cities, although sociologists debate exactly how to explain it.
Use region carefully
Region often works through class, housing, employment and service access. In essays, avoid treating “place” as magical; explain what features of the place affect health chances.
A useful concept is the postcode lottery, where people’s access to services, waiting times or health outcomes depend partly on where they live. However, be careful: local patterns may reflect the people living there, the services available, or both.
Intersectionality: inequalities overlap
Intersectionality
Intersectionality means that social divisions such as class, gender, ethnicity and region overlap, producing combined advantages and disadvantages. The concept is associated with Crenshaw.
For example, the health chances of a middle-class White woman in a wealthy area may differ greatly from those of a working-class Bangladeshi woman in overcrowded housing, or a Black man in insecure public-facing employment. Intersectionality helps you avoid writing as if all women, all working-class people or all minority ethnic groups have the same experiences.
This connects to the AQA theme of socialisation, culture and identity because people’s health behaviours and experiences of services are shaped by identity. It also connects to power and stratification because unequal access to money, status and institutional support affects health chances.
Methods: how sociologists know about health inequalities
Sociologists use evidence from official statistics such as ONS data, NHS records, Census data, Health Survey for England data and local deprivation indices. These are useful because they cover large populations and can reveal patterns over time.
However, there are limitations. Official statistics may under-record some groups, use broad categories, or miss lived experiences. For example, a hospital record may show treatment outcomes but not whether the patient felt dismissed, misunderstood or discriminated against.
Qualitative research, such as interviews, can reveal how people experience illness, stigma, medical encounters and barriers to care. Interpretivists value this because it gives more validity and depth, though it may be less representative than large-scale statistics.
Evaluating official health statistics
-
Identify the strength: official statistics can show large-scale patterns, such as regional differences in mortality or class differences in life expectancy.
-
Identify the limitation: the categories may be too broad, such as grouping diverse ethnic communities together.
-
Add a theoretical point: positivists may value the reliability and scale of the data, while interpretivists may argue it misses meanings, experiences and discrimination.
-
Reach a balanced judgement: official statistics are useful for identifying inequality, but qualitative research helps explain how inequality is experienced and reproduced.
Bringing it together for essays
A strong essay usually follows this chain:
social group → social conditions → mechanism → health outcome → evaluation
For example: working-class people may be more likely to experience insecure work and poor housing; this creates stress and exposure to health risks; this may increase morbidity and reduce healthy life expectancy; however, class overlaps with ethnicity, gender and region, so explanations should be multi-causal.
Best overall argument
The unequal distribution of health chances in the UK is not random. It reflects wider inequalities in income, work, housing, gender roles, racism, regional investment and access to power.
In the exam
-
Do more than describe patterns: always explain the mechanism linking class, gender, ethnicity or region to health outcomes.
-
Use named evidence: Black Report, Acheson, Marmot, Tudor Hart, Wilkinson and Pickett, Nazroo, or Connell can all strengthen AO1.
-
Evaluate with overlap and methods: point out intersectionality, category problems in statistics, correlation versus causation, and the limits of purely individual explanations.
Check yourself
- Why is the “social gradient” more sociological than simply saying “poor people are less healthy”?
- How might gender socialisation affect men’s and women’s use of health services?
- Why is it risky to explain ethnic health inequalities without discussing racism, class and access to healthcare?