What you'll learn
- The difference between primary/secondary and quantitative/qualitative data.
- How sociologists use questionnaires, interviews, observation, experiments, documents and official statistics.
- How to evaluate each source using practical, ethical and theoretical issues.
- How sources of data connect to identity, socialisation, power and inequality.
The basic map: what counts as data?
In sociology, data means evidence used to answer a research question. A source of data is where that evidence comes from: for example, a questionnaire completed by students, an interview transcript, a government crime table, or a diary.
Core data terms
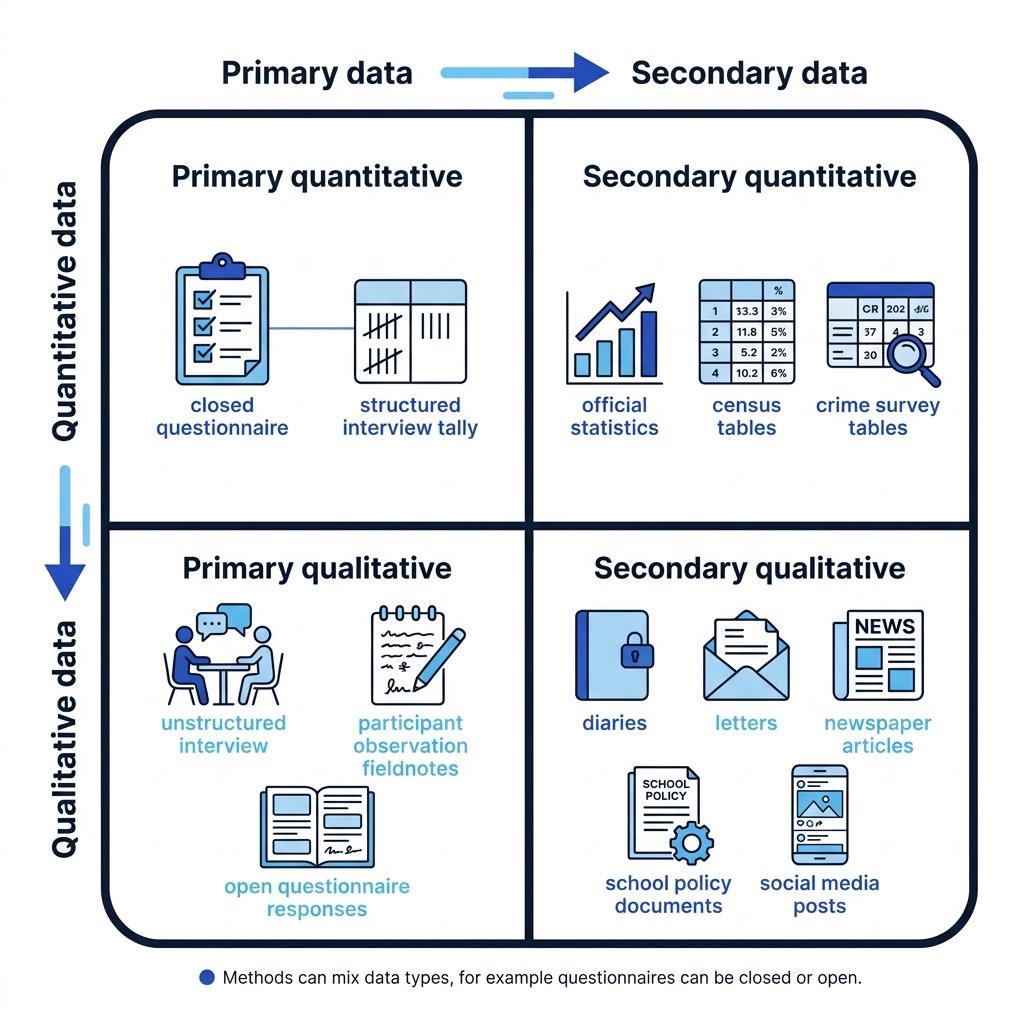
- Primary data is data collected first-hand by the sociologist for their own research.
- Secondary data is data that already exists, created by someone else.
- Quantitative data is numerical data, such as percentages, rankings or counts.
- Qualitative data is non-numerical data, such as words, meanings, images or detailed descriptions.
A helpful starting map is to ask two questions: Who collected the data? and What form is it in?
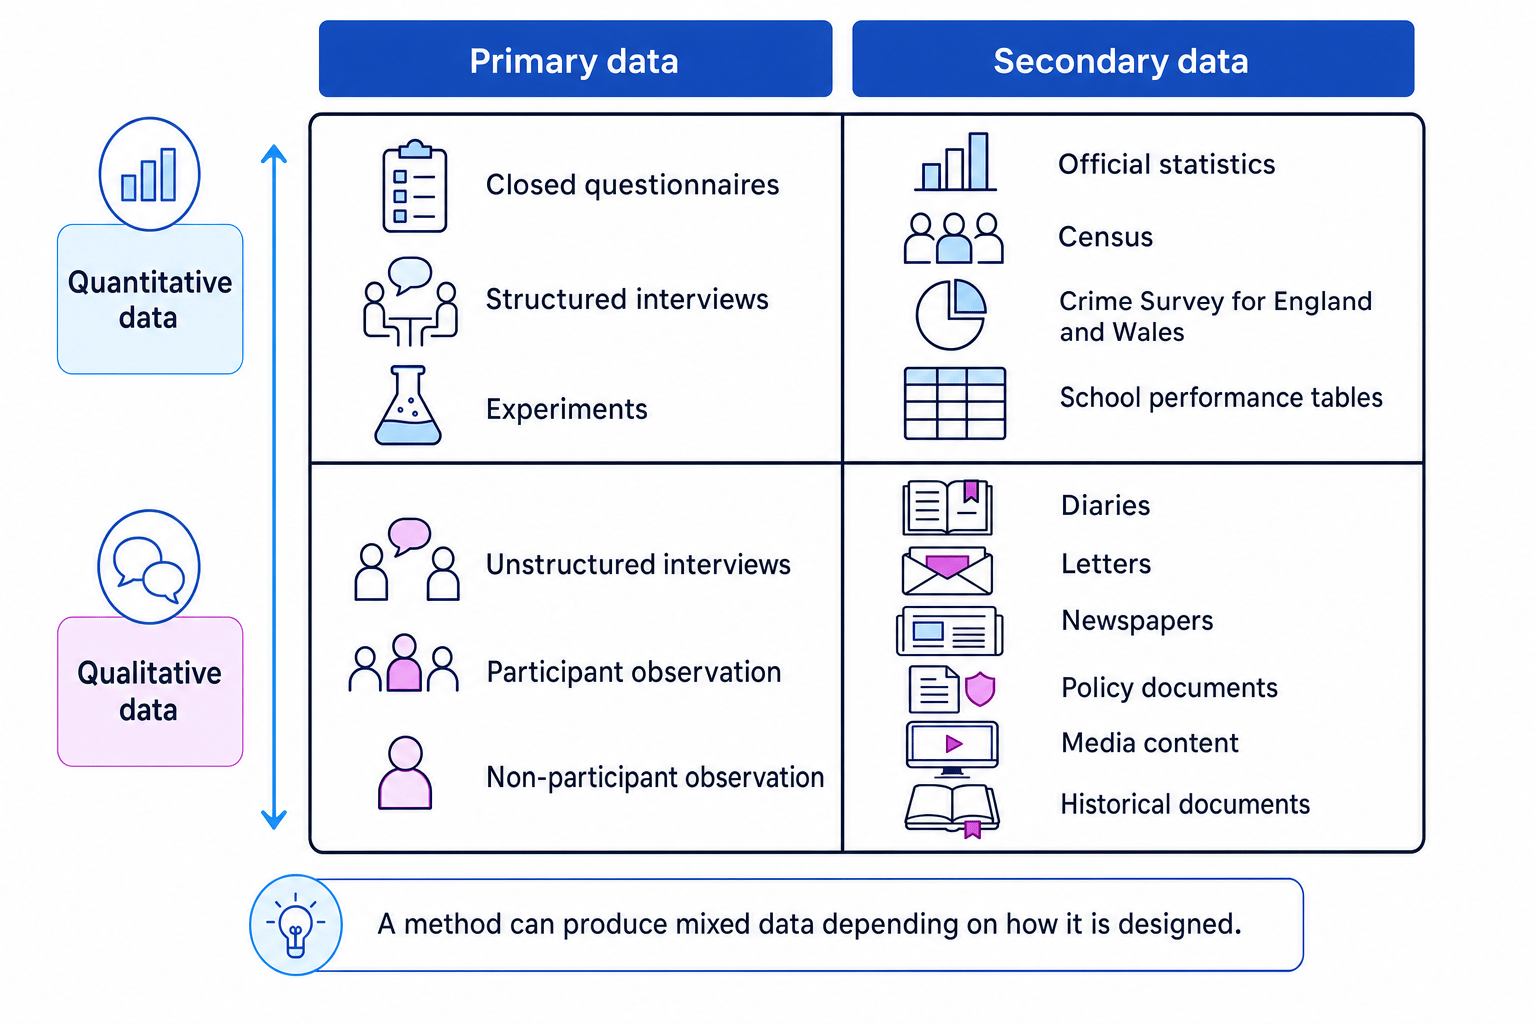
Methods can be mixed
Do not assume one method always produces one type of data. A questionnaire with tick-box answers is mainly quantitative, but a questionnaire with open written responses can also produce qualitative data.
Before comparing sources, you need three key evaluation words.
Reliability, validity and representativeness
- Reliability means consistency: would the method produce similar results if repeated?
- Validity means truthfulness or accuracy: does the method measure what it claims to measure?
- Representativeness means how far the people or cases studied reflect the wider target population, meaning the group the researcher wants to make claims about.
Classifying a source of data
A sociologist uses the Crime Survey for England and Wales, then conducts interviews with young people about fear of crime.
- The Crime Survey already exists before this sociologist uses it, so for this project it is secondary data.
- Its tables of victimisation rates are numerical, so they are mainly quantitative data.
- The interviews are collected directly by the researcher and focus on meanings, feelings and experiences, so they are primary qualitative data.
Confusing method with data type
Avoid writing “questionnaires are quantitative” as if this is always true. It is better to say: closed questionnaires usually produce quantitative data, while open questions can produce qualitative data too.
Questionnaires
A questionnaire is a list of written questions completed by respondents, either on paper or online. A respondent is a person who answers research questions.
Questionnaires often use closed questions, where the answers are fixed in advance, such as “strongly agree” to “strongly disagree”. They may also use open questions, where respondents write their own answers.
Closed questions can create different levels of measurement. Nominal data places people into categories with no order, such as ethnic group. Ordinal data ranks responses, such as a satisfaction scale. Interval data has equal gaps between values, and ratio data has a true zero, such as income.
Strengths
Questionnaires can reach large numbers of people quickly and cheaply. Because the same questions are asked in the same way, they are often reliable. They are useful for studying patterns of social differentiation, such as gender differences in subject choice or class differences in university applications.
Limitations
Questionnaires may have low response rates, meaning only a small proportion of those contacted reply. Respondents may misunderstand questions or give socially desirable answers, meaning answers that make them look good. This can reduce validity.
Positivists, who believe sociology should identify observable social patterns, often favour questionnaires because they produce measurable data. Interpretivists, who focus on meanings and lived experience, criticise them for lacking depth.
Interviews
An interview is a method where a researcher asks questions directly. A structured interview uses a fixed list of questions, making it reliable and easier to compare. An unstructured interview is more like a guided conversation, allowing the respondent to explain meanings in their own words. A semi-structured interview sits between these two.
Interviews are useful for studying culture and identity because they can explore how people understand themselves. For example, a researcher could interview British Muslim women about religion, family expectations and education, rather than simply counting attitudes.
Strengths
Unstructured interviews can be high in validity because respondents can explain complex experiences. Feminist sociologist Ann Oakley argued that less hierarchical interviews can reduce power inequalities between researcher and respondent.
Limitations
Interviews can be time-consuming and expensive. They may suffer from the interviewer effect, where the interviewer’s age, gender, ethnicity, accent or behaviour influences the respondent’s answers. Sensitive topics, such as domestic abuse or racism, require careful attention to informed consent, confidentiality and emotional harm.
Link interviews to identity
If a question is about meanings, motives, stigma, labelling or identity, interviews are often easier to justify than questionnaires because they let people explain their own viewpoint.
Observation
Observation means watching social behaviour directly. In participant observation, the researcher joins in with the group being studied. In non-participant observation, the researcher watches without joining in.
Observation can also be overt, where people know they are being studied, or covert, where they do not. Covert research may produce more natural behaviour, but it raises ethical problems because people have not given informed consent.
Participant observation
Participant observation can reveal informal norms, meanings and group culture. Willis used ethnographic methods, including observation and interviews, to study working-class boys’ anti-school culture in Learning to Labour (1977). This connects strongly to socialisation: the boys learned masculine, working-class identities through peer-group interaction.
However, participant observation is usually time-consuming, difficult to replicate and based on small groups, so it may lack reliability and representativeness.
Non-participant observation
Non-participant observation can be more detached. For example, a researcher might observe classroom interactions and record how often teachers praise or discipline different pupils. This can reveal power and labelling processes, such as whether Black Caribbean boys are disciplined more harshly.
A weakness is the Hawthorne effect, where people change their behaviour because they know they are being observed.
Choosing an observation method in a school
A researcher wants to study how teachers respond to pupils from different class backgrounds.
- Participant observation may help the researcher understand school culture from the inside, but becoming a “participant” in a classroom is practically difficult because the researcher is not a pupil or teacher.
- Non-participant observation allows systematic recording of teacher-pupil interactions, such as praise, questioning and discipline.
- If the observation is overt, it is more ethical, but teachers may alter their behaviour, so the researcher should evaluate validity carefully.
Experiments
An experiment tests whether one factor causes another. The independent variable is the factor the researcher changes, while the dependent variable is the outcome measured. A control group is a comparison group that does not experience the change.
Laboratory experiments are rare in sociology because social life is hard to control and artificial settings reduce validity. Field experiments happen in real-life settings and are often more useful.
For example, researchers can send matched job applications with different names to test ethnic discrimination in recruitment. This applies directly to power and stratification because it investigates unequal access to employment.
Inferring discrimination from a field experiment
A researcher sends employers two similar CVs, one with a traditionally White British name and one with a traditionally Pakistani name.
- The researcher controls key details such as qualifications and experience, so the name becomes the main independent variable.
- If the White British name receives more interview invitations, the dependent variable suggests unequal treatment.
- The method has strong practical value because it tests real employer behaviour, but it raises ethical issues because employers did not consent to being studied.
Documents
A document is recorded material that already exists. Documents can be personal, such as diaries and letters, or public, such as newspapers, school policies, government reports, websites and social media posts.
Documents are useful for studying culture because they show how meanings are produced and circulated. For example, newspaper coverage of migrants can reveal stereotypes, moral panics or nationalist ideas. This links to power because some groups have more control over media representation than others.
Sociologist John Scott suggested evaluating documents using four criteria: authenticity means whether the document is genuine; credibility means whether it is accurate; representativeness means whether it is typical; and meaning means whether the researcher understands its context.
Evaluating a newspaper article as a document
A researcher uses a tabloid article about knife crime.
- They check authenticity by confirming the article is a real publication, not a fake screenshot.
- They assess credibility by asking whether the article relies on police data, victim testimony, anonymous claims or selective examples.
- They consider meaning by analysing the language used, such as whether young people are described as “dangerous”, “feral” or “vulnerable”.
Official statistics
Official statistics are numerical data collected or published by governments and public bodies. Examples include the Census, Office for National Statistics data, police recorded crime, the Crime Survey for England and Wales, Department for Education performance tables, deprivation indices and international datasets such as PISA league tables.
Official statistics are powerful because they cover large populations and allow comparisons over time. Durkheim famously used official statistics on suicide to argue that suicide rates were shaped by social integration and regulation, not just individual psychology.
However, official statistics are not neutral facts floating above society. Interpretivists such as Atkinson argued that suicide statistics depend on coroners’ interpretations. Cicourel also showed that crime statistics are shaped by decisions made by police, courts and other agencies. This means official statistics are socially constructed: they are produced through human definitions, categories and recording practices.
Comparing crime data sources
A student compares police recorded crime with the Crime Survey for England and Wales.
- Police recorded crime depends on victims reporting incidents and police recording them, so it may miss offences people do not report.
- The Crime Survey asks people directly about victimisation, so it can reveal some hidden crime, but it excludes some groups and depends on memory.
- A strong answer would use both sources, then evaluate how each constructs a different picture of crime.
Choosing between sources
A strong methods answer does not just list strengths and weaknesses. It links the source to the research aim.
Use PET evaluation
Evaluate sources through practical issues such as time, cost, access and sampling; ethical issues such as consent, confidentiality and harm; and theoretical issues such as positivist preference for reliability or interpretivist preference for validity.
For AQA essays, keep connecting sources of data to the two big sociology themes. Sources help us study socialisation, culture and identity by revealing beliefs, norms and meanings. They also help us study social differentiation, power and stratification by showing inequalities in class, gender, ethnicity, age, disability and sexuality.
In the exam
- Define the source clearly, then state whether it is usually primary/secondary and quantitative/qualitative.
- Apply it to the topic in the question: for example, education, crime, families, beliefs or social inequality.
- Evaluate with PET and theory: practical access, ethical risks, and whether the method is stronger for reliability, validity or representativeness.
Check yourself
- Why might a questionnaire be reliable but not very valid?
- How is participant observation different from non-participant observation?
- Why might official crime statistics tell a different story from the Crime Survey for England and Wales?