What you'll learn
- How to distinguish primary from secondary data.
- How to distinguish quantitative from qualitative data.
- How these categories combine in real sociological research.
- How to evaluate data using practical, ethical and theoretical issues.
Starting point: what counts as data?
Sociologists do not just make claims about society from opinion. They use data: evidence collected or analysed to answer a research question.
Data
Data are the evidence sociologists use to support an argument, such as survey responses, interview transcripts, observation notes, official statistics, photographs, diaries, policy documents or media content.
A research method is the technique used to gather or analyse data. Examples include questionnaires, interviews, observations, experiments, content analysis and the use of official statistics.
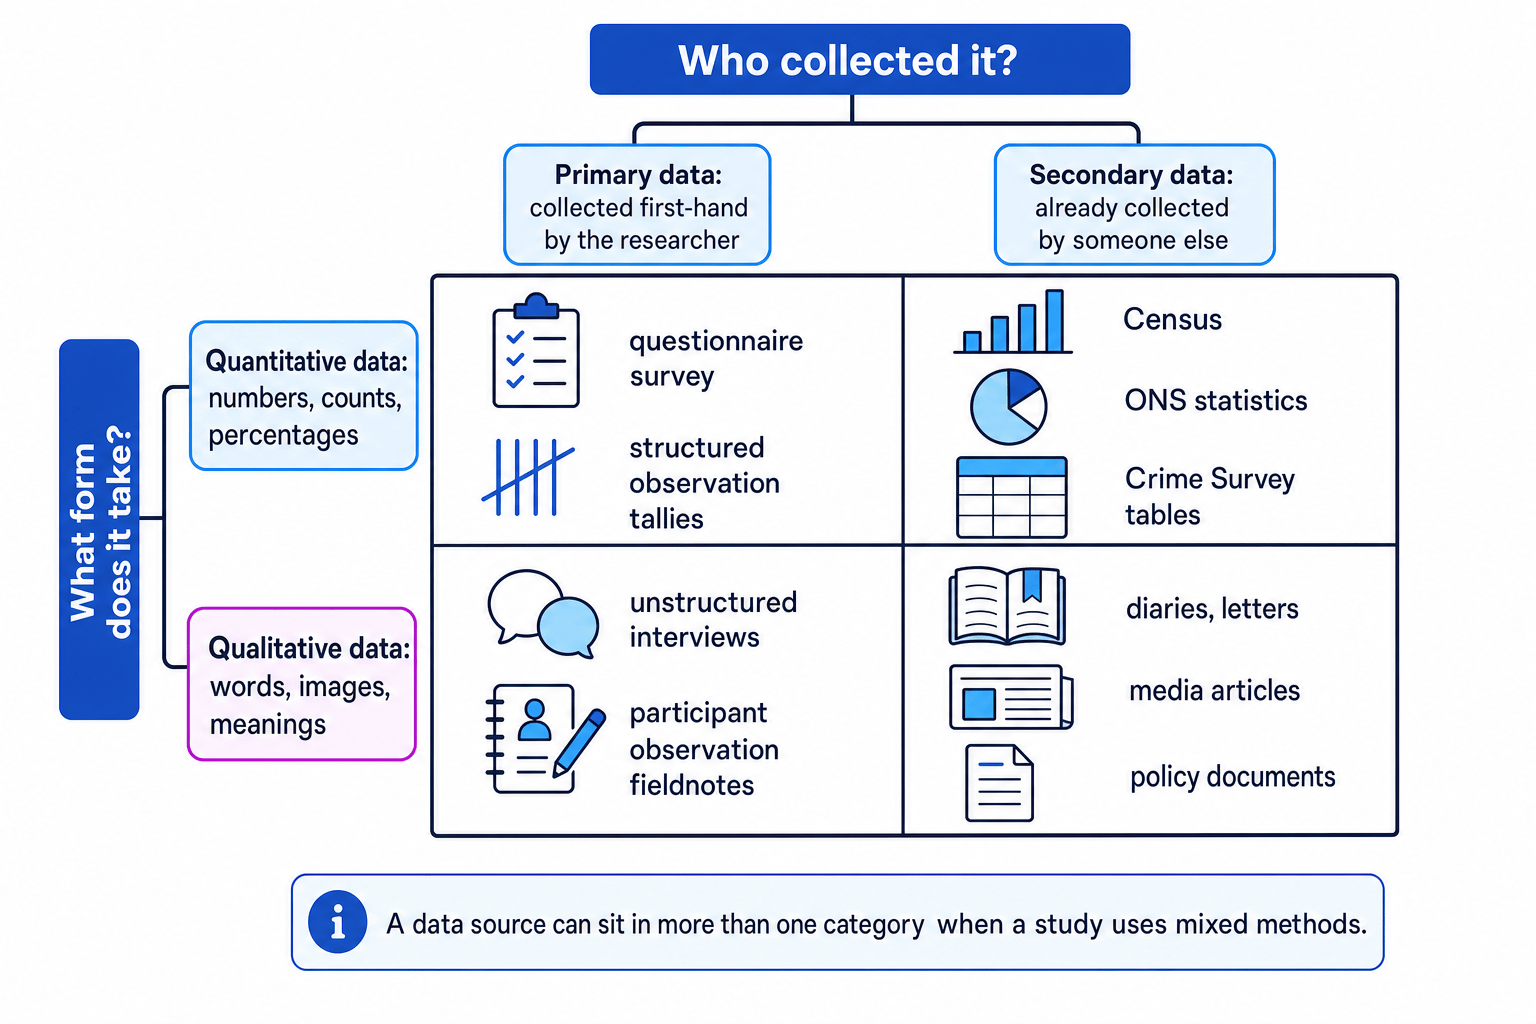
In this topic, you need to ask two separate questions about any data source:
- Who collected it? This tells you whether it is primary or secondary.
- What form does it take? This tells you whether it is quantitative or qualitative.
Two different distinctions
Primary/secondary is about the source of the data. Quantitative/qualitative is about the form of the data. Do not merge these into one distinction.
Primary and secondary data
Primary data
Primary data
Primary data are data collected first-hand by the sociologist for their own research purpose.
Examples include:
- a questionnaire you design and give to students
- a semi-structured interview you conduct with parents
- observation notes you write during a study of classroom behaviour
- a focus group you run about youth identities and social media
Primary data can be very useful because the researcher controls the research design. They can decide the questions, the sample, the setting and the ethical safeguards.
A sample is the smaller group selected from a wider population, meaning the full group the researcher wants to study. For example, if the population is “all Year 12 students in England”, a sample might be 500 Year 12 students from selected colleges.
Strengths of primary data
Primary data are often more directly linked to the researcher’s aims. If you want to study how working-class boys form masculine identities in school, you can design interviews or observations specifically around peer groups, language, status and teacher labelling.
Primary data also allow researchers to explore sensitive issues carefully, such as racism, poverty, sexuality, disability or domestic abuse, with attention to informed consent, meaning participants understand the research and agree to take part.
Limitations of primary data
Primary research can be expensive and time-consuming. Access can also be difficult: schools, prisons, workplaces or families may refuse entry. Researchers may struggle to build a sampling frame, which is a list of people from which a sample can be selected.
There are ethical risks too. Participants may experience embarrassment, distress or harm if research explores personal experiences of inequality, identity or victimisation. The researcher must protect confidentiality, meaning participants’ identities are not revealed.
Secondary data
Secondary data
Secondary data are data that already exist before the sociologist begins their research, collected by someone else for another purpose.
Examples include:
- the Census, such as Census 2021 data on ethnicity, religion and household structure
- Office for National Statistics data on employment, income or health
- Crime Survey for England and Wales tables
- school league tables or PISA education data
- diaries, letters, autobiographies, newspapers, TV programmes, websites and policy documents
- previous sociological studies, such as Durkheim’s use of official suicide statistics
Secondary data are especially useful for studying large-scale patterns of social differentiation, meaning differences between social groups, and stratification, meaning structured inequalities of power, status and resources.
Strengths of secondary data
Secondary data are often cheaper and quicker to use than collecting everything yourself. Official statistics can cover large populations, making them useful for studying trends over time, such as gender pay gaps, ethnic inequalities in employment, or regional deprivation.
They can also allow historical comparison. For example, sociologists can compare changes in religious identity using Census data, or compare social attitudes through long-running surveys.
Limitations of secondary data
The main problem is that the data may not fit the sociologist’s exact research question. Categories may be too broad, outdated or shaped by official priorities.
For example, Census categories for ethnicity and religion are not neutral “natural facts”. They reflect changing social understandings, political decisions and power relations. This matters for research into culture and identity, because official categories can shape how people are recognised or ignored.
Classifying a research source
A sociologist downloads Census 2021 tables on housing tenure and then conducts her own interviews with private renters about insecurity.
- The Census tables are secondary because they already existed before the sociologist began the project and were collected by the state, not by her.
- The Census tables are also quantitative because they are numerical, such as counts or percentages of renters, homeowners and social tenants.
- The interviews are primary because the sociologist collects them directly for her own research question.
- The interviews are qualitative if they produce detailed accounts of feelings, meanings and experiences, such as fear of eviction or stigma around renting.
Quantitative and qualitative data
Quantitative data
Quantitative data
Quantitative data are numerical data, such as counts, percentages, rates, rankings or scores.
Quantitative data are useful when sociologists want to measure patterns. For example, they might compare GCSE attainment by gender, income by social class, or stop and search rates by ethnicity.
This approach is often linked to positivism, the view that sociology should aim to study society scientifically, looking for observable patterns, causes and correlations. Durkheim’s study of suicide is a classic example because he used official statistics to compare suicide rates across social groups.
Quantitative data often support reliability, meaning another researcher could repeat the method and get similar results. They can also support representativeness, meaning the sample reflects the wider population. A high response rate means a large proportion of those contacted actually took part, reducing the risk that the findings are biased.
Levels of measurement
Quantitative data can vary in how much information the numbers provide.
- Nominal data place people into categories with no rank order, such as religion, ethnicity or type of school.
- Ordinal data have a rank order, such as “strongly agree” to “strongly disagree”, but the gaps between categories are not necessarily equal.
- Interval data have equal gaps between values but no true zero. These are less common in A-Level Sociology examples.
- Ratio data have equal gaps and a meaningful zero, such as age, income or number of siblings.
These distinctions matter because they affect how confidently sociologists can compare groups.
Limitations of quantitative data
Quantitative data may lack validity, meaning they may not capture what people really think, feel or experience. A survey might show that 70% of students “feel safe at school”, but that number does not explain how safety is shaped by gender, racism, sexuality, disability or peer-group culture.
Quantitative categories can also hide power inequalities. For example, “household income” may not show who controls money inside the household, which feminist sociologists argue is important for understanding patriarchy and domestic power.
Qualitative data
Qualitative data
Qualitative data are non-numerical data that focus on meanings, experiences, interpretations and social context.
Examples include interview transcripts, observation notes, life histories, diaries, images and conversations.
Qualitative data are often linked to interpretivism, the view that sociology should understand the meanings people give to their actions. Weber used the term verstehen to mean empathetic understanding of social action.
A famous example is Willis’s study Learning to Labour (1977), which used qualitative methods to explore how working-class boys developed an anti-school subculture. This is useful for the theme of socialisation, culture and identity, because it shows how young people learn values, perform masculinity and make sense of class position.
Strengths of qualitative data
Qualitative data can provide depth and detail. They are useful for studying identity, labelling, stigma, family relationships, religious belief, youth subcultures, media meanings or experiences of discrimination.
They can also challenge official definitions. For example, interviews with victims of domestic abuse may reveal experiences not fully captured in police statistics.
Limitations of qualitative data
Qualitative studies often involve smaller samples, so it may be harder to generalise to the wider population. They can also be less reliable because another researcher might interpret the same interview differently.
Ethically, qualitative research can be demanding because it may involve trust, emotional disclosure and close researcher-participant relationships. Oakley argued that feminist interviews should reduce hierarchy between researcher and participant, but this can make boundaries harder to manage.
Identifying quantitative and qualitative data
A school researcher asks students two questions: “How many hours of paid work do you do each week?” and “How does paid work affect your sense of belonging at school?”
- The first question produces quantitative data because the answer is numerical and can be compared across students.
- The second question produces qualitative data because it asks for meanings, feelings and explanations.
- The two questions answer different parts of the issue: the first shows the scale of paid work, while the second explores how work shapes identity and school experience.
- A stronger study could use both, because numerical patterns and personal meanings can support each other.
The four combinations
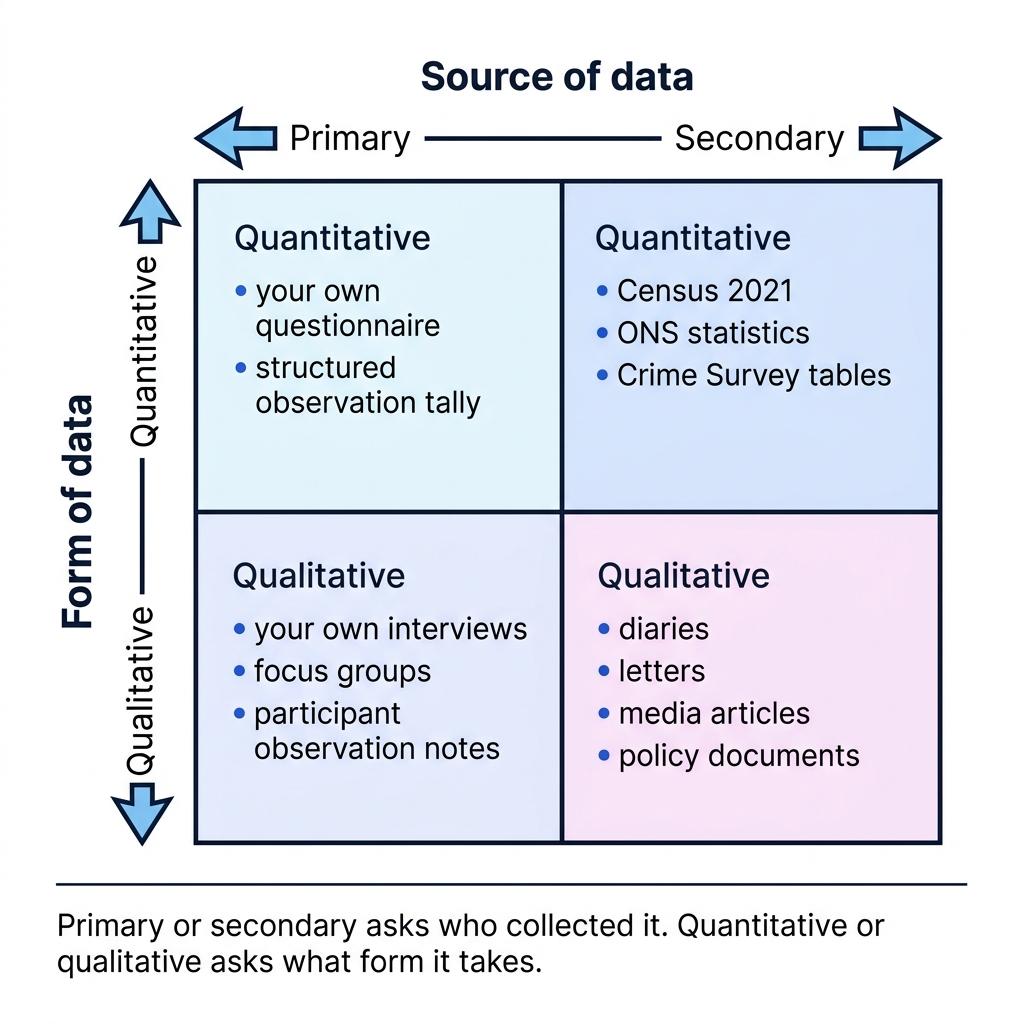
The two distinctions combine in four main ways:
| Combination | Examples | Useful for | Watch out for |
|---|---|---|---|
| Primary quantitative | Your own questionnaire, structured observation tally | Measuring patterns you choose | Low response rates, superficial answers |
| Primary qualitative | Your own interviews, focus groups, participant observation | Exploring meanings and identity | Access, ethics, small samples |
| Secondary quantitative | Census, ONS, Crime Survey, PISA tables | Large-scale trends and inequalities | Official categories may be socially constructed |
| Secondary qualitative | Diaries, letters, media articles, policy documents | Studying culture, discourse and historical meaning | Authenticity, bias and missing context |
Assuming one pair always goes together
Do not assume primary data are always qualitative, or secondary data are always quantitative. A questionnaire you design is primary quantitative; a diary written in the past is secondary qualitative.
Mixed methods and triangulation
Many sociologists use mixed methods, meaning they combine more than one method or type of data. Triangulation means using multiple sources of data to check or deepen findings.
For example, a researcher studying class inequalities in education might use:
- secondary quantitative data from the Department for Education on attainment by free school meal eligibility
- primary qualitative interviews with pupils about aspirations, teacher expectations and peer cultures
- secondary qualitative policy documents on “raising standards”
This gives a fuller picture than any one data source alone.
Choosing data for a research question
Research question: “How does social class shape students’ A-Level subject choices?”
- To measure whether subject choices vary by class, the researcher needs quantitative data, such as school records or survey results comparing subjects with parental occupation or free school meal eligibility.
- To understand why students choose certain subjects, the researcher needs qualitative data, such as interviews about family expectations, careers advice, confidence and identity.
- Existing school or government data would be secondary if already collected, saving time but possibly using categories that do not exactly match the researcher’s definition of class.
- Interviews conducted by the researcher would be primary, improving fit with the research aim but raising practical issues of access to schools and ethical issues of consent and confidentiality.
Evaluating data in A-Level answers
When you evaluate data, use three types of issue.
Practical issues
Practical issues concern time, cost, access and organisation. Secondary quantitative data are often efficient, but may be hard to interpret. Primary qualitative research can be rich, but slow and difficult to access.
Ethical issues
Ethical issues concern informed consent, confidentiality, privacy and harm. Sensitive topics such as poverty, racism, sexuality, religion, crime or family conflict require careful protection of participants.
Theoretical issues
Theoretical issues concern what kind of knowledge sociologists think is best. Positivists usually value reliable, representative quantitative data. Interpretivists usually value valid, detailed qualitative data.
However, this is not a simple “one is better” debate. Quantitative data can reveal hidden inequalities at national scale, while qualitative data can reveal how those inequalities are lived and understood.
Quick evaluation sentence
A strong methods paragraph often says: “This data is useful because..., but it may be limited because..., especially when studying...” Then link the final part to the group or issue in the question.
In the exam
- Keep the two distinctions separate: primary/secondary is about who collected the data; quantitative/qualitative is about what form it takes.
- Use named examples where possible, such as Census 2021, ONS statistics, the Crime Survey for England and Wales, Durkheim, Willis or Oakley.
- Evaluate with practical, ethical and theoretical issues, then link to validity, reliability, representativeness or power inequalities.
Check yourself
- Can you classify a questionnaire designed by a sociologist as primary/secondary and quantitative/qualitative?
- Why might official statistics be useful but also limited for studying ethnicity, class or gender inequality?
- How could mixed methods improve a study of youth identity or educational achievement?