What you'll learn
- How quantitative and qualitative methods produce different kinds of sociological evidence.
- How sociologists design research from a question through to sampling, ethics and analysis.
- How to evaluate methods using reliability, validity, representativeness and practical/ethical/theoretical issues.
- How method choice links to power, identity, socialisation and inequality in contemporary UK society.
Starting point: what is a research method?
Sociologists do not just “collect facts”. They make decisions about what counts as evidence, whose voices are included, and how social life should be studied. That matters because methods can reveal different things about socialisation, culture and identity, and about social differentiation, power and stratification.
Methods, design and data
- Research method means a tool used to collect or analyse evidence, such as a questionnaire, interview, observation or official statistic.
- Research design means the overall plan that links the research question, theory, sample, method, ethics and analysis.
- Data means evidence gathered or used by researchers.
- Primary data is collected first-hand by the researcher.
- Secondary data already exists, such as Census data, school league tables or historical documents.
Quantitative methods: patterns in numbers
Quantitative methods produce evidence in numerical form. They are useful when sociologists want to measure patterns across large groups, compare categories, or test relationships between variables. A variable is a feature that can vary, such as gender, age, social class, ethnicity, income, religion or educational achievement.
A hypothesis is a testable statement about a relationship between variables, for example: “Students eligible for free school meals are less likely to achieve high GCSE grades than students not eligible.”
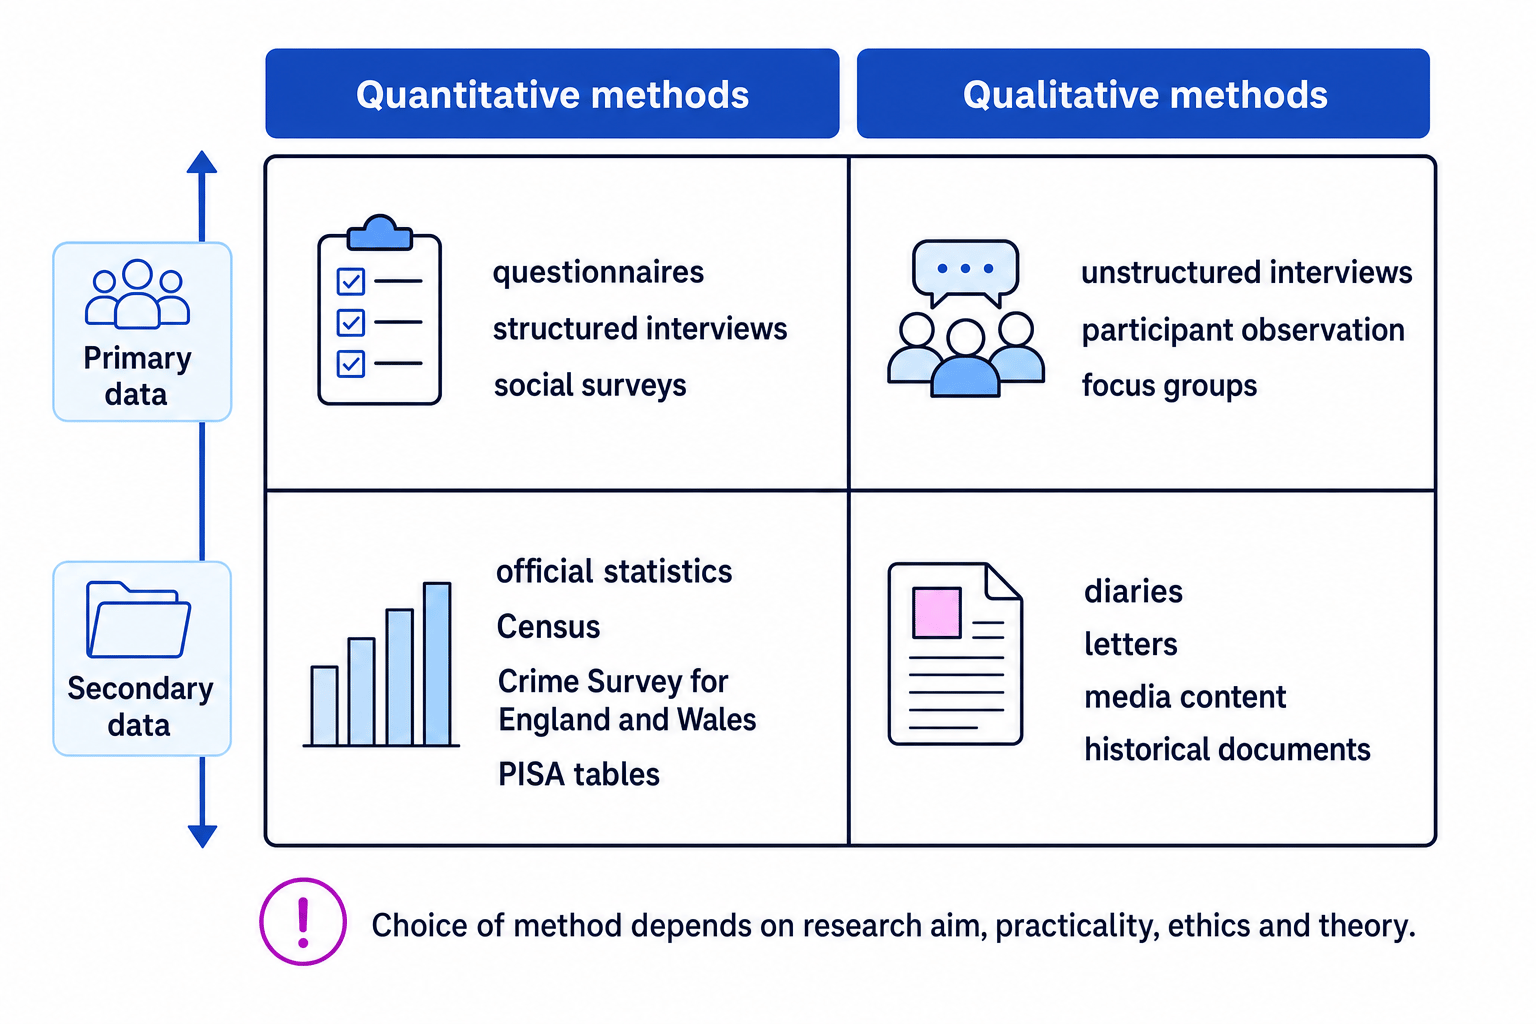
Quantitative methods include:
- questionnaires with closed questions
- structured interviews
- social surveys
- official statistics, such as the Census, Crime Survey for England and Wales, ONS deprivation indices and PISA education tables
- some forms of content analysis, where texts or images are counted and categorised
Levels of measurement
When sociologists measure variables, the type of measurement affects what they can do with the data.
| Level | Meaning | Sociology example |
|---|---|---|
| Nominal | Categories with no order | Religion, ethnicity, school type |
| Ordinal | Ordered categories | Social class groups, attitude scales from “strongly agree” to “strongly disagree” |
| Interval | Equal gaps between scores, but no true zero | Some attitude or ability scales |
| Ratio | Equal gaps and a meaningful zero | Age, income, number of exclusions |
What quantitative methods are best at
Quantitative methods are strongest when you need a broad map of social patterns, especially inequalities by class, gender, ethnicity, age, region or disability. Their weakness is that numbers may simplify complex meanings and identities.
Strengths of quantitative methods
Quantitative research often has high reliability, meaning it can be repeated in a consistent way. For example, if every respondent is asked the same survey question in the same order, another researcher could repeat the study more easily.
It can also be representative if the sample reflects the wider population. This supports generalisability, which means applying findings from the sample to the wider group. The Census is especially powerful because it covers almost the whole UK population and can show long-term changes in family structure, religion, ethnicity and housing.
Quantitative data is also useful for identifying correlations, meaning relationships between variables. For instance, PISA tables may show links between national education systems and pupil performance, while ONS deprivation data can show geographical patterns of inequality.
Weaknesses of quantitative methods
Quantitative research may have weaker validity, meaning it may not accurately capture what it claims to measure. For example, measuring social class only by occupation may miss wealth, cultural capital, lifestyle and identity.
Interpretivists criticise official statistics because they may be socially constructed. This means the numbers are shaped by the decisions of organisations and officials. For example, crime statistics are affected by reporting, policing priorities and recording rules. Atkinson’s work on suicide also questioned whether official suicide statistics reflect social reality or coroners’ interpretations.
Selecting a quantitative design for educational inequality
-
Choose the research aim: you want to examine whether pupils from lower-income households are less likely to achieve high GCSE grades across England, so a large-scale quantitative design is suitable.
-
Operationalise the concepts: “lower-income household” could be measured using free school meal eligibility, and “achievement” could be measured using GCSE attainment or Progress 8 scores. This gives clear variables, but it may not capture the full meaning of class identity.
-
Choose the data source: Department for Education statistics would be practical because they cover large numbers of pupils and allow comparisons by region, gender and ethnicity.
-
Evaluate the design: the design is reliable and representative, but it cannot explain pupils’ experiences of labelling, peer culture or teacher expectations. A qualitative follow-up could improve validity.
Qualitative methods: meanings in context
Qualitative methods produce non-numerical evidence, such as words, stories, observations, images or documents. They are useful when sociologists want to understand meanings, motives, identities and social processes.
Qualitative methods are linked to interpretivism, the view that sociologists should understand people’s subjective meanings rather than treating society like a natural science. Weber used the term verstehen, meaning understanding social action from the actor’s point of view.
Qualitative methods include:
- unstructured or semi-structured interviews
- participant observation
- focus groups
- diaries, letters and personal documents
- qualitative content analysis of media, policy documents or online spaces
Strengths of qualitative methods
Qualitative research often has high validity because it can get close to people’s lived experiences. For example, Willis’s Learning to Labour (1977) used ethnography to show how working-class “lads” developed an anti-school culture that shaped their identities and future class positions.
This is especially useful for studying socialisation and culture. A survey might show that some pupils dislike school, but observation and interviews can reveal how peer groups create status, humour and resistance.
Qualitative methods can also reveal power relations. Feminist researchers such as Oakley criticised highly structured interviews for creating an unequal relationship between researcher and respondent. More open interviews may allow women or marginalised groups to describe experiences in their own terms.
Weaknesses of qualitative methods
Qualitative studies often use smaller samples, so they may be less representative. They can also be harder to repeat, which may reduce reliability. In participant observation, the researcher effect may occur when people change their behaviour because they know they are being studied.
There are also ethical issues. Studying sensitive topics such as domestic abuse, racism, crime or mental health requires careful attention to informed consent, confidentiality and avoiding harm.
Treating qualitative as automatically less scientific
Do not simply write “qualitative methods are biased”. A stronger evaluation is that qualitative methods may be less reliable or representative, but they can produce deeper validity and reveal meanings that quantitative data misses.
The method map: quantitative, qualitative, primary and secondary
Do not confuse the type of data with the source of the data. A questionnaire can be primary quantitative data, while Census results are secondary quantitative data. A diary collected from an archive is secondary qualitative data.
Research design: turning an idea into a study
A strong research design starts with a clear question, then makes connected choices. You should be able to explain why the method fits the aim, rather than listing generic strengths and weaknesses.
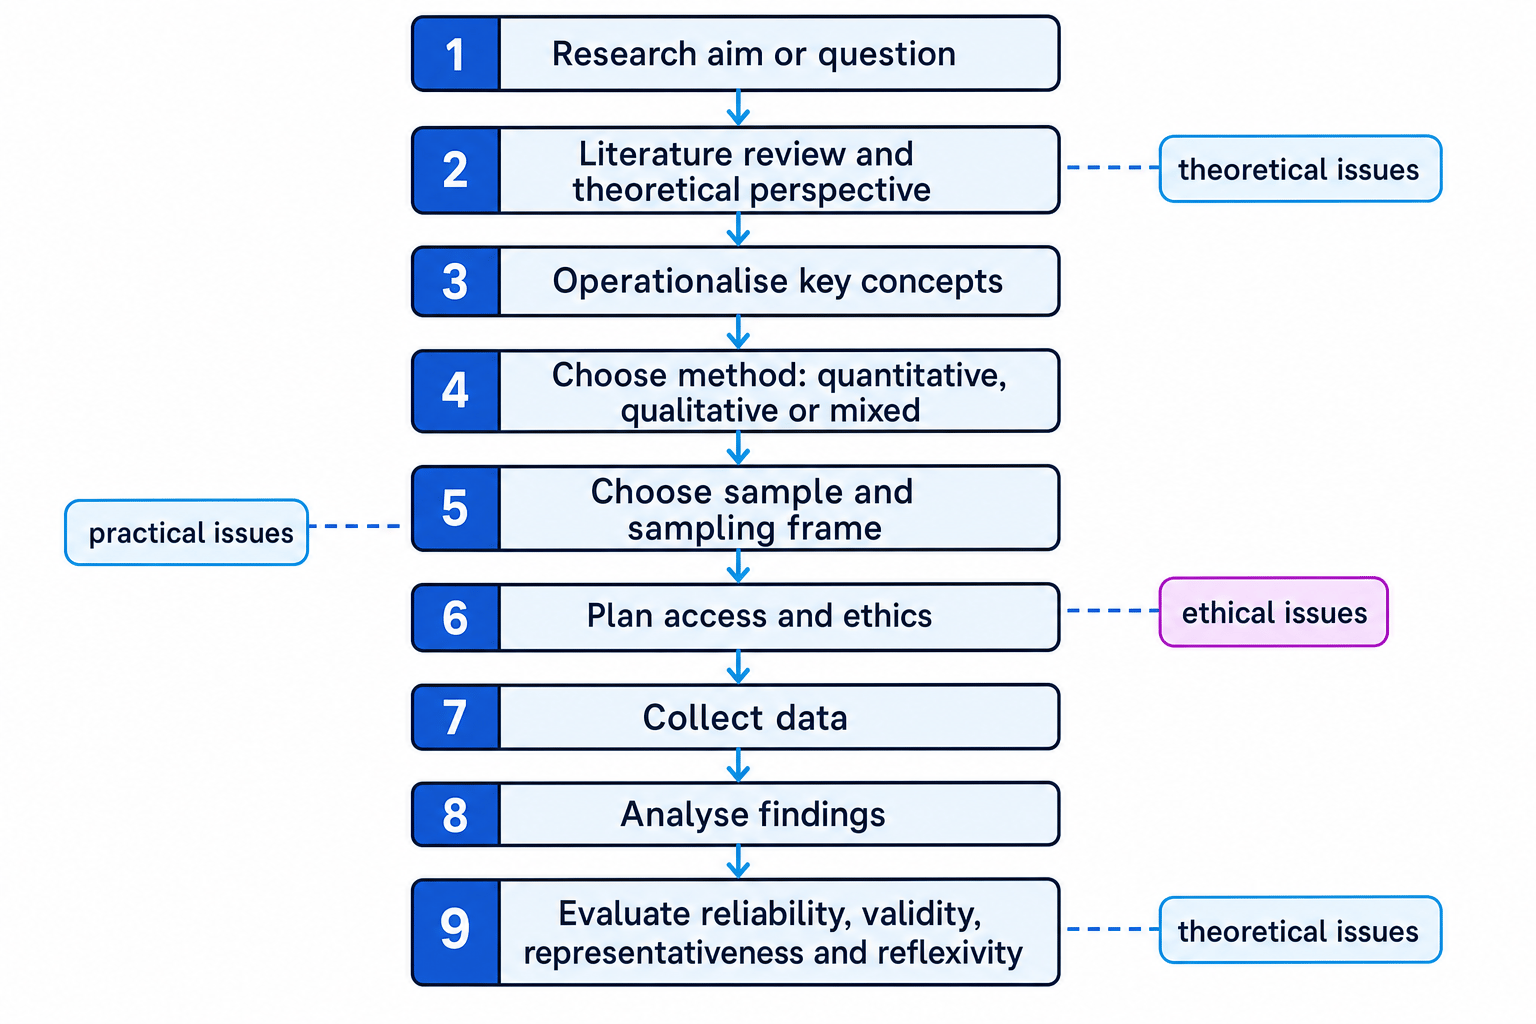
Key stages in research design
First, the sociologist defines the research aim. This could be explanatory, such as “Does social class affect educational achievement?”, or exploratory, such as “How do young carers experience school?”
Second, they review existing research and theory. A positivist researcher may prioritise measurement and causal patterns. An interpretivist researcher may prioritise meanings and interaction.
Third, they operationalise concepts. To operationalise means turning an abstract idea into something measurable or researchable. For example, “deprivation” might be operationalised through income, housing quality, unemployment, health and access to services.
Fourth, they choose a method or use mixed methods, meaning a combination of quantitative and qualitative approaches. Triangulation means using more than one source or method to check findings and build a fuller picture.
Fifth, they choose a sample. A sampling frame is the list from which a sample is selected, such as a school register or postcode database. A response rate is the proportion of selected people who actually take part. Low response rates can create non-response bias, where those who respond differ from those who do not.
| Sampling technique | What it means | Evaluation |
|---|---|---|
| Random sample | Everyone in the sampling frame has a known chance of selection | Can be representative, but needs a good sampling frame |
| Stratified sample | The sample reflects key groups in the population | Useful for class, gender or ethnicity comparisons |
| Quota sample | Researcher fills set categories | Practical, but not fully random |
| Snowball sample | Participants recruit other participants | Useful for hidden groups, but may be unrepresentative |
| Opportunity sample | Uses people who are easy to access | Quick, but weak for generalisation |
Use PET to evaluate research design
For any method, check practical issues such as time, cost and access; ethical issues such as consent, confidentiality and harm; and theoretical issues such as reliability, validity, representativeness and positivist or interpretivist assumptions.
Designing a mixed-methods study of policing and young people
-
Start with a two-part aim: measure whether stop and search experiences differ by ethnicity, age and area, and explore how these experiences shape young people’s trust in the police.
-
Choose quantitative data first: use Home Office stop and search statistics or a survey to identify patterns across social groups. This helps address power and stratification because it compares who is more likely to be stopped.
-
Add qualitative interviews: speak to young people through youth organisations or schools to explore meanings, identity, stigma and feelings of safety. This improves validity because it captures lived experience.
-
Evaluate the design: triangulation gives both breadth and depth, but access may be difficult, participants may fear disclosure, and official ethnic categories may not match how young people define themselves.
What examiners want you to do with this topic
For AO1, know the concepts: quantitative, qualitative, primary, secondary, reliability, validity, representativeness, sampling and research design.
For AO2, apply them to real examples: the Census, CSEW, ONS deprivation indices, school statistics, PISA, youth cultures, policing, education or family life.
For AO3, evaluate. Compare positivist and interpretivist assumptions. Ask what the method reveals, what it hides, and whose interests or identities are represented.
In the exam
-
Link the method to the research aim: explain why a survey, interview, observation or statistic fits the question being asked.
-
Use the key evaluation language precisely: reliability, validity, representativeness, generalisability, response rate and operationalisation.
-
Apply PET: include at least one practical, one ethical and one theoretical issue where relevant.
-
Avoid one-sided answers: show the trade-off, such as breadth versus depth, reliability versus validity, or patterns versus meanings.
Check yourself
- Why might a sociologist use official statistics to study inequality, but interviews to study identity?
- What is the difference between reliability and validity?
- How could a mixed-methods design improve a study of educational achievement?
