What you'll learn
- How sociologists classify sources of data: primary, secondary, quantitative and qualitative.
- The main features of questionnaires, interviews, observation, experiments, documents and official statistics.
- How to evaluate each source using practical, ethical and theoretical issues.
- How to apply methods to UK examples involving identity, culture, power and inequality.
First: what counts as data?
In Sociology, data means the evidence researchers use to describe, explain or understand social life. A source of data is where that evidence comes from. A research method is the technique used to collect or analyse it.
For example, if you study class differences in school achievement, your data might come from pupil interviews, classroom observation, DfE statistics, school behaviour records or newspaper reports about education policy.
Core data types
- Primary data is data collected first-hand by the sociologist for their own research.
- Secondary data is data that already exists, collected or created by someone else.
- Quantitative data is numerical data, often used to identify patterns and correlations.
- Qualitative data is detailed, non-numerical data about meanings, motives and experiences.
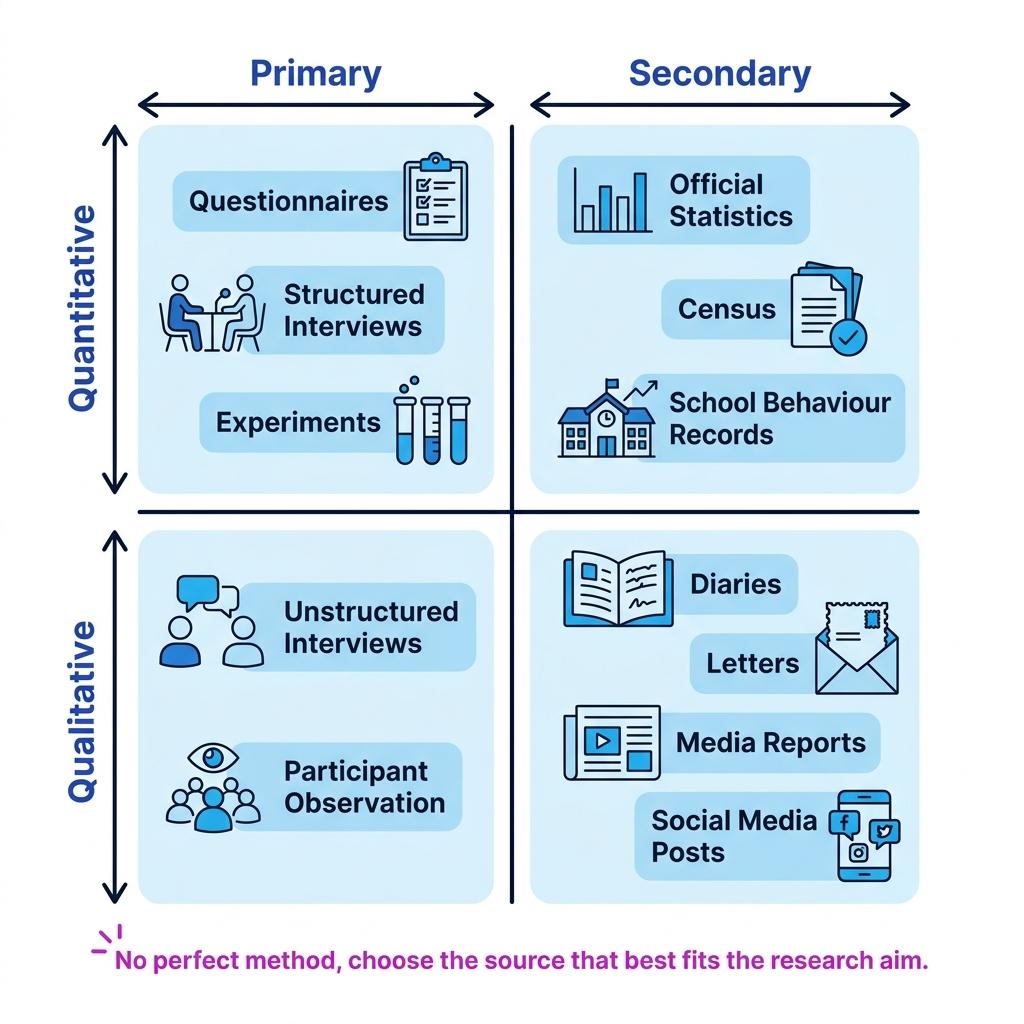
A helpful way to map sources of data is to place them on two axes: primary versus secondary, and quantitative versus qualitative.
No perfect method
There is no single “best” source of data. Strong answers explain whether a source fits the research aim, the topic, the participants, and the researcher’s theoretical perspective.
Choosing a source for a research aim
A sociologist wants to study how working-class pupils experience teacher labelling.
- Match the aim to the type of data needed. “Experience” and “labelling” involve meanings, interactions and identity, so qualitative data is likely to be useful.
- Choose a source that can access those meanings. Unstructured interviews or participant observation could reveal how pupils interpret teachers’ comments and sanctions.
- Evaluate the trade-off. These methods may have high validity, but small samples may reduce representativeness, so findings may not generalise to all working-class pupils.
The evaluation toolkit
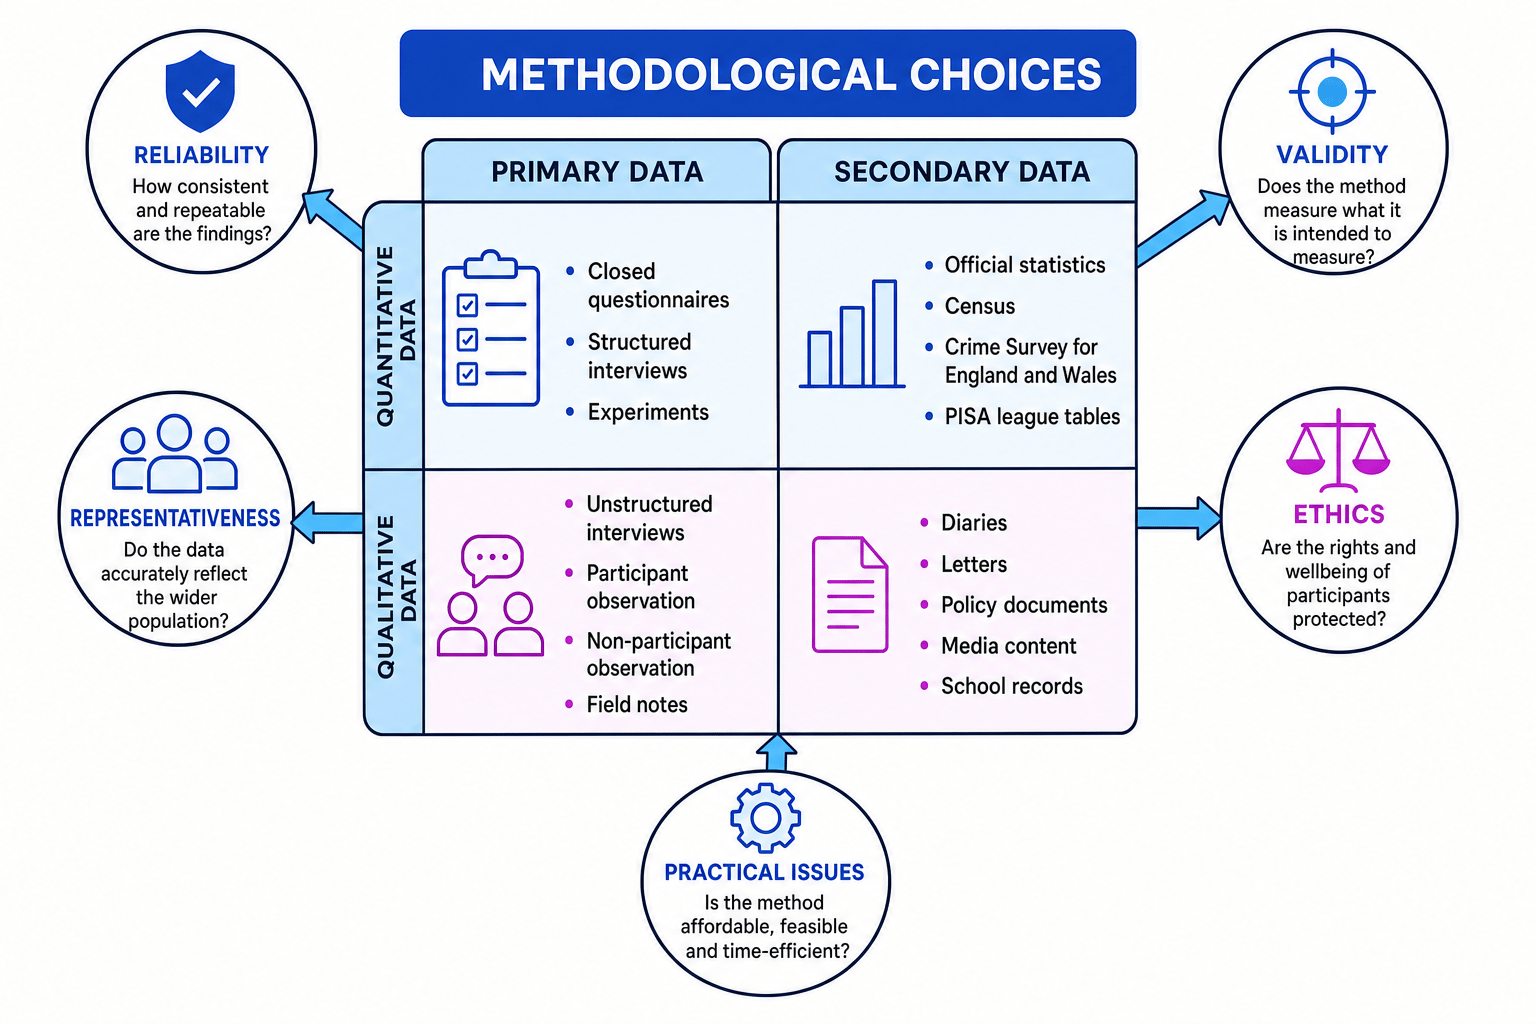
When you evaluate any source of data, use three big categories.
Practical issues
Practical issues are about whether the research is feasible: time, cost, access, researcher skill, sample size and response rate.
Ethical issues
Ethical issues are about protecting people’s rights and wellbeing. Key ideas include informed consent: participants should understand the research before agreeing; confidentiality: personal information should not be revealed; and avoiding harm.
Theoretical issues
Theoretical issues are about the kind of knowledge the method produces.
Three key quality tests
- Reliability means the method is consistent and repeatable.
- Validity means the method measures or captures what it claims to measure.
- Representativeness means the sample reflects the wider population being studied.
PET plus RVR
For evaluation, think PET: practical, ethical, theoretical. Then make your theoretical evaluation sharper with RVR: reliability, validity, representativeness.
Questionnaires
A questionnaire is a list of written questions completed by respondents. A respondent is someone who answers research questions.
Questionnaires often use closed questions, where people choose from fixed answers, such as “strongly agree” to “strongly disagree”. These produce quantitative data. They may also include open questions, where respondents write their own answers, producing limited qualitative data.
Questionnaires are often favoured by positivists: sociologists who believe society can be studied scientifically by collecting objective, measurable data. Because the same questions are asked in the same way, questionnaires can be reliable and useful for comparing large groups.
They are practical too. Online questionnaires can be cheap, quick and distributed widely. They can also feel anonymous, which may help when researching sensitive topics such as experiences of poverty, racism or family conflict.
However, questionnaires can lack validity. Respondents may misunderstand questions, rush answers, or give socially desirable responses. Low response rates can also damage representativeness, especially if marginalised groups are less likely to reply.
Evaluating a questionnaire on gender-role attitudes
A sociologist uses an online questionnaire to study attitudes towards housework among 16–18-year-olds.
- Identify the likely strength. Closed questions allow easy comparison between gender, class and ethnic groups, so the researcher can identify broad patterns.
- Apply a validity issue. Attitudes to housework may be shaped by family culture and socialisation, but fixed answers may not capture why young people think as they do.
- Apply a representativeness issue. If the questionnaire is shared mainly through sixth-form networks, it may under-represent young people in apprenticeships, work or unemployment.
Treating numbers as automatically valid
Quantitative data can look objective, but numbers still depend on question wording, sampling, response rates and how categories are defined.
Interviews
An interview is a research conversation where an interviewer asks questions and records answers.
There are three main types. A structured interview uses fixed questions, like a spoken questionnaire. A semi-structured interview has prepared questions but allows follow-up discussion. An unstructured interview is more flexible and participant-led.
Structured interviews tend to be more reliable because each participant is asked the same questions. Unstructured interviews often have higher validity because they allow people to explain meanings in their own words.
Interpretivists often prefer unstructured interviews. Interpretivism is the view that sociology should understand social action from the point of view of the people involved. Weber called this verstehen, meaning empathetic understanding.
Interviews can be especially useful for studying socialisation, culture and identity: for example, how young people describe masculinity, religious identity or experiences of racism. They can also reveal power inequalities, such as how benefit claimants experience stigma.
But interviews have limits. The interviewer effect means the interviewer’s age, gender, ethnicity, accent or behaviour may influence responses. Participants may also exaggerate, hide information or tell the interviewer what they think is acceptable.
Choosing an interview format for a sensitive topic
A sociologist wants to research Muslim girls’ experiences of identity and belonging in school.
- Consider sensitivity and meaning. The topic involves personal identity, religion, gender and possible discrimination, so detailed qualitative data is needed.
- Choose the interview type. A semi-structured interview gives enough guidance to cover school, family and peer-group themes while still allowing participants to raise unexpected issues.
- Evaluate ethically. The researcher must protect confidentiality and avoid pressure, especially if interviews happen through school where pupils may feel obliged to take part.
Observation
Observation means watching social behaviour directly. It is useful when researchers want to see what people do, not just what they say they do.
In participant observation, the researcher joins in with the group being studied. In non-participant observation, the researcher watches without taking part. Observation may be overt, where people know they are being studied, or covert, where they do not.
Participant observation can produce rich qualitative data and high validity. Willis’s study of working-class “lads” in Learning to Labour (1977) used ethnographic methods to show how anti-school culture shaped boys’ identities and future class positions.
However, observation is often time-consuming and difficult to access. Covert observation raises serious consent issues. Overt observation may create the Hawthorne effect, where people change their behaviour because they know they are being watched.
Evaluating participant observation of a youth subculture
A researcher studies a group of skateboarders in a city centre.
- Apply a validity strength. Joining the group may reveal informal rules, humour, status and identity that would not appear in a questionnaire.
- Apply a practical weakness. Access may take months because the group must trust the researcher before behaving naturally.
- Apply a theoretical weakness. The findings may be hard to repeat and may not represent all youth subcultures, so reliability and representativeness are limited.
Experiments
An experiment investigates cause and effect by changing one factor and observing the result. The factor changed is the independent variable; the outcome measured is the dependent variable. A control group is a comparison group that does not receive the experimental change.
Laboratory experiments are rare in Sociology because social life is hard to control and artificial settings may reduce validity. Field experiments happen in real-world settings. Natural experiments compare groups affected by real social changes, such as policy reforms.
Experiments appeal to positivists because they can be reliable and can test causal relationships. Rosenthal and Jacobson’s school study (1968), often linked to teacher expectations, is useful for thinking about how labels may affect pupil performance.
Field experiments are also used to study discrimination. For example, researchers may send identical job applications with different names to test whether employers treat ethnic groups differently.
Testing discrimination with a field experiment
A researcher sends matched CVs to employers, changing only the applicant’s name.
- Identify the causal design. If qualifications and experience are identical, the name is the key variable being tested.
- Apply to power and stratification. Different callback rates may show how ethnic inequality operates within the labour market.
- Evaluate the method. The design is strong for testing discrimination, but there are ethical issues because employers have not given informed consent.
Documents
Documents are existing written, visual or digital materials. They can include diaries, letters, school records, government reports, newspapers, films, websites and social media posts.
Documents may be analysed quantitatively through content analysis, where researchers count categories or themes. They may also be analysed qualitatively to interpret meanings, representations and discourse.
Scott (1990) suggested four tests for documents: authenticity: is it genuine? Credibility: is it accurate? Representativeness: is it typical? Meaning: what does it mean in context?
Documents are useful because they are often cheap and non-reactive: people do not change their behaviour for the researcher because the document already exists. They can also show how culture and identity are represented, such as media portrayals of migrants, benefits claimants or young people.
But documents are not neutral. They are produced by people and institutions with particular interests. A school behaviour record, for example, may reflect official power as much as pupil behaviour.
Applying Scott’s tests to school records
A researcher uses school exclusion letters to study class and discipline.
- Check authenticity and credibility. The letters may be genuine official records, but they only show the school’s version of events.
- Check representativeness. One school’s records may not represent schools with different intake, policies or leadership.
- Check meaning. Terms like “defiance” or “disruption” need interpretation because they may reflect teacher judgement and institutional power.
Official statistics
Official statistics are numerical data produced by government departments or public bodies. Examples include the Census, ONS data, police recorded crime, the Crime Survey for England and Wales, DfE education statistics, NHS data and unemployment figures.
Official statistics are often large-scale, cheap to access and useful for identifying trends. The Census, for example, helps sociologists analyse changes in family structure, religion, ethnicity, housing and migration in the UK.
Durkheim used official suicide statistics to argue that suicide rates were shaped by social integration and regulation. However, Atkinson criticised this approach, arguing that suicide statistics are socially constructed through decisions by coroners, doctors, families and officials.
Social construction of statistics
To say statistics are socially constructed means they are shaped by human definitions, recording practices and institutional decisions, not simply “found” as pure facts.
Some statistics are “harder” than others. Birth and death statistics are usually seen as relatively reliable. Crime, unemployment and suicide statistics are “softer” because they depend more heavily on reporting, definitions and recording rules.
Reading crime statistics critically
A headline says police recorded knife crime has increased.
- Ask what is being measured. Police recorded crime measures incidents known to and recorded by the police, not all knife crime.
- Consider recording and reporting. An increase may reflect more crime, but it may also reflect greater willingness to report or changes in police recording practices.
- Triangulate with another source. Comparing police data with the Crime Survey for England and Wales or NHS hospital data can improve evaluation.
Linking methods to theory
Different sociological perspectives tend to prefer different sources of data.
Positivists usually favour questionnaires, structured interviews, experiments and official statistics because these can produce reliable, comparable, quantitative data.
Interpretivists usually favour unstructured interviews, participant observation and personal documents because these can produce valid qualitative data about meanings and identity.
Feminist researchers often focus on power in the research relationship. Oakley criticised hierarchical interviewing and argued for more equal, supportive interviews. However, feminists may also use official statistics to expose gender inequality, such as pay gaps, domestic labour or violence against women.
Method choice is sociological
Your choice of data source is not just technical. It affects whose voices are heard, which inequalities become visible, and how social reality is represented.
In the exam
- Name the source precisely: for example, “structured interview” rather than just “interview”.
- Apply the method to the topic in the question: say what kind of data it would produce and from whom.
- Evaluate with practical, ethical and theoretical issues, especially reliability, validity and representativeness.
- Compare methods where useful: for example, questionnaires may show patterns, while interviews may explain meanings.
Check yourself
- Which source of data would be most useful for studying young people’s class identities, and why?
- Why might official crime statistics lack validity?
- How would a positivist and an interpretivist evaluate unstructured interviews differently?