What you'll learn
- The purpose of each main section in a psychology practical report.
- How to organise method, results, discussion, references and appendices clearly.
- How Harvard referencing works in OCR A-Level Psychology.
- Why peer review matters for making psychology more scientific and trustworthy.
Why report writing matters
A practical report is a formal write-up of a psychological investigation. It follows a standard structure so another psychologist can understand what was done, check whether the conclusions are justified, and potentially replicate the study — meaning repeat it using the same procedure to see whether similar findings occur.
The report is a fixed route: summary first, then background, then method, then evidence, then interpretation, then sources and supporting material.
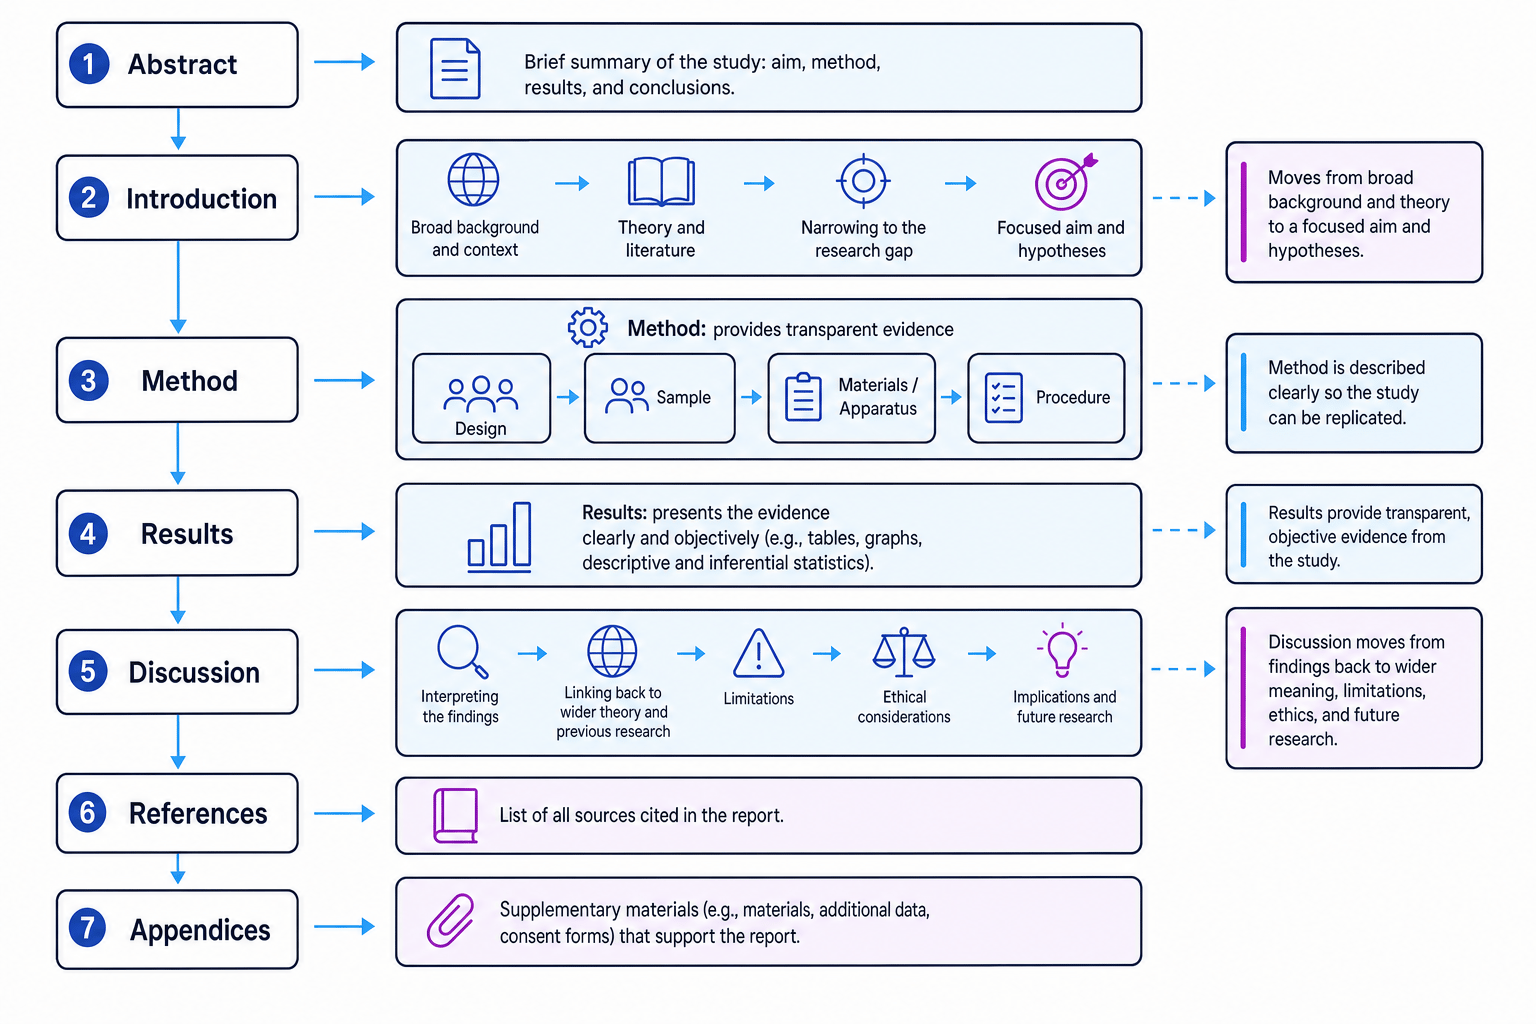
The purpose of a report
A practical report is not just “what happened”. It is an argument that your study was planned carefully, carried out ethically, analysed appropriately, and interpreted cautiously.
The main sections of a practical report
Abstract
The abstract is a brief overview of the whole report. It usually summarises the aim, method, key results and conclusion.
Although it appears first, it is often easiest to write last because you need to know exactly what your study found before you can summarise it.
Introduction
The introduction explains the background to the study. It moves from wider psychological theory and previous research to your specific aim and hypotheses.
For OCR H567, this is where you might cite relevant core studies, such as Bandura et al. (1961) on aggression, Milgram (1963) on obedience, Sperry (1968) on split-brain research, or Loftus and Palmer (1974) on eyewitness testimony.
An aim states what the study is trying to investigate. A hypothesis is a testable prediction. The null hypothesis predicts no significant effect, difference or relationship.
Method
The method explains exactly how the study was carried out. It should be clear enough for replication.
Design
The design describes the type of study and how variables were organised. For example, in an experiment you would identify the independent variable, which is manipulated, and the dependent variable, which is measured. You may also state whether the design was independent measures, repeated measures or matched pairs.
Sample
The sample is the group of participants used in the study. This subsection should include the number of participants, relevant characteristics, and the sampling method, such as opportunity sampling or volunteer sampling.
Materials/apparatus
Materials or apparatus are the items used to conduct the study, such as questionnaires, word lists, consent forms, standardised instructions, debrief sheets or computer tasks.
Procedure
The procedure gives a step-by-step account of what participants experienced. It should include ethical features such as informed consent, right to withdraw, confidentiality, protection from harm and debriefing, in line with the BPS Code of Human Research Ethics.
Method vs procedure
Do not put everything into “procedure”. The method section has separate jobs: design explains the structure, sample explains who took part, materials explain what was used, and procedure explains what happened in order.
Results
The results section presents the findings clearly and objectively. It should not turn into a long interpretation — save that for the discussion.
Results may include:
- Descriptive statistics: summaries of data, such as mode, median, mean, range, variance and standard deviation.
- Percentages, fractions and ratios: ways of showing proportions, such as 60%, 3/5 or 3:2.
- Graphs: bar charts for categories, histograms for continuous interval data, line graphs for change over time or conditions, pie charts for proportions, and scatter diagrams for correlations.
- Inferential statistics: tests used to judge whether findings are likely to be due to chance.
You also need to understand levels of measurement. Nominal data are categories, such as “male/female” or “yes/no”. Ordinal data are ordered or ranked, but the gaps are not necessarily equal. Interval data use equal intervals between scores, such as scores on a memory test.
If reporting inferential statistics, state the statistical test, the observed value, the critical value from a statistical table, the significance level, and whether the result is significant. A common significance level is 0.05, meaning a 5% probability of the result occurring by chance if the null hypothesis is true.
Non-parametric tests you should recognise include:
- Mann-Whitney U: difference test for independent groups.
- Wilcoxon Signed Ranks: difference test for related groups.
- Chi-square: test of association or difference using nominal data.
- Binomial Sign Test: difference test for related nominal data.
- Spearman’s Rho: correlation test for ranked or ordinal data.
A parametric test is usually considered when data are interval level, approximately normally distributed, have no major outliers, and meet assumptions such as similar variance across groups.
Use symbols carefully
In results sections, symbols such as =, <, >, <<, >>, ~ and ∞ should only be used when they add precision. For significance, write something meaningful, such as p<0.05p < 0.05p<0.05, rather than dropping symbols in without explanation.
Selecting what to report in Results
A repeated-measures memory study compares recall scores in silence and with background noise. The scores are not normally distributed. The calculated Wilcoxon value is T=5T = 5T=5 and the critical value is 8 at the 0.05 significance level.
- The study is testing a difference between two related conditions because the same participants completed both conditions, so Wilcoxon Signed Ranks is appropriate.
- Because the data are not normally distributed, the report should use medians and ranges rather than relying only on means and standard deviations.
- For Wilcoxon, the calculated value usually needs to be equal to or smaller than the critical value. Since 5<85 < 85<8, the result is significant at p<0.05p < 0.05p<0.05.
- The results section should state the statistical decision, but the deeper explanation of what it means belongs in the discussion.
Discussion
The discussion interprets the results. It explains whether the hypothesis was supported, links findings back to previous research, and considers the wider meaning.
This is also where you evaluate the study. You might discuss validity, reliability, sampling bias, ethics, demand characteristics, researcher bias, usefulness, and possible improvements.
You should also show awareness of statistical errors. A Type I error is a false positive: rejecting the null hypothesis when it is actually true. A Type II error is a false negative: failing to reject the null hypothesis when it is actually false.
References
The references section lists every source cited in the report. It allows readers to check where ideas came from and helps avoid plagiarism.
Appendices
Appendices contain supporting material that would interrupt the main report if included in full. This might include raw data, consent forms, standardised instructions, questionnaires, calculations, debrief sheets or extra tables.
Placing information in the correct section
A student writes up a practical based on leading questions and memory, inspired by Loftus and Palmer (1974).
- The sentence “Loftus and Palmer (1974) found that wording affected speed estimates” belongs in the introduction because it gives background research.
- The sentence “Twenty opportunity-sampled students watched a short film clip” belongs in the sample part of the method because it describes who took part.
- The sentence “The mean estimate was higher in the ‘smashed’ condition” belongs in the results because it reports a finding.
- The sentence “This suggests leading questions can distort eyewitness testimony” belongs in the discussion because it interprets the finding.
Harvard referencing
Harvard referencing is an author-date system. In the main text, you cite the author surname and year. At the end, you give the full reference.
For example:
- In-text citation: Milgram (1963) investigated obedience to authority.
- Parenthetical citation: Obedience may be affected by authority figures (Milgram, 1963).
- Reference list entry: Milgram, S. (1963) Behavioral study of obedience. Journal of Abnormal and Social Psychology, 67, (4), 371–378.
Building a Harvard reference
You are given: author Stanley Milgram, year 1963, article title “Behavioral study of obedience”, journal Journal of Abnormal and Social Psychology, volume 67, issue 4, pages 371–378.
- Start with surname and initial: Milgram, S.
- Put the year in brackets: (1963).
- Add the article title, then the journal title in italics.
- Finish with volume, issue and page range: 67, (4), 371–378.
Peer review
Peer review is the process where other experts in psychology check a piece of research before publication. Reviewers examine whether the aims are clear, the method is valid, the statistics are appropriate, the conclusions are justified, and ethical issues have been considered.
Peer review helps the psychological community validate new knowledge and maintain integrity. It can reduce errors, exaggeration and weak reasoning.
However, it is not perfect. Reviewers may miss fraud or mistakes, popular theories may be favoured, and publication bias can mean significant findings are more likely to be published than non-significant findings.
AO1, AO2 and AO3
For report writing, AO1 is knowing the sections and their purposes, AO2 is applying them to a scenario or practical write-up, and AO3 is explaining why good reporting, referencing and peer review improve scientific quality.
In the exam
- If asked where information belongs, match it to the section’s purpose: background, method, evidence, interpretation, source list or supporting material.
- For method questions, always think in four parts: design, sample, materials/apparatus and procedure.
- For results, mention descriptive statistics, graphs and inferential tests where relevant, including significance levels and critical values.
- For Harvard referencing, remember the core pattern: author, year, title, source, volume/issue and pages.
- For peer review, give a balanced answer: it improves quality and integrity, but it does not guarantee that research is true.
Check yourself
- What is the difference between an abstract and an introduction?
- Which method subsection would include standardised instructions and consent forms?
- Why does peer review improve psychology, and why is it still not perfect?

