What you'll learn
- How to record raw data clearly and accurately before analysis.
- How to choose suitable descriptive statistics and graphs.
- How to choose between parametric and non-parametric inferential tests.
- How data quality links to AO3 issues such as validity, reliability, bias and ethics.
The big picture: from data to evidence
In research methods, data means the information collected in a study. In OCR H567, you need to describe the procedures, apply them to unfamiliar scenarios, and evaluate what the data can really show.
A good answer usually moves through three stages:
- Record the raw data carefully.
- Summarise and present the pattern using descriptive statistics and graphs.
- Infer whether the pattern is likely to be meaningful using inferential statistics.
Data analysis in one sentence
Your job is to turn messy observations into a clear summary, then judge how confidently the findings can be generalised beyond the sample.
Recording raw data
Raw data are the original scores, categories or observations collected before any averaging, rounding or statistical testing.
A raw data recording table should make it easy to see exactly what was collected. It usually includes:
| Participant ID | Condition or group | Dependent variable score/category | Notes or coding key |
|---|---|---|---|
| P01 | Verb condition A | Speed estimate | No name recorded |
| P02 | Verb condition B | Speed estimate | No name recorded |
The independent variable is the factor manipulated or compared. The dependent variable is what is measured. For example, in Loftus and Palmer (1974), the verb in the question was the independent variable, and the speed estimate was the dependent variable.
Good raw data tables should:
- use anonymised participant codes, not names
- show each participant’s original result, not just the mean
- state clear category codes, such as O for obeyed and D for disobeyed
- avoid unnecessary rounding until final answers
- allow totals, tallies or means to be checked later
A tally chart is a simple frequency table where each observation is counted using marks. This is useful for nominal data, such as the number of participants in Bocchiaro et al. (2012) who obeyed, disobeyed or whistleblew.
Standard form, decimal form and significant figures
Decimal form is the ordinary way of writing numbers, such as 0.0047. Standard form writes very large or very small numbers as a×10na \times 10^na×10n, where 1≤a<101 \le a < 101≤a<10. Significant figures are the meaningful digits in a number.
You may also need to estimate from collected data, especially from a graph. Use ~ to mean approximately, and avoid pretending an estimate is more precise than the graph allows.
Converting and rounding a result
-
A statistical result is reported as p=4.7×10⁻³p = 4.7 \times 10^{-3}p=4.7×10⁻³. The exponent
-3means move the decimal point three places left, so the decimal form is 0.0047. -
If a mean score is 12.568 and you are asked for 3 significant figures, keep 1, 2 and 5. The next digit is 6, so round up to 12.6.
-
If a graph bar is halfway between 20 and 30, estimate the value as
~25, not as an over-precise value such as 24.83.
Levels and types of data
Quantitative data are numerical data, such as a recall score or number of aggressive acts. Qualitative data are non-numerical data, such as interview responses or descriptions of behaviour.
Primary data are collected first-hand by the researcher. Secondary data already exist, such as official statistics, previous research papers or archived records.
Levels of measurement
| Level | Meaning | Component 02 anchor | Usually suitable for |
|---|---|---|---|
| Nominal | Categories with no order | Obeyed or disobeyed in Milgram (1963) | Mode, percentages, Chi-square |
| Ordinal | Ordered ranks or ratings, but gaps may not be equal | A ranked confidence rating | Median, range, Spearman’s Rho |
| Interval | Numerical scale with equal intervals | Speed estimates in Loftus and Palmer (1974) | Mean, standard deviation, parametric tests if assumptions are met |
Treating every number as interval data
A 1–5 rating scale uses numbers, but it is often ordinal because the psychological gap between 1 and 2 may not equal the gap between 4 and 5.
Classifying data from studies
-
In Bocchiaro et al. (2012), participants were classified as obedient, disobedient or whistleblowers. These are categories with no natural order, so the data are nominal.
-
If participants rank how anxious they feel from 1 to 10, the scores are ordered but the gaps are not guaranteed equal, so this is ordinal.
-
In Loftus and Palmer (1974), speed estimates are numerical with equal intervals, so they can usually be treated as interval data.
Descriptive statistics
Descriptive statistics summarise the data you collected. They do not prove whether a result is significant; they describe the pattern.
Measures of central tendency
A measure of central tendency tells you the typical or average value.
| Statistic | What it means | Best used when |
|---|---|---|
| Mode | Most frequent value/category | Nominal data or repeated scores |
| Median | Middle value when ordered | Ordinal or skewed data |
| Mean | Arithmetic average | Interval data without extreme outliers |
Measures of dispersion
A measure of dispersion tells you how spread out the data are.
| Statistic | What it means |
|---|---|
| Range | Highest score minus lowest score |
| Variance | Average squared spread around the mean |
| Standard deviation | Typical spread around the mean, in the original scale |
For one common descriptive formula, variance is:
s2=∑(x−xˉ)2ns^2 = \frac{\sum (x-\bar{x})^2}{n}s2=n∑(x−xˉ)2
Standard deviation is the square root of variance:
s=s2s = \sqrt{s^2}s=s2
Some sample formulas divide by n−1n-1n−1 instead, so follow the formula or instruction given in the question.
Calculating descriptive statistics
Scores from five participants are: 30, 32, 35, 35, 43.
-
Calculate the mean: xˉ=30+32+35+35+435=35\bar{x} = \frac{30+32+35+35+43}{5}=35xˉ=530+32+35+35+43=35.
-
Find the median and mode. The middle score is 35, and the most frequent score is also 35.
-
Calculate the range: 43 minus 30 gives 13.
-
For variance, compare each score with the mean: deviations are -5, -3, 0, 0 and 8. Squared deviations are 25, 9, 0, 0 and 64.
-
Calculate variance and standard deviation: s2=985=19.6s^2=\frac{98}{5}=19.6s2=598=19.6, so s=19.6≈4.43s=\sqrt{19.6}\approx 4.43s=19.6≈4.43.
Ratios, fractions and percentages
A fraction shows a part of a whole. A percentage converts that fraction to “out of 100”. A ratio compares two quantities directly.
Converting Milgram’s obedience result
In Milgram (1963), 26 out of 40 participants went to the maximum voltage.
-
Write the fraction: 2640=1320\frac{26}{40}=\frac{13}{20}4026=2013.
-
Convert to a percentage: 2640×100=65%\frac{26}{40} \times 100 = 65\%4026×100=65%.
-
Compare obedient to non-obedient participants. The ratio is 26:14, which simplifies to 13:7.
Presenting data
Different graphs suit different data.
| Presentation method | Use for | Key feature |
|---|---|---|
| Frequency table | Counts in categories | Shows raw frequencies clearly |
| Bar chart | Nominal or discrete categories | Bars are separate |
| Histogram | Continuous interval data | Bars touch because the scale is continuous |
| Line graph | Change over ordered time or conditions | Points joined to show trend |
| Pie chart | Proportions of a whole | Slices add to 100% |
| Scatter diagram | Relationship between two co-variables | Each point is one participant or case |
A scatter diagram is especially useful for correlations, such as studying whether sleep is associated with memory performance. It does not prove cause and effect.
Choosing a graph
-
If you are presenting the number of participants who obeyed, disobeyed and whistleblew in Bocchiaro et al. (2012), use a bar chart or pie chart because the data are nominal categories.
-
If you are showing mean aggression scores for different model conditions in Bandura et al. (1961), use a bar chart because the conditions are separate groups.
-
If you are plotting hours of revision against recall score for each participant, use a scatter diagram because you are looking for an association between two variables.
Inferential statistics
Inferential statistics help you decide whether a pattern in the sample is likely to reflect a real effect or relationship in the wider population.
A null hypothesis says there is no real difference or relationship. A p value is the probability of getting the observed result, or a more extreme result, if the null hypothesis is true.
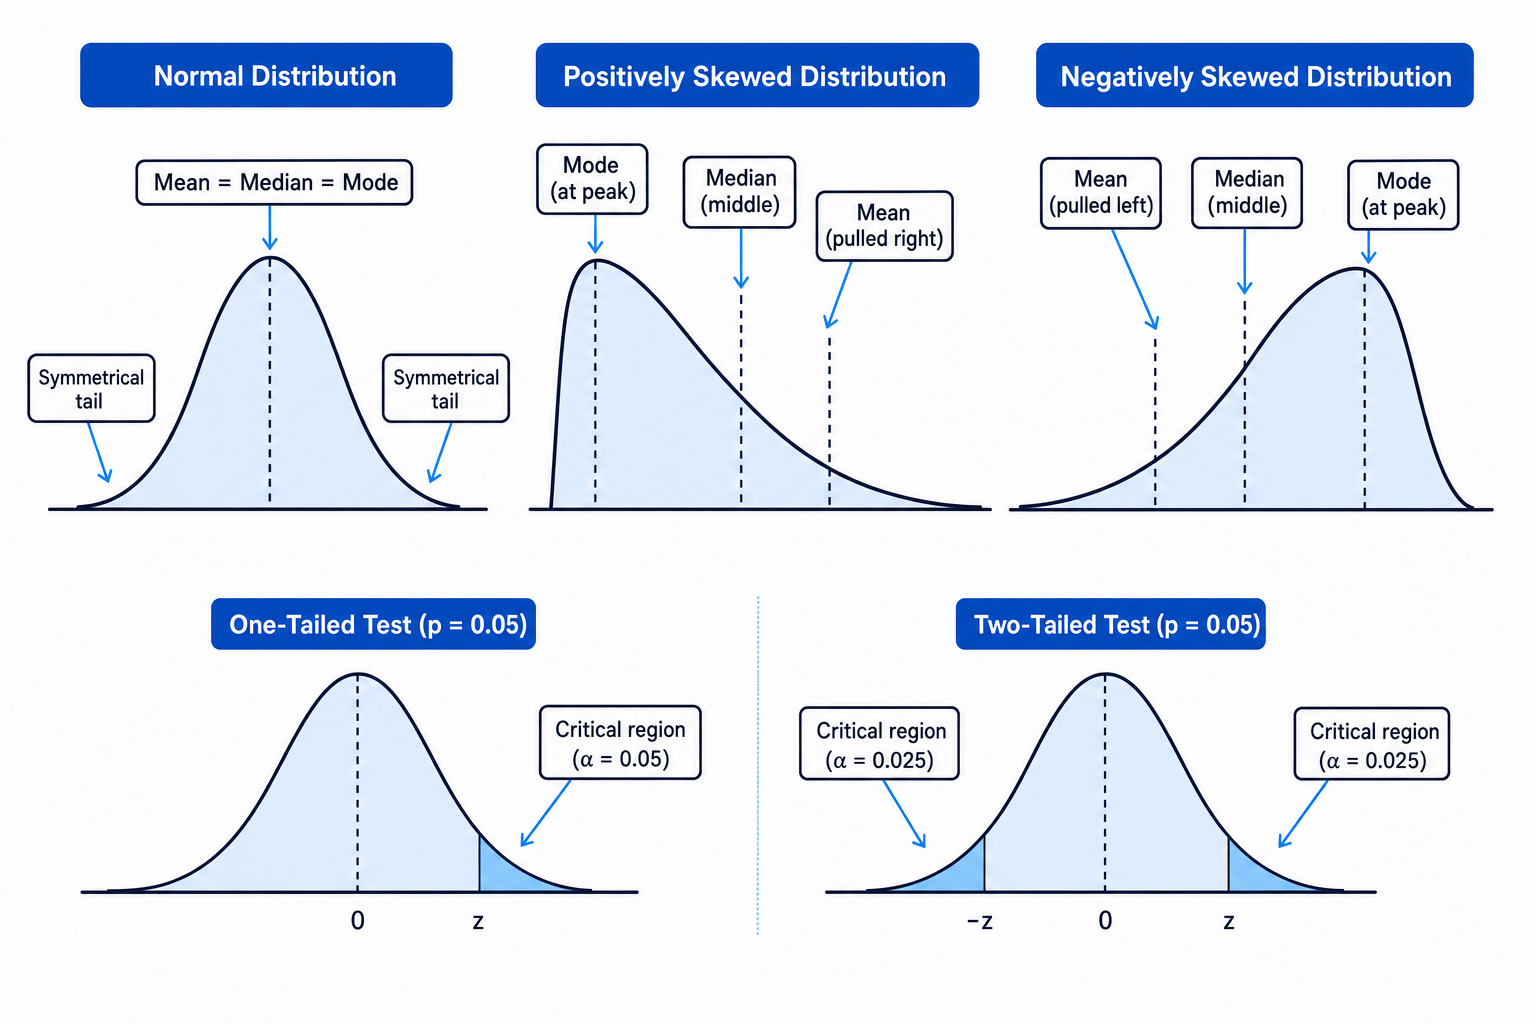
A normal distribution is symmetrical, with the mean, median and mode in the same place. A skewed distribution has a long tail at one end, which can make the mean less representative.
Significance level
A significance level is the cut-off for deciding whether a result is statistically significant. In psychology, p≤0.05p \le 0.05p≤0.05 is common, meaning a 5% risk of finding significance by chance.
Statistical tables and critical values
A critical value is the cut-off value found in a statistical table. To use a table, you usually need:
- the test being used
- the sample size or degrees of freedom
- the significance level, such as 0.05
- whether the hypothesis is one-tailed or two-tailed
For some tests, the calculated value must be less than or equal to the critical value. For others, it must be greater than or equal to the critical value. Always read the table heading.
Parametric and non-parametric tests
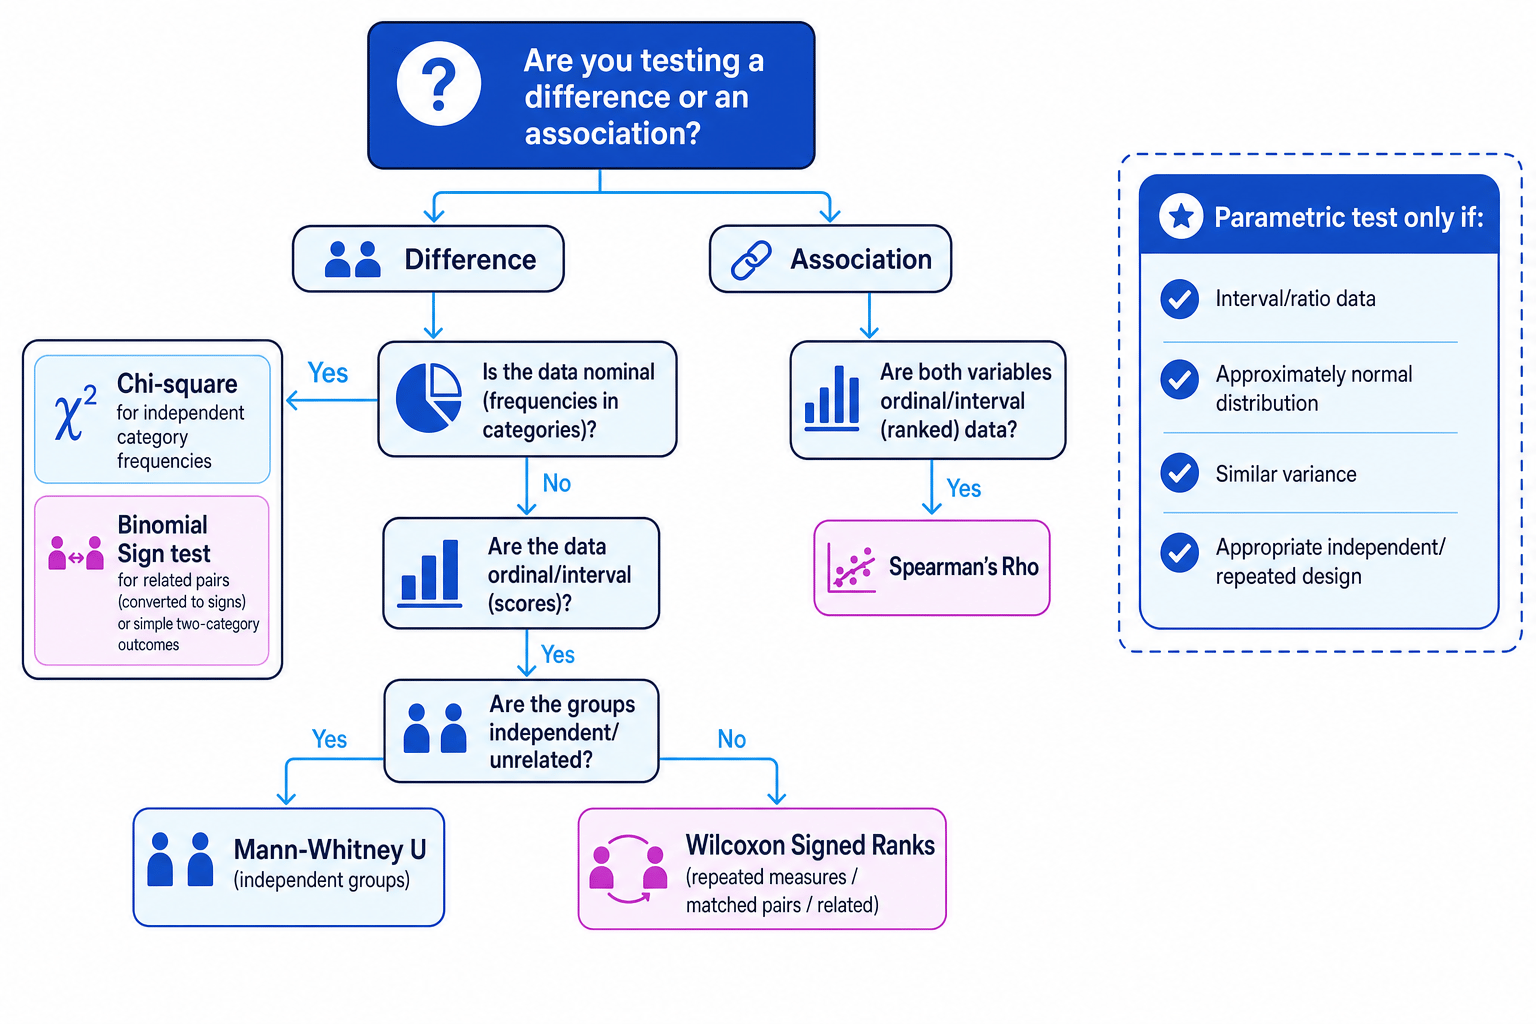
A parametric test is used when stricter assumptions are met: interval or ratio data, approximately normal distribution, similar variance between conditions, and a suitable design.
A non-parametric test makes fewer assumptions and is often used for nominal or ordinal data, skewed data, small samples, or when parametric assumptions are not met.
| Test | Use when | Example application |
|---|---|---|
| Mann-Whitney U | Difference between two independent groups; ordinal or interval data | Comparing aggression scores for two separate groups |
| Wilcoxon Signed Ranks | Difference between two related conditions or matched pairs; ordinal or interval data | Same participants tested before and after an intervention |
| Chi-square | Association or difference using nominal frequency data | Comparing observed category frequencies with expected frequencies |
| Binomial Sign test | Related pairs or two-category outcomes converted to plus/minus signs | Counting how many participants improve rather than worsen |
| Spearman’s Rho | Correlation between two co-variables measured at least ordinally | Relationship between confidence rank and accuracy rank |
Choosing and interpreting a test
A researcher measures the same participants’ anxiety scores before and after a relaxation task. The Wilcoxon calculated value is T=10T=10T=10. The table gives a critical value of 13 at the 0.05 level.
-
The same participants are measured twice, so the design is related. The data are scores that can be ranked, so Wilcoxon Signed Ranks is appropriate.
-
For Wilcoxon, the calculated value must be less than or equal to the critical value: T≤TcritT \le T_{\text{crit}}T≤Tcrit. Here, 10<1310 < 1310<13.
-
The result is significant at the 0.05 level, so the researcher rejects the null hypothesis and accepts that there is evidence of a difference.
Type I and Type II errors
A Type I error is a false positive: rejecting the null hypothesis when it is actually true. This is more likely if the significance level is too lenient.
A Type II error is a false negative: failing to reject the null hypothesis when there really is an effect. This is more likely with very small samples or an overly strict significance level.
Useful symbols
=means equal to.<means less than, as in p<0.05p < 0.05p<0.05.>means greater than.<<means much less than.>>means much greater than.∞means infinity.~means approximately, useful when estimating from graphs.
Methodological issues in data quality
Representativeness and generalisability
Representativeness asks whether the sample reflects the target population. Generalisability asks whether the findings can be applied beyond the study.
For example, Milgram’s (1963) sample of 40 men limits population validity, while Sperry’s (1968) split-brain sample was very small and unusual. This does not make the studies worthless, but it limits how widely conclusions should be applied.
Reliability
Reliability means consistency.
- Internal reliability: consistency within a measure.
- External reliability: consistency across occasions.
- Inter-rater reliability: agreement between observers, important in observational research such as Bandura et al. (1961).
- Test-retest reliability: same test gives similar results over time.
- Split-half reliability: two halves of a questionnaire or test give similar results.
Validity
Validity means whether the study measures what it claims to measure.
- Internal validity: the IV really caused the DV change.
- Face validity: the measure appears sensible on the surface.
- Construct validity: the measure captures the psychological concept.
- Concurrent validity: the measure agrees with an established measure taken at the same time.
- Criterion validity: the measure relates to an external criterion or outcome.
- External validity: findings apply beyond the study.
- Population validity: findings apply to other groups of people.
- Ecological validity: findings apply to real-world settings and tasks.
Bias and participant effects
Demand characteristics occur when participants guess the aim and change behaviour. Social desirability occurs when participants act or answer in a way that makes them look good.
Researcher or observer bias occurs when expectations influence recording or interpretation. Researcher or observer effects occur when the researcher’s presence or behaviour changes participants’ responses.
Ethics and the BPS Code
The British Psychological Society Code of Ethics and Conduct includes:
- Respect: informed consent, right to withdraw, confidentiality.
- Competence: researchers must have appropriate skills.
- Responsibility: protection of participants and debriefing.
- Integrity: honesty, including justified use of deception.
Ethics links directly to data. For example, deception in Milgram (1963) may have improved internal validity by reducing demand characteristics, but it raised serious concerns about stress, right to withdraw and debriefing. In raw data tables, confidentiality is protected by using participant codes rather than names.
In the exam
-
For AO1, define the term precisely: say what the statistic, graph or test is used for.
-
For AO2, apply it to the scenario: mention the design, data level, whether groups are related or unrelated, and whether the study is testing a difference or association.
-
For AO3, explain the consequence: how reliability, validity, bias, representativeness or ethics affects confidence in the findings.
Check yourself
- A study compares anxiety ranks before and after therapy in the same participants. Which inferential test should be used, and why?
- What graph would you choose for a correlation between sleep score and memory score?
- If a result is reported as p=0.07p = 0.07p=0.07 with a 0.05 significance level, what decision should the researcher make?
