What you'll learn
- How to plan and conduct four small-scale practicals: self-report, observation, experiment and correlation.
- How to use ethics, risk assessment and a research portfolio properly.
- How to choose descriptive statistics, graphs and inferential tests for your data.
- How to write about practicals using AO1 description, AO2 application and AO3 evaluation.
Why practical activities matter
In OCR H567, practical activities help you understand research methods by actually doing psychology. You are not just memorising terms: you are making design choices, collecting data, analysing results and evaluating what went well.
Practical activity
A practical activity is a small-scale piece of research that you plan, conduct, analyse and evaluate. It should be manageable, ethical and clearly linked to a research question.
You should keep evidence in a research portfolio: aims, hypotheses, materials, consent forms, raw data, graphs, statistical decisions, conclusions and evaluation. ICT is useful here: spreadsheets for data, graphing tools for charts, and word processing for write-ups.
You also need a risk assessment, which identifies possible risks and explains how you will manage them. In psychology, risks are often emotional, social or ethical: embarrassment, distress, lack of privacy, pressure to take part, or accidental disclosure of personal data.
Think like a researcher
Every practical should move from aim → hypothesis → method → data → analysis → conclusion → evaluation. The better your planning, the easier your AO3 evaluation becomes.
Planning any practical
Aims, hypotheses and variables
An aim is the general purpose of the study. A hypothesis is a testable prediction. A null hypothesis predicts no effect, no difference or no relationship.
To operationalise a variable means defining exactly how it will be measured or manipulated. For example, “memory” is vague; “number of words correctly recalled from a 20-word list after two minutes” is operationalised.
In an experiment, the independent variable is manipulated and the dependent variable is measured. In a correlation, you do not manipulate variables; you measure two co-variables and see whether they are related.
Operationalising a practical aim
- Start with a vague aim: “Does music affect memory?”
- Turn the independent variable into clear conditions: “silence” and “pop music played during learning.”
- Turn the dependent variable into a measurable score: “number of words correctly recalled from a 20-word list.”
- Write a directional hypothesis: “Participants who learn in silence will recall more words than participants who learn with pop music.”
- Write the null hypothesis: “There will be no difference in word recall between the silence and pop music conditions.”
Ethics and the BPS Code
Your practicals should follow the BPS Code of Human Research Ethics. Key issues include informed consent, right to withdraw, confidentiality, privacy, protection from harm, deception and debriefing.
Core studies show why this matters. Milgram (1963) used deception and exposed participants to stress, so it is useful for evaluating ethics. Bocchiaro et al. (2012) also used deception in a study of disobedience and whistleblowing, but with modern ethical safeguards such as debriefing and approval procedures.
Forgetting protection from harm
Students often mention consent and debriefing, but forget protection from harm. Always ask: could participants feel anxious, embarrassed, judged or pressured?
Practical 1: Self-report
A self-report gathers data by asking participants about their thoughts, feelings or behaviour. The main types are questionnaires and interviews.
Questionnaires can use closed questions, such as yes/no answers or rating scales, which are easy to quantify. They can also use open questions, where participants explain in their own words, giving richer qualitative data.
Loftus and Palmer (1974) is a good anchor study. Participants watched film clips of car accidents and answered questions about speed. The wording of the question, such as “smashed” rather than “hit”, affected estimates. This shows a major self-report issue: responses can be influenced by leading questions.
Good self-report practicals use standardised instructions, neutral wording, anonymity and pilot testing. Weaknesses include social desirability bias, demand characteristics and inaccurate memory.
Writing questionnaire items
Avoid double-barrelled questions such as “Do you feel confident and relaxed in exams?” Confidence and relaxation are not the same thing, so they should be measured separately.
Practical 2: Observation
An observation records behaviour as it happens. It can be naturalistic in a real-world setting, or controlled in a structured environment. It can also be overt, where participants know they are being observed, or covert, where they do not.
To make observation scientific, you need behavioural categories: clear, observable behaviours that can be recorded reliably. You may use event sampling, where you count each time a behaviour occurs, or time sampling, where you record behaviour at set intervals.
Bandura, Ross and Ross (1961) used observation to measure children’s aggressive behaviour after exposure to an aggressive model. Piliavin et al. (1969) used a field setting on the New York subway to observe helping behaviour. These studies show the trade-off between control and ecological validity.
Designing behavioural categories
- Begin with a broad target, such as “aggression,” then reject it as too vague because observers may interpret it differently.
- Split it into observable categories, such as “hits doll,” “kicks doll,” “throws object” and “verbal insult.”
- Decide how to record the behaviour: event sampling is suitable if you want a frequency count of each aggressive act.
- Improve reliability by using two observers and comparing whether they record the same behaviours in the same categories.
AO3 points for observations include observer bias, inter-rater reliability, ethical issues around privacy, and whether the setting is realistic.
Practical 3: Experiment
An experiment investigates cause and effect by manipulating an independent variable and measuring its effect on a dependent variable while controlling other factors.
Common experimental designs are:
- Independent groups: different participants in each condition.
- Repeated measures: the same participants complete every condition.
- Matched pairs: participants are paired on relevant characteristics, then split between conditions.
Milgram (1963), Loftus and Palmer (1974) and Bandura et al. (1961) are all useful when discussing experimental control. Sperry (1968) is useful for thinking about quasi-experiments, because the split-brain condition was naturally occurring rather than manipulated by the researcher.
Choosing an experimental design
- If you use independent groups for a memory experiment, each participant only does one condition, so order effects are reduced.
- If you use repeated measures, each participant does both conditions, so individual differences in memory ability are controlled.
- If repeated measures are used, you must manage order effects by counterbalancing the order of conditions.
- If participants might guess the aim after doing both conditions, independent groups may be more appropriate despite individual differences.
Experiments are strong for control and replication, supporting psychology as a science. However, artificial tasks can reduce ecological validity, and highly controlled settings may encourage demand characteristics.
Practical 4: Correlation
A correlation investigates whether two co-variables are related. It does not manipulate an independent variable, so it cannot prove cause and effect.
A positive correlation means both variables tend to increase together. A negative correlation means one variable tends to increase as the other decreases. A zero correlation means there is no clear relationship.
A scatter diagram is the standard graph for correlation. Each point represents one participant’s score on both co-variables.
Core-study links include Maguire et al. (2000), where taxi drivers’ brain structure was related to navigational experience. This is useful for discussing correlation and causation: even if two variables are related, other explanations may exist.
Correlation does not mean causation
If revision time and test score are positively correlated, you cannot automatically say revision caused the higher score. Motivation, prior ability or teaching quality could also be involved.
Analysing your practical data
Levels of measurement
The level of measurement affects what statistics you can use.
| Level | What it means | Practical example |
|---|---|---|
| Nominal | Categories or names | “Helped” or “did not help” |
| Ordinal | Ordered or ranked data | Stress rating from low to high |
| Interval | Equal intervals between scores | A standardised test score |
You may also report ratios, fractions and percentages. For example, 12 out of 20 is a fraction, 3:2 is a ratio, and a percentage converts a part into “out of 100”:
percentage=partwhole×100\text{percentage} = \frac{\text{part}}{\text{whole}} \times 100percentage=wholepart×100Descriptive statistics
Descriptive statistics summarise your data.
For averages, use:
- Mode: most common score.
- Median: middle score when ordered.
- Mean: total divided by number of scores.
For spread, use:
- Range: highest score minus lowest score.
- Variance: average squared distance from the mean.
- Standard deviation: typical spread of scores around the mean.
A sample standard deviation can be shown as:
s=∑(x−xˉ)2n−1s = \sqrt{\frac{\sum (x - \bar{x})^2}{n - 1}}s=n−1∑(x−xˉ)2Calculating descriptive statistics
- For recall scores 6, 8, 8, 10 and 13, add the scores: 6 + 8 + 8 + 10 + 13 = 45.
- Divide by the number of scores: xˉ=455=9\bar{x} = \frac{45}{5} = 9xˉ=545=9, so the mean is 9.
- Find the range by comparing the highest and lowest scores: 13 minus 6 gives a range of 7.
- If 18 out of 30 participants helped, calculate 1830×100=60\frac{18}{30} \times 100 = 603018×100=60, so 60% helped.
Graphs
Choose graphs based on your data:
- Bar chart: separate categories, often nominal data.
- Histogram: continuous or grouped interval data; bars touch.
- Line graph: change across ordered conditions or time.
- Pie chart: proportions of a whole.
- Scatter diagram: relationship between two co-variables.
Bar chart versus histogram
Use a bar chart for separate categories such as “male” and “female.” Use a histogram for continuous grouped scores, such as ranges of test scores.
Inferential statistics
Inferential statistics help decide whether a pattern is likely to be meaningful or could have occurred by chance.
A significance level is the probability threshold for deciding whether to reject the null hypothesis. In psychology, p<0.05p < 0.05p<0.05 is common, meaning there is less than a 5% probability of obtaining the result, or a more extreme result, if the null hypothesis is true.
You also need to decide whether your test is one-tailed or two-tailed. A one-tailed test is used for a directional hypothesis. A two-tailed test is used for a non-directional hypothesis.
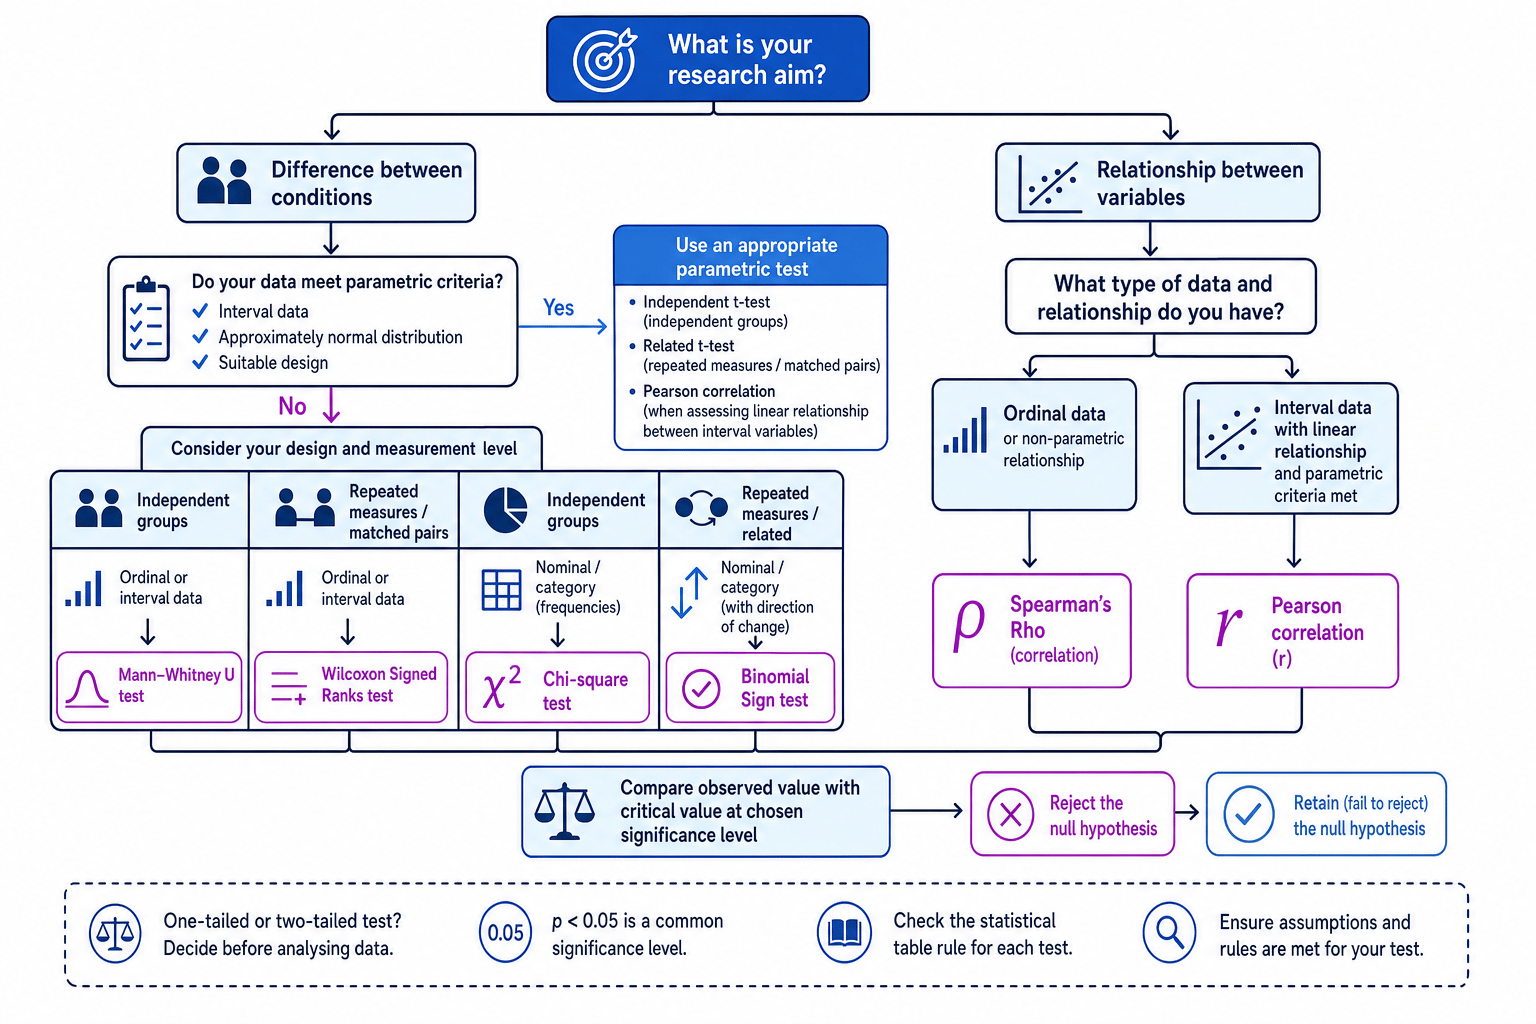
Choosing a statistical test
For a parametric test, you normally need interval data, an approximately normal distribution, and suitable assumptions such as independent observations. Pearson’s correlation also requires a linear relationship.
For the named non-parametric tests:
| Test | Use when… |
|---|---|
| Mann-Whitney U | Testing a difference between two independent groups with ordinal data, or interval data that does not meet parametric criteria |
| Wilcoxon Signed Ranks | Testing a difference between two related conditions, repeated measures or matched pairs |
| Chi-square | Testing association or difference using nominal frequency data |
| Binomial Sign test | Testing change or difference in related nominal data, using direction of change |
| Spearman’s Rho | Testing a correlation with ordinal data, ranked data, or non-parametric interval data |
Choosing an inferential test
- A researcher wants to know whether people who revise with music score differently from people who revise in silence, so the aim is to test a difference, not a relationship.
- The two conditions contain different participants, so the design is independent groups.
- The outcome is a ranked confidence score, so the data are ordinal rather than clearly interval.
- The correct non-parametric test is Mann-Whitney U, and the obtained value should be compared with the critical value in the appropriate statistical table.
Critical values and errors
A statistical table gives a critical value for your test. You check the sample size, significance level and whether the hypothesis is one-tailed or two-tailed. Some tests are significant when the observed value is less than or equal to the critical value; others are significant when it is greater than or equal to the critical value, so always check the table rule.
A Type I error is a false positive: rejecting the null hypothesis when it is actually true. A Type II error is a false negative: retaining the null hypothesis when there really is an effect.
Useful symbols include = for equal to, < for less than, > for greater than, << for much less than, >> for much greater than, ∞ for infinity, and ~ for approximately. Use them carefully and only where they make your meaning clearer.
Writing it up for AO1, AO2 and AO3
For AO1, describe the method clearly: design, sample, materials, procedure, controls, ethics and analysis.
For AO2, apply research-method terms to a new scenario. If a question gives you a practical about stress, for example, identify whether it is a self-report, observation, experiment or correlation, then justify the design and analysis.
For AO3, evaluate. Consider validity, reliability, sampling bias, ethnocentrism, ethics, usefulness, reductionism, determinism and whether the study supports psychology as a science.
In the exam
- Identify the practical type first: self-report, observation, experiment or correlation.
- Link your analysis choice to three things: aim, design and level of measurement.
- In evaluation, make the point specific: say exactly how ethics, validity, reliability or sampling affects the study’s conclusions.
Check yourself
- Which practical method would you use to investigate whether two variables are related?
- How would you decide between Mann-Whitney U and Wilcoxon Signed Ranks?
- What ethical risks might appear in a self-report study about stress or mental health?

