What you'll learn
- How psychologists use scientific enquiry to study behaviour.
- Why ideas such as falsification, replicability, objectivity and hypothesis testing matter.
- How variables, controls and standardisation help researchers investigate cause-and-effect.
- How quantitative evidence, graphs and statistical tests support AO1, AO2 and AO3 answers.
Why psychology counts as a science
Psychology studies behaviour and mental processes, but it does not rely only on opinion or common sense. It aims to collect evidence in a careful, systematic way so that claims can be checked, challenged and improved.
Scientific enquiry
Scientific enquiry means using systematic, evidence-based methods to ask questions, collect data, test explanations and decide whether findings support or challenge a theory.
This matters beyond the classroom. Psychological research helps society make decisions about issues such as eyewitness testimony, education, health, workplace behaviour, transport safety and mental health support. It also contributes to the economy by improving interventions, reducing harm, supporting productivity and informing public policy.
For example, Loftus and Palmer (1974) showed that leading questions can affect eyewitness memory, which has implications for police interviewing. Milgram (1963) and Bocchiaro et al. (2012) help us understand obedience, disobedience and whistleblowing in organisations.
The scientific enquiry cycle
A good scientific investigation usually moves from observation, to theory, to prediction, to testing, to revision. The process is not a straight line: researchers often return to earlier stages when evidence challenges an explanation.
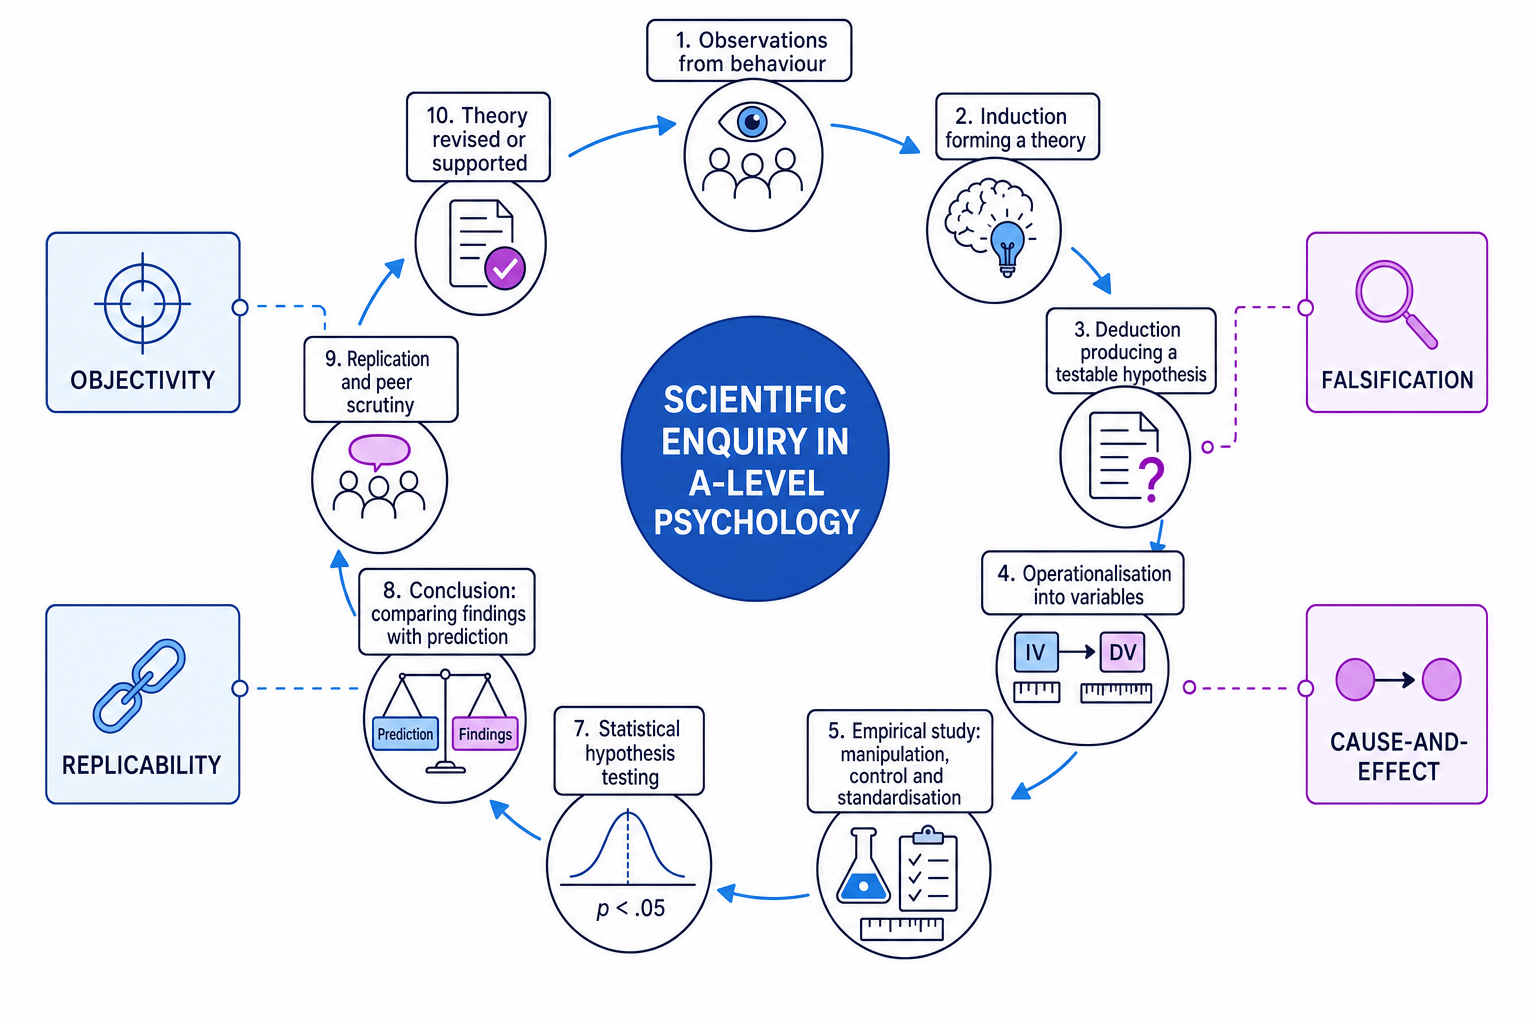
Induction, deduction and theories
Induction and deduction
Induction means building a general explanation from specific observations. Deduction means using a theory to make a specific, testable prediction.
In psychology, a theory is an organised explanation of behaviour. A theory is useful only if it leads to predictions that can be tested with evidence.
For example, researchers might observe that children copy adult behaviour. Through induction, they might form the theory that aggression can be learned by observation. Through deduction, they could predict that children who see an aggressive adult model will later show more aggressive behaviour. This links neatly to Bandura, Ross and Ross (1961).
Turning observations into a testable hypothesis
- Start with observations: children sometimes copy adult actions, especially when the adult appears powerful or rewarded.
- Use induction to form a theory: aggressive behaviour may be learned through observation and imitation.
- Use deduction to make a prediction: children exposed to an aggressive adult model will show more aggression than children not exposed to that model.
- Operationalise the prediction: “aggression” could be measured by the number of physical and verbal aggressive acts towards a Bobo doll.
Hypotheses and falsification
Hypothesis
A hypothesis is a clear, testable prediction about what the researcher expects to find.
In research methods, you often see two types:
- An alternative hypothesis predicts that there will be an effect, difference or relationship.
- A null hypothesis predicts that there will be no effect, difference or relationship.
Falsification
Falsification means a scientific claim must be testable in a way that could prove it wrong.
This is crucial. A claim such as “obedience is caused by invisible forces that can never be measured” is not scientific because no evidence could disprove it. A claim such as “participants ordered by an authority figure will administer higher shocks than participants not ordered by an authority figure” can be tested.
Why falsification matters
Scientific psychology does not try to “prove forever”. It tests claims and accepts that future evidence may challenge them.
Cause-and-effect: variables and manipulation
Cause-and-effect
A cause-and-effect relationship means changes in one factor produce changes in another factor.
To study cause-and-effect, psychologists often use experiments.
Variables
An independent variable, or IV, is the factor the researcher manipulates. A dependent variable, or DV, is the factor the researcher measures.
In Loftus and Palmer (1974), the IV was the wording of the critical question, such as “hit”, “smashed” or “contacted”. The DV was the estimated speed. Because the wording was manipulated and other aspects of the procedure were controlled, the study could investigate whether leading questions affected memory.
Operationalisation
Operationalisation means defining a variable in a precise, measurable way.
“Memory accuracy” is vague. “Estimated speed in miles per hour” or “whether the participant reported seeing broken glass” is much clearer.
Identifying variables in a memory study
- Decide what the researcher changes: if participants hear different verbs in a question, the verb is the IV.
- Decide what the researcher records: if participants estimate speed, speed estimate is the DV.
- Check whether the DV is operationalised: “estimated speed” is measurable, whereas “memory changed a lot” is too vague.
- Link to cause-and-effect carefully: if groups were treated the same except for the verb, differences in estimates are more likely to be caused by wording.
Control and standardisation
Control and standardisation
Control means reducing unwanted influences on the DV. Standardisation means keeping the procedure the same for all participants.
An extraneous variable is any unwanted factor that might affect the DV. A confounding variable is an unwanted factor that changes systematically with the IV, making it difficult to know what caused the result.
For example, in Bandura et al. (1961), researchers controlled aspects such as the toys and setting so that differences in children’s aggression could be linked more confidently to exposure to the aggressive model. In Bocchiaro et al. (2012), standardised instructions helped ensure participants faced the same obedience/disobedience situation.
Control does not mean artificial is always bad
A controlled lab study may have lower ecological validity, but stronger control can improve internal validity because it becomes easier to identify cause-and-effect.
Objectivity and quantifiable measurement
Objectivity
Objectivity means researchers try to avoid personal bias by using clear procedures, measurable evidence and consistent recording.
A quantifiable measurement is evidence expressed numerically. This helps researchers compare results, calculate descriptive statistics and use inferential tests.
In Milgram (1963), obedience could be quantified by the percentage of participants who went to 450 volts. In Sperry (1968), responses in split-brain tasks could be recorded systematically, such as whether a participant named or selected an object.
Levels of measurement
- Nominal data: categories, such as obedient/disobedient.
- Ordinal data: ranked or ordered data, such as rating anxiety from 1 to 10.
- Interval data: numerical data with equal intervals, such as a test score where differences are meaningful.
Ratios, fractions and percentages are useful ways to express proportions. For example, “26 out of 40” can be written as a fraction, ratio or percentage.
Descriptive statistics
- Mode: most frequent value.
- Median: middle value when scores are ordered.
- Mean: arithmetic average.
- Range: highest score minus lowest score.
- Variance: average squared spread from the mean.
- Standard deviation: typical spread of scores around the mean.
Choosing a descriptive statistic
Use the median when data are ordinal or affected by extreme scores. Use the mean when interval data are fairly balanced and extreme scores are not distorting the average.
Standard graphs
- Bar chart: compares categories or conditions.
- Histogram: shows the distribution of continuous interval data.
- Line graph: shows change across ordered points, such as time or condition.
- Pie chart: shows proportions of a whole.
- Scatter diagram: shows the relationship between two co-variables in a correlation.
Replicability and reliability
Replicability
Replicability means a study can be repeated to see whether similar findings occur again.
Replication strengthens confidence. If only one study finds an effect, it may be due to chance, bias or a specific sample. If several well-controlled studies find similar results, the evidence is stronger.
This links to reliability, which means consistency. A procedure is more reliable when it produces stable results under consistent conditions.
However, replication can be difficult in psychology because people are affected by culture, history, demand characteristics and individual differences. For instance, obedience findings from Milgram (1963) may not transfer perfectly across time or cultures, so modern comparisons such as Bocchiaro et al. (2012) are valuable.
Statistical hypothesis testing
Once researchers collect quantitative data, they often use inferential statistics to judge whether findings are likely to be due to chance.
Probability and significance
Probability refers to how likely an outcome is. A result is usually called significant if the probability of it occurring by chance is very low, often p<.05p < .05p<.05.
A significance level of p<.05p < .05p<.05 means there is less than a 5 percent probability that the result occurred by chance, assuming the null hypothesis is true.
Researchers compare an observed value from their data with a critical value from statistical tables. The rule depends on the test: for some tests the observed value must be greater than the critical value; for others it must be smaller.
Useful symbols include = for equal to, < for less than, > for greater than, << for much less than, >> for much greater than, ∞ for infinity and ~ for approximately.
Choosing a statistical test
| Test | Use when | Design/data |
|---|---|---|
| Spearman’s Rho | Testing a correlation | Ordinal data, or interval data converted to ranks |
| Chi-square | Testing an association between categories | Nominal data, independent categories |
| Binomial Sign Test | Testing a difference | Related design, nominal data or signs of change |
| Mann-Whitney U | Testing a difference | Unrelated design, ordinal data |
| Wilcoxon Signed Ranks | Testing a difference | Related design, ordinal data |
| Parametric test | Testing difference or correlation when assumptions are met | Usually interval data, approximately normal distribution, suitable design, similar variance where relevant |
Choosing the correct inferential test
- Decide the research aim: the study compares anxiety ratings before and after therapy, so it is testing a difference, not a correlation.
- Decide the design: the same participants are measured twice, so it is a related design.
- Decide the data level: anxiety is rated on a 1 to 10 scale, so it is best treated as ordinal.
- Select the test: a difference, related design and ordinal data point to Wilcoxon Signed Ranks.
Type I and Type II errors
A Type I error is a false positive: the researcher rejects the null hypothesis even though there is no real effect.
A Type II error is a false negative: the researcher accepts the null hypothesis even though there is a real effect.
Significance is not the same as importance
A statistically significant result may be small or not very useful in real life. AO3 evaluation should consider both statistical evidence and practical usefulness.
Ethics and science
Scientific psychology must also be ethical. The BPS Code of Human Research Ethics focuses on respect, competence, responsibility and integrity. When discussing studies, consider informed consent, deception, right to withdraw, protection from harm, confidentiality and debriefing.
This is especially important for classic studies such as Milgram (1963), where participants experienced stress and were deceived. Strong scientific control does not automatically justify ethical costs.
AO1, AO2 and AO3 focus
For AO1, describe the scientific principle accurately: for example, define objectivity or explain how manipulation of variables supports cause-and-effect.
For AO2, apply the idea to a scenario or named study: identify the IV and DV in Loftus and Palmer (1974), or explain how standardisation worked in Bocchiaro et al. (2012).
For AO3, evaluate: discuss validity, reliability, sampling bias, ethics, ecological validity, ethnocentrism and whether the research is useful for society.
In the exam
- Link every method term to evidence: do not just say “controlled”; explain what was controlled and why it matters.
- For statistical questions, identify the aim, design and level of data before naming a test.
- In evaluation, balance science and ethics: strong control may improve cause-and-effect, but may reduce ecological validity or raise ethical issues.
Check yourself
- What is the difference between induction and deduction?
- Why does falsification make a theory more scientific?
- Which statistical test would you choose for a correlation using ranked data?

