What you'll learn
- How to turn a broad idea into an aim, research question and hypothesis.
- How to choose samples, experimental designs, variables and controls.
- How to design observations and self-reports that produce usable data.
- How planning links to graphs, descriptive statistics and inferential tests.
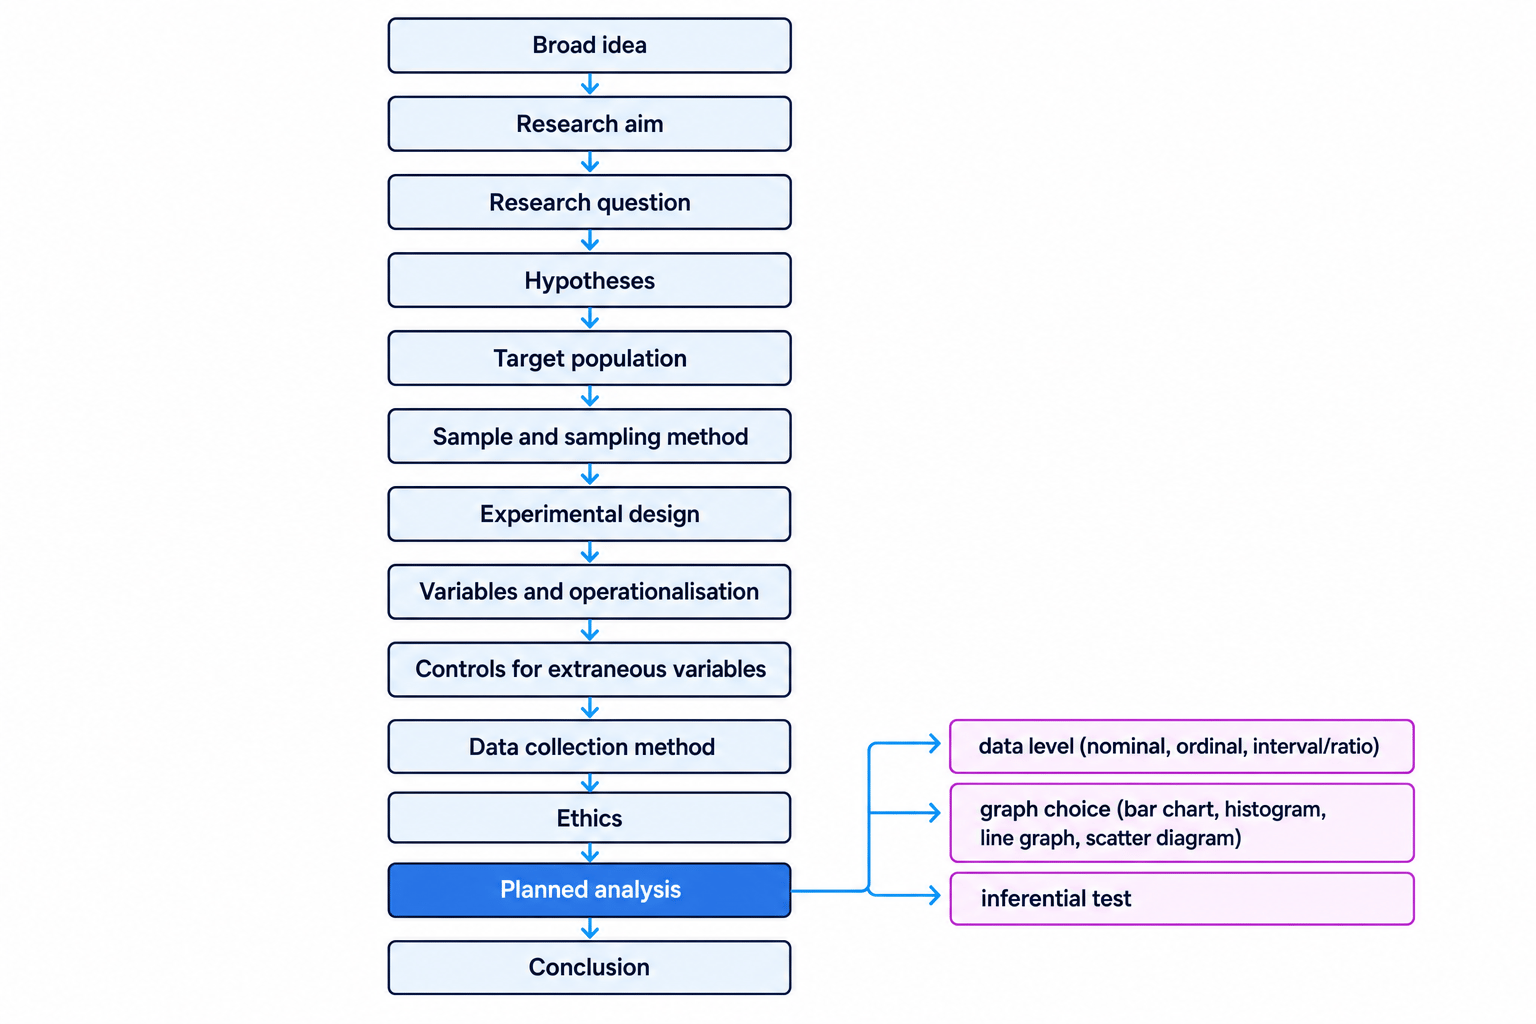
The big picture: research is a chain of decisions
A good psychology study is not just “collect some data and see what happens”. You plan the logic first: what you want to find out, who you will study, what you will measure, how you will measure it, and how you will interpret the results.
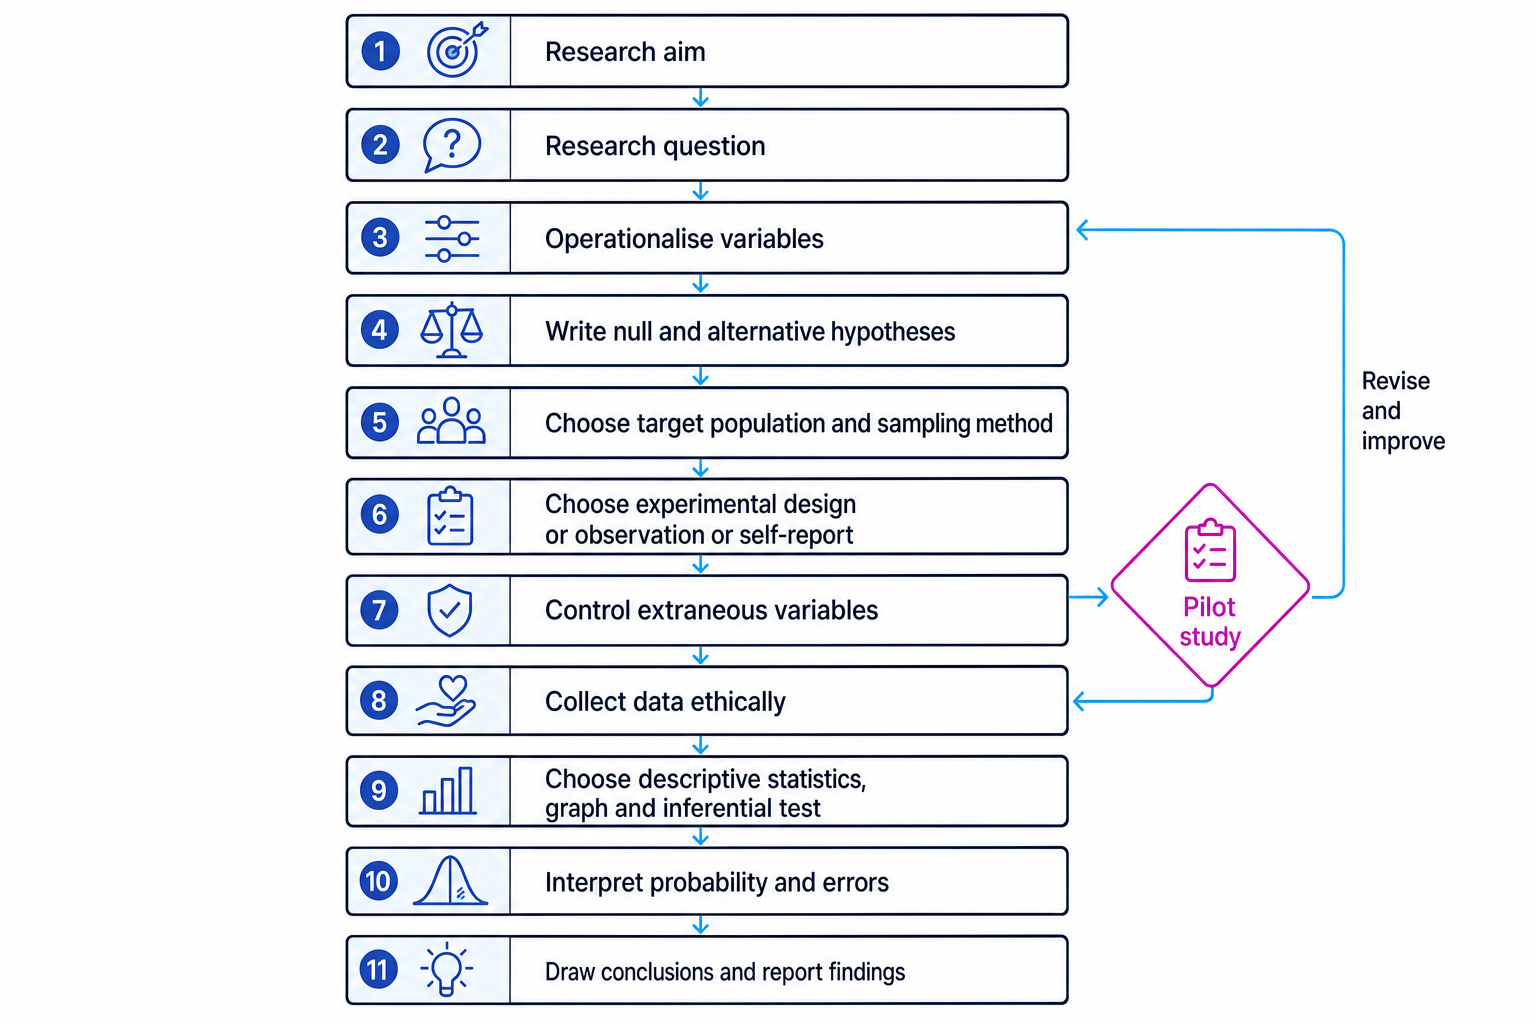
Plan backwards from the question
If you know your research question, you can choose the right variables, sample, design, controls, data collection method, graph and statistical test. Weak planning usually leads to weak validity.
Aims, research questions and hypotheses
Research aim
A research aim is a broad statement of what the researcher wants to investigate.
For example, Loftus and Palmer (1974) aimed to investigate whether leading questions could affect eyewitness memory.
Research question
A research question turns the aim into a focused question that can be answered using evidence.
For example: “Does the wording of a question affect estimates of vehicle speed?”
Hypotheses
A hypothesis is a testable prediction about what the researcher expects to find.
Null and alternative hypotheses
A null hypothesis predicts no effect, no difference or no relationship. An alternative hypothesis predicts that there will be an effect, difference or relationship.
One-tailed and two-tailed hypotheses
A one-tailed hypothesis, also called a directional hypothesis, predicts the direction of the result.
A two-tailed hypothesis, also called a non-directional hypothesis, predicts that there will be an effect or difference, but not which way it will go.
Writing hypotheses from a research question
Research question: “Does the verb used in a question affect participants’ speed estimates?”
- Identify the independent variable: the verb in the question, such as “smashed” or “contacted”.
- Identify the dependent variable: the participant’s estimated speed.
- Write a directional alternative hypothesis if past research justifies a direction: participants asked the “smashed” question will give higher speed estimates than participants asked the “contacted” question.
- Write the null hypothesis as the opposite statistical claim: there will be no significant difference in speed estimates between the two verb conditions.
Null does not mean boring
Do not write “nothing will happen” vaguely. The null must refer to the measured variables: “There will be no significant difference in estimated speed between the conditions.”
Populations, samples and sampling techniques
The target population is the full group the researcher wants to generalise to. A sample is the smaller group who actually take part.
In Component 02, this matters when evaluating core studies. For example, Milgram’s (1963) sample of American male volunteers limits generalisability, while Bocchiaro et al. (2012) used students in the Netherlands, raising questions about sampling bias and ethnocentrism.
Sampling bias
Sampling bias occurs when the sample is unrepresentative of the target population, so some types of participant are over-represented or under-represented.
| Sampling technique | How it works | Strength | Weakness |
|---|---|---|---|
| Random sampling | Every member of the target population has an equal chance of selection. | Reduces researcher bias. | Needs a full list of the population and may be impractical. |
| Opportunity sampling | Uses people who are available at the time. | Quick and cheap. | Often unrepresentative. |
| Self-selected sampling | Participants volunteer, often after seeing an advert. | Useful for recruiting motivated participants. | Volunteer bias: volunteers may differ from non-volunteers. |
| Snowball sampling | Existing participants recruit further participants. | Useful for hard-to-reach groups. | Participants may be socially similar, reducing representativeness. |
Choosing a sampling method
A researcher wants to study coping strategies in people who have left a highly secretive online group.
- The target population is difficult to identify, so random sampling is unlikely because there is no complete list of members.
- Opportunity sampling may be too limited because people with this experience are rare.
- Snowball sampling is suitable because one participant may know others with the same experience.
- The AO3 evaluation is that the sample may be biased because participants may recruit people from the same social network.
Experimental designs
An experimental design is the way participants are allocated to conditions of the independent variable.
Repeated measures design
In a repeated measures design, the same participants take part in every condition.
- Strength: controls participant variables because each person acts as their own control.
- Weakness: can create order effects, where performance changes due to practice, fatigue or boredom.
Independent measures design
In an independent measures design, different participants take part in each condition.
- Strength: avoids order effects.
- Weakness: participant variables may affect results.
Matched participants design
In a matched participants design, different participants are paired on relevant characteristics, such as age, gender or baseline aggression.
Bandura et al. (1961) used matching when studying transmission of aggression, matching children on pre-existing aggression before allocating them to conditions.
Participant variables
Participant variables are individual differences between participants, such as memory ability, personality, age or motivation, which may affect the dependent variable.
Choosing an experimental design
A researcher wants to test whether background music affects recall of a word list.
- If each participant does both the “music” and “silence” conditions, recall ability is controlled because the same people are compared with themselves.
- However, the word list task may create order effects: participants might improve through practice or get tired.
- A repeated measures design can still be used if the researcher counterbalances the order, so half do music first and half do silence first.
- If counterbalancing is impossible, an independent measures design may be safer, but the researcher must manage participant variables.
Variables and operationalisation
The independent variable, or IV, is what the researcher changes or compares. The dependent variable, or DV, is what the researcher measures.
Operationalisation
Operationalisation means defining a variable clearly enough that it can be measured or manipulated in a repeatable way.
For example, “obedience” is too vague by itself. In Milgram (1963), obedience was operationalised as whether participants continued to the maximum shock level of 450 volts. In Sperry (1968), visual information was carefully presented to one visual field so that responses could be linked to hemisphere function.
An extraneous variable is any variable other than the IV that might affect the DV. If it changes systematically with the IV, it becomes a confounding variable, making it difficult to know what caused the result.
Operationalising variables and controls
Aim: to investigate whether sleep affects memory.
- Operationalise the IV by creating two clear conditions: 8 hours of sleep and 4 hours of sleep before the memory task.
- Operationalise the DV as the number of words correctly recalled from a 20-word list.
- Identify extraneous variables: caffeine intake, difficulty of the word list, time of day and prior sleep habits.
- Control them by using the same word list, testing at the same time of day, giving standardised instructions and asking participants to avoid caffeine.
Use measurable verbs
In AO2 scenarios, replace vague words like “stress”, “aggression” or “memory” with observable measures: score on a questionnaire, number of aggressive acts, number of words recalled.
Designing observations
An observation records behaviour as it happens. Observations can be naturalistic or controlled, overt or covert, participant or non-participant.
Behavioural categories
Behavioural categories are specific behaviours that observers record.
Good categories should be:
- Objective: based on visible behaviour, not interpretation.
- Mutually exclusive: one behaviour should not fit two categories at once.
- Exhaustive: the coding system should cover all relevant behaviours.
Coding frames
A coding frame is the full set of behavioural categories and instructions used by observers.
In Bandura et al. (1961), aggressive behaviours toward the Bobo doll could be coded, such as hitting with a mallet, kicking, sitting on the doll or using aggressive speech.
Time sampling and event sampling
In time sampling, behaviour is recorded at set time intervals, such as every 30 seconds.
In event sampling, every occurrence of a target behaviour is recorded.
Designing behavioural categories
A researcher observes helping behaviour in a school corridor.
- “Being kind” is too subjective, so it must be operationalised into observable behaviours.
- Possible categories include “picks up dropped item”, “offers verbal help” and “walks past without stopping”.
- These categories are mutually exclusive if each event is coded once according to the first clear response.
- Event sampling is suitable if helping behaviours are rare, because the observer records each occurrence when it happens.
Overlapping categories
Avoid categories like “aggressive behaviour” and “hitting”, because hitting is a type of aggression. Overlap reduces reliability because observers may code the same act differently.
Designing self-reports
A self-report asks participants to provide information about themselves, often through questionnaires or interviews.
Open and closed questions
An open question allows participants to answer in their own words. This can produce rich qualitative data, but it is harder to analyse.
A closed question offers fixed response options. This is easier to quantify, but may oversimplify complex views.
Rating scales
A Likert rating scale asks participants to rate agreement with a statement, such as from “strongly disagree” to “strongly agree”.
A semantic differential rating scale asks participants to rate something between two opposite adjectives, such as “calm 1 2 3 4 5 anxious”.
Self-reports can suffer from social desirability bias, where participants give answers that make them look good. This is relevant to Bocchiaro et al. (2012), where people’s predictions about whistleblowing differed from actual behaviour.
Improving self-report questions
A researcher wants to measure attitudes to obedience.
- “Do you agree that only bad people obey harmful orders?” is leading and socially loaded, so it may bias responses.
- A more neutral Likert item is: “People may obey instructions even when they disagree with them.”
- A semantic differential item could ask participants to rate obedience between “acceptable” and “unacceptable”.
- Including both open and closed questions can balance depth with easy comparison.
Ethics when conducting research
Psychological research should follow the BPS Code of Human Research Ethics. Key issues include informed consent, right to withdraw, protection from harm, privacy, confidentiality, deception and debriefing.
Classic studies are useful AO3 examples. Milgram (1963) involved deception and psychological distress, although participants were debriefed. Bandura et al. (1961) raises protection-from-harm issues because children observed aggressive models. Loftus and Palmer (1974) used deception about the purpose of the questions, so debriefing was important.
Ethics is part of validity
If participants are distressed, misled or pressured, their behaviour may become less natural. Ethical problems can therefore also affect validity, not just morality.
Planning how data will be analysed
You should plan the analysis before collecting data. The type of data affects the descriptive statistic, graph and inferential test.
Levels of measurement
- Nominal data: categories or frequencies, such as “obeyed” or “disobeyed”.
- Ordinal data: ranked or ordered data, such as rating-scale scores.
- Interval data: numerical data with equal intervals between values, such as many test scores.
- Ratio data: interval-like data with a true zero. OCR usually focuses on nominal, ordinal and interval, but ratio data matters when discussing parametric-test assumptions.
Descriptive statistics
Measures of central tendency describe a typical score: mode, median and mean.
Measures of dispersion describe spread: range, variance and standard deviation.
You may also report ratios, percentages and fractions, such as the proportion of participants who obeyed.
Summarising questionnaire ratings
Five participants rate stress from 1 to 5: 2, 3, 4, 4, 5.
- The data are ordinal because the ratings are ordered, but the gap between 2 and 3 may not be psychologically equal to the gap between 4 and 5.
- The median is 4 because the middle score is 4.
- The mode is 4 because it appears most often.
- The percentage scoring 4 or 5 is calculated as 35×100=60%\frac{3}{5} \times 100 = 60\%53×100=60%.
Graphs
Choose a graph that matches the data:
- Bar chart: categories or discrete conditions, with gaps between bars.
- Histogram: continuous interval data grouped into bands, with bars touching.
- Line graph: change over time or ordered conditions.
- Pie chart: proportions of a whole.
- Scatter diagram: relationship between two co-variables.
Planning inferential statistics
Inferential statistics help decide whether results are likely to be due to chance.
The significance level is the cut-off for deciding whether to reject the null hypothesis. In psychology, a common level is p≤0.05p \le 0.05p≤0.05, meaning a 5% or lower probability of the result occurring by chance if the null hypothesis is true.
Use statistical tables of critical values. You need the correct test, sample size, significance level and whether the hypothesis is one-tailed or two-tailed. Read the table rule carefully: for some tests the observed value must be greater than the critical value; for others it must be less than or equal to it.
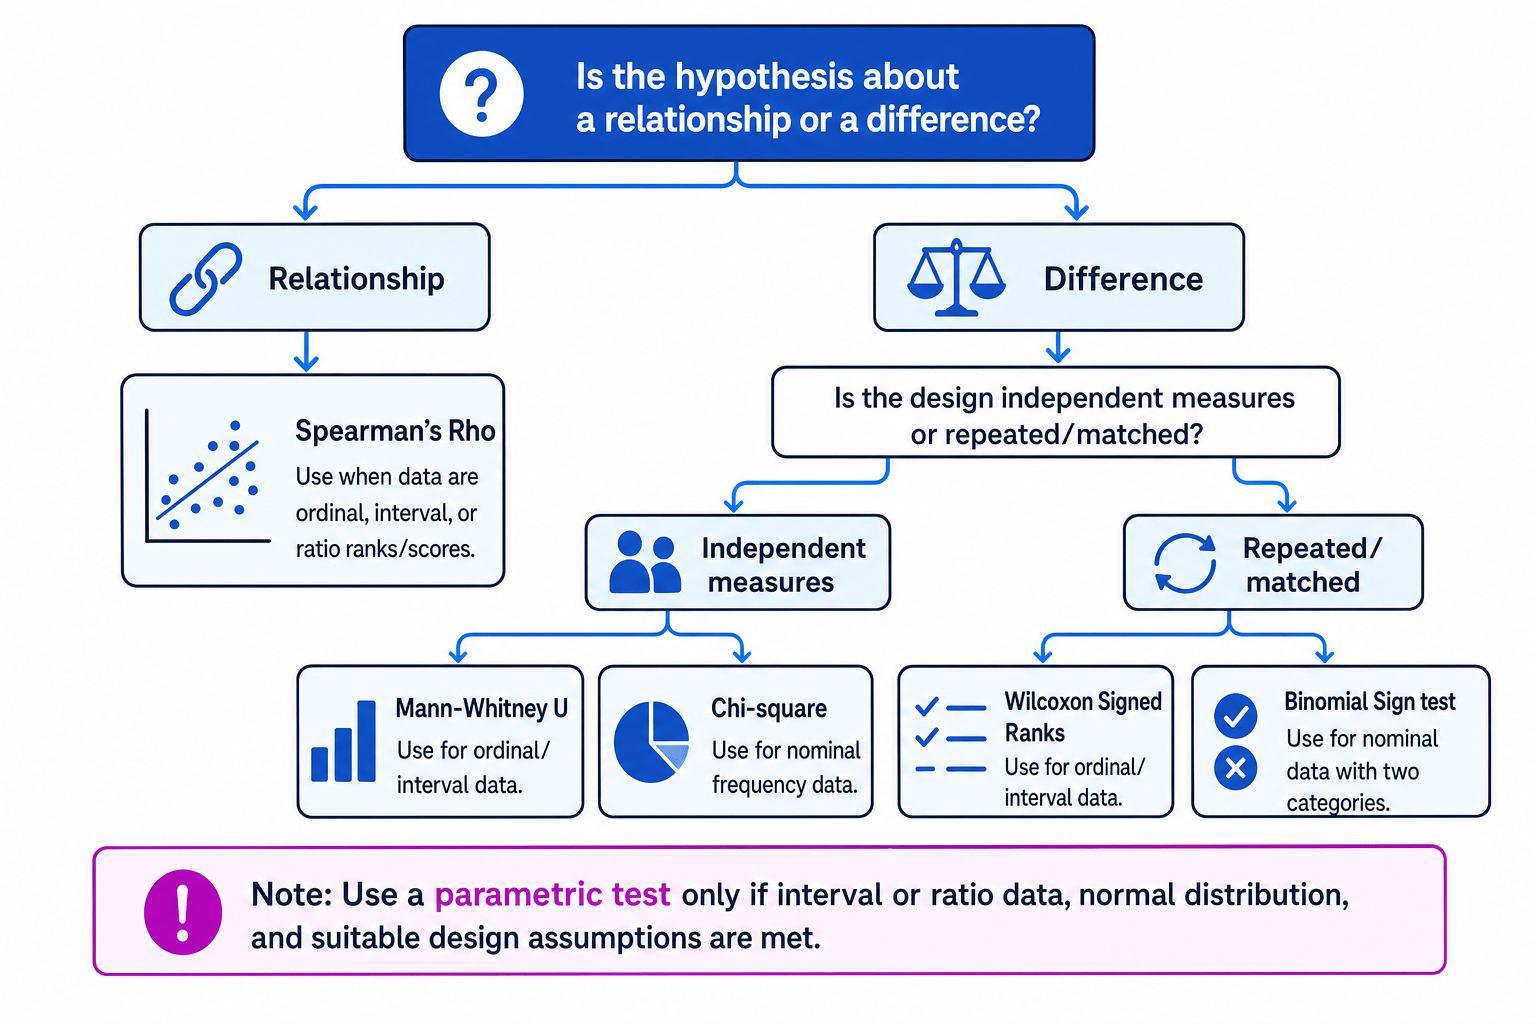
Non-parametric tests you need to know
| Test | Use when |
|---|---|
| Spearman’s Rho | Testing a relationship/correlation using ordinal data or ranked scores. |
| Mann-Whitney U | Testing a difference between two independent groups using ordinal or interval data. |
| Wilcoxon Signed Ranks | Testing a difference between two related conditions using ordinal or interval data. |
| Chi-square | Testing association or difference using nominal frequency data. |
| Binomial Sign test | Testing a difference in related data when only direction or two-category nominal change is recorded. |
A parametric test is used when stricter assumptions are met: usually interval or ratio data, an approximately normal distribution, and suitable design assumptions such as similar variance between groups. Parametric tests can be more powerful, but only if their assumptions are reasonable.
Choosing an inferential test
A researcher compares estimated car speeds from two separate groups: one hears “smashed” and one hears “contacted”.
- The hypothesis is about a difference, not a relationship, because two conditions are being compared.
- The design is independent measures because different participants are in each verb condition.
- The DV is a numerical speed estimate, but if the researcher is choosing from OCR’s named non-parametric tests, Mann-Whitney U fits an independent-groups difference.
- If the data were clearly interval/ratio, normally distributed and met parametric assumptions, a parametric alternative could be considered.
Errors in significance decisions
A Type I error is a false positive: rejecting the null hypothesis when it is actually true. A Type II error is a false negative: failing to reject the null hypothesis when there really is an effect.
Symbols in tables
Read symbols carefully: = means equal to, < means less than, > means greater than, << means much less than, >> means much greater than, ∞ means infinity or a very large table row, and ~ can mean approximately or “is distributed as”.
AO1, AO2 and AO3 in this topic
For AO1, define the method accurately: “A repeated measures design uses the same participants in all conditions.”
For AO2, apply it to the scenario: “The same participants would complete both the silent and music recall tasks.”
For AO3, evaluate it: “This controls participant variables, but order effects may reduce internal validity unless counterbalancing is used.”
In the exam
- Name the concept precisely, then apply it to the study or scenario using the actual variables.
- Link strengths and weaknesses to validity, reliability, ethics, sampling bias or generalisability.
- For statistics questions, identify relationship vs difference, design type, data level, one-tailed/two-tailed hypothesis and significance level before choosing the test.
Check yourself
- Can you turn a vague aim into a research question, null hypothesis and alternative hypothesis?
- Which sampling method would you choose for a rare or hard-to-reach target population, and why?
- How do you decide between Mann-Whitney U, Wilcoxon, Chi-square, Binomial Sign test and Spearman’s Rho?