What you'll learn
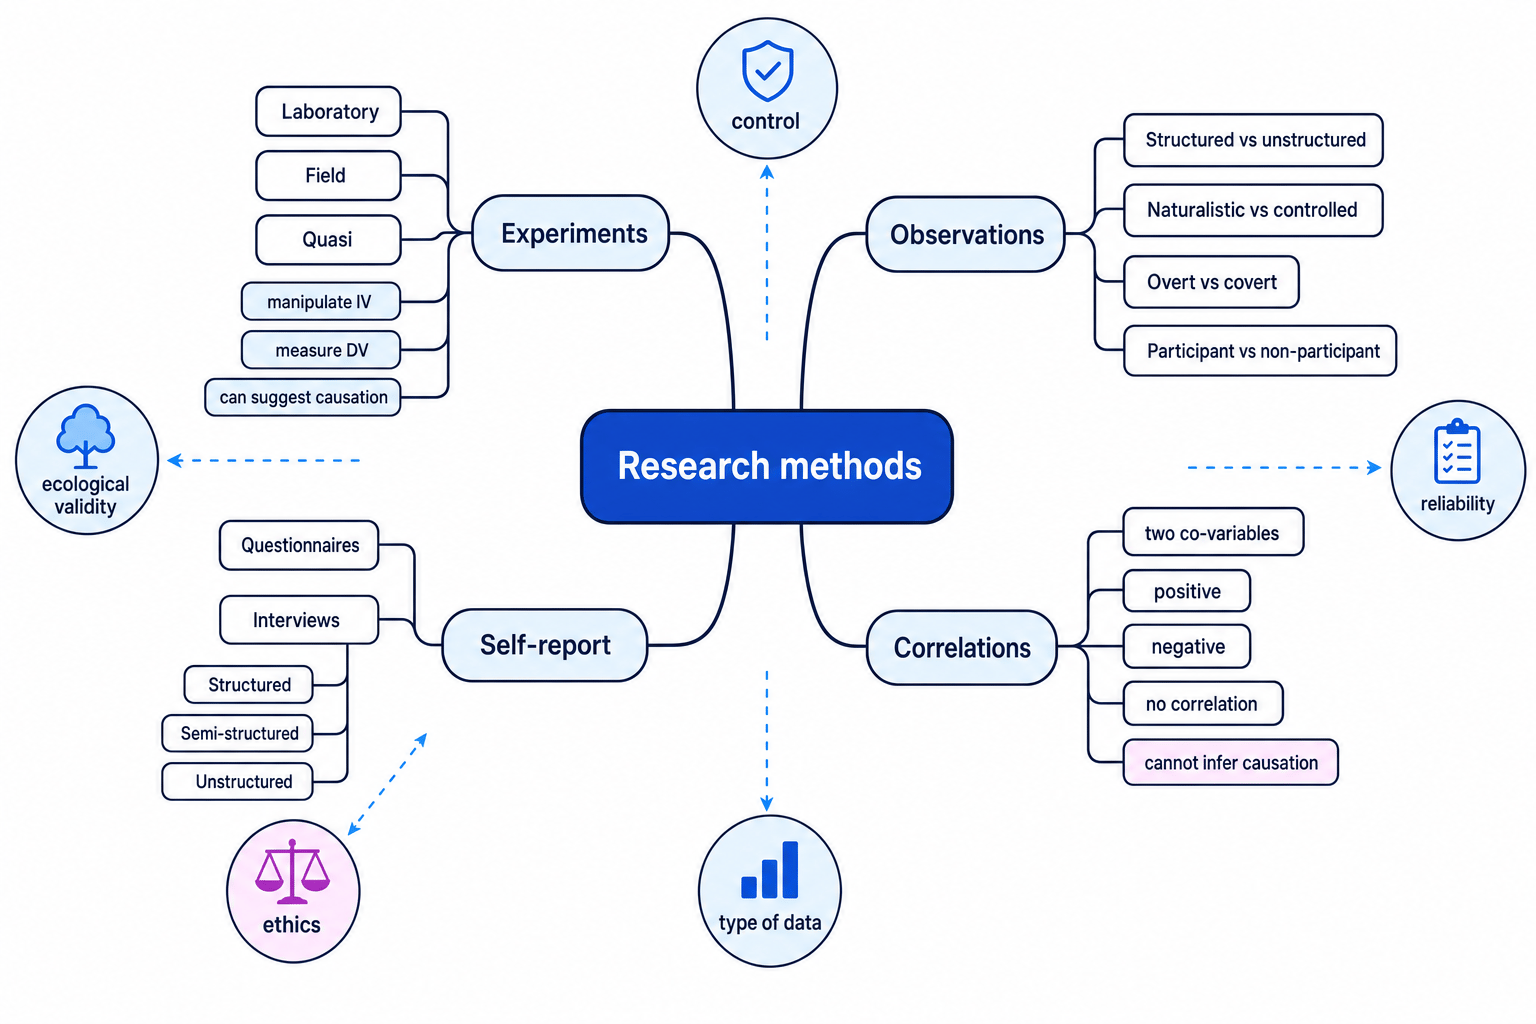
- How experiments, observations, self-reports and correlations differ.
- How to choose the right method for a research aim or scenario.
- Strengths, weaknesses and ethics issues linked to each method.
- How research methods connect to data, graphs, significance testing and AO1/AO2/AO3 answers.
The big picture: what is a research method?
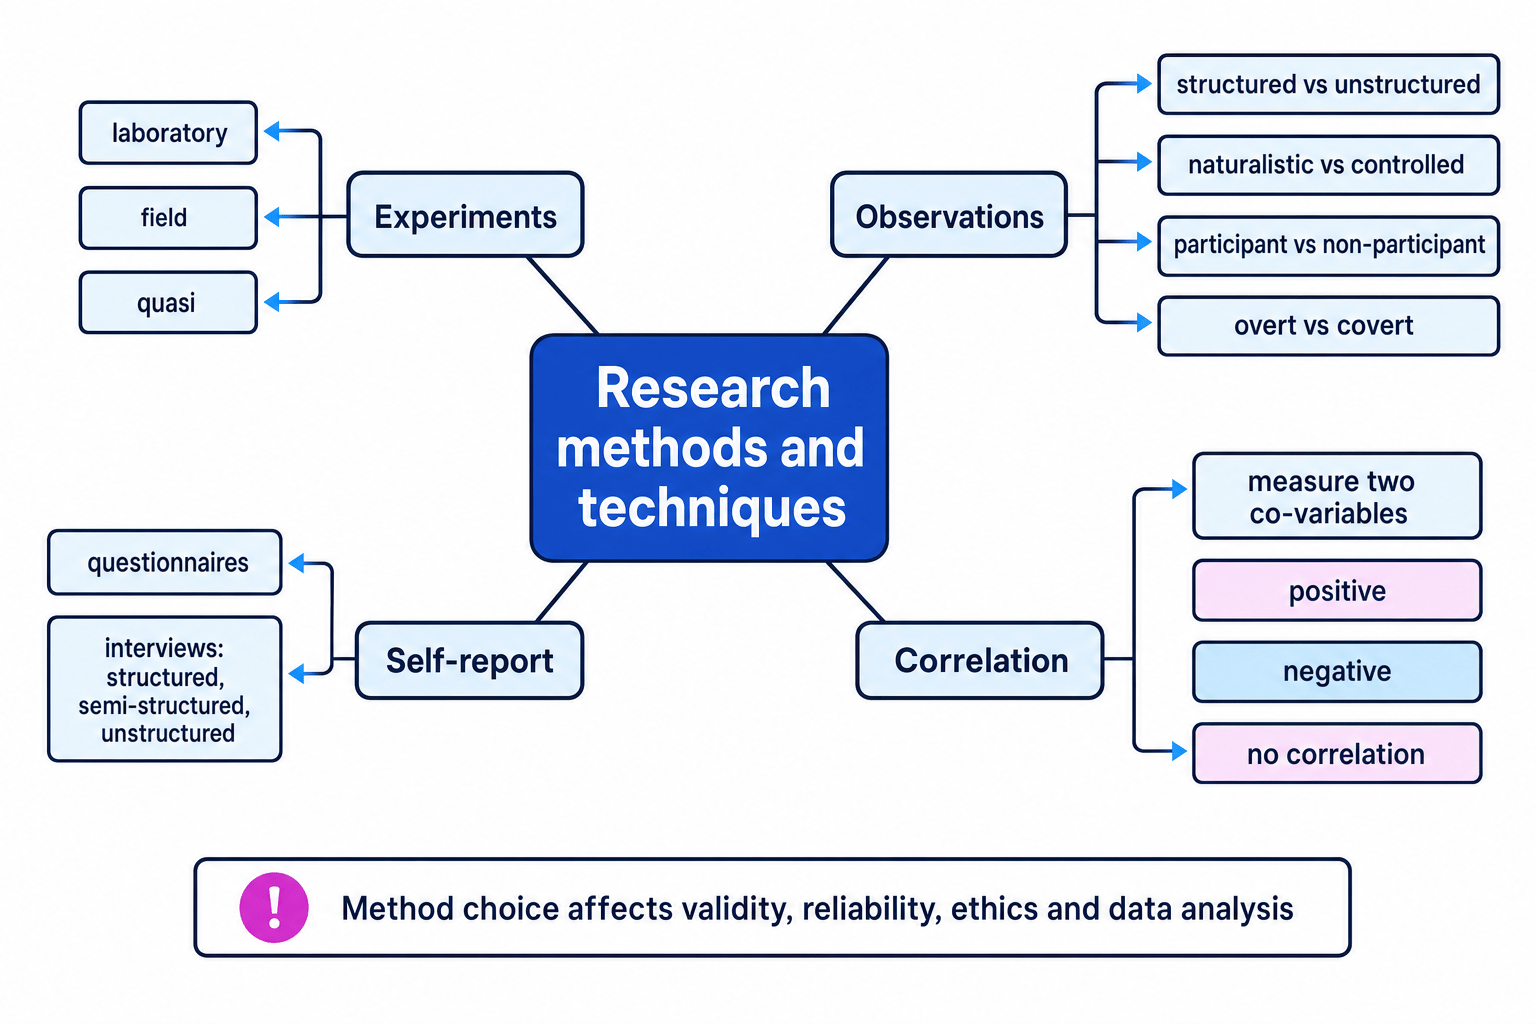
A research method is the way psychologists collect evidence about behaviour, thoughts or experience. A technique is a more specific version of that method, such as a structured interview or a naturalistic observation.
Method choice matters
The method affects the whole study: how much control the researcher has, how realistic the behaviour is, what ethical issues arise, what data is collected, and which statistical test is appropriate.
Before methods: aims, variables and data
An aim is the general purpose of a study. A hypothesis is a testable prediction.
A variable is anything that can vary. In an experiment, the independent variable, or IV, is what the researcher changes. The dependent variable, or DV, is what the researcher measures. To operationalise a variable means defining it clearly enough to measure, such as “number of aggressive acts in 10 minutes” rather than just “aggression”.
An extraneous variable is an unwanted factor that could affect the DV. If it varies systematically with the IV, it becomes a confounding variable, making cause and effect harder to judge.
Experiments: testing cause and effect
Experiment
An experiment is a method where the researcher manipulates an IV and measures its effect on a DV while trying to control other variables.
Experiments are useful because they can suggest causation, meaning one thing directly affects another. However, the type of experiment changes how much control and realism you get.
Laboratory experiment
A laboratory experiment takes place in a controlled setting, often not the participant’s everyday environment. The researcher controls the procedure carefully.
Classic OCR core-study links include Milgram (1963) on obedience, Loftus and Palmer (1974) on eyewitness testimony, and Bandura et al. (1961) on aggression. These used controlled procedures, making them easier to replicate, but they can suffer from low ecological validity, meaning the behaviour may not reflect real life.
Field experiment
A field experiment takes place in a natural environment, but the researcher still manipulates the IV. It usually has higher ecological validity than a lab experiment, but less control over extraneous variables.
A useful comparison is Piliavin et al. (1969), the subway Samaritan study, which studied helping behaviour in a real public setting. This increased realism, but also raised ethical issues around consent and deception.
Quasi experiment
A quasi experiment compares naturally occurring groups or conditions. The researcher does not create the IV or randomly allocate participants.
For example, Sperry (1968) studied people who had already had split-brain surgery. This gives valuable evidence about rare real-world differences, but cause and effect is weaker because the researcher cannot randomly allocate people to “split-brain” and “non-split-brain” groups.
Identifying an experimental method
A psychologist shows one group a film of a car crash and asks, “How fast were the cars going when they smashed?” Another group sees the same film but is asked, “How fast were the cars going when they hit?”
- The researcher manipulates the wording of the question, so there is an IV: “smashed” versus “hit”.
- The researcher measures estimated speed, so there is a DV.
- The setting and materials are controlled, so this is best classified as a laboratory experiment, like Loftus and Palmer (1974).
- The strength is control and replicability; the weakness is that watching a film clip is less realistic than witnessing a real accident.
Calling every controlled study a lab experiment
A study is not a laboratory experiment just because it is controlled. To be an experiment, the researcher must manipulate an IV. If they only measure existing differences, it may be quasi or correlational.
Observations: watching behaviour
Observation
An observation is a method where researchers watch and record behaviour instead of asking participants to report it.
Observations are especially useful when participants might lie, forget, or be unable to explain their behaviour. For example, Bandura et al. (1961) used a structured observation to count children’s aggressive acts towards a Bobo doll.
Structured and unstructured observations
A structured observation uses pre-decided behavioural categories, such as “verbal aggression” or “physical aggression”. This improves reliability because observers know exactly what to record.
An unstructured observation records behaviour more freely. It gives richer detail but is more subjective and harder to replicate.
Naturalistic and controlled observations
A naturalistic observation takes place in the participant’s usual environment. A controlled observation happens in a setting arranged by the researcher.
Naturalistic observations are more realistic, but controlled observations allow better standardisation.
Participant and non-participant observations
In a participant observation, the researcher joins the group being studied. In a non-participant observation, the researcher watches without joining in.
Participant observation can give deeper insight, but the researcher may lose objectivity.
Overt and covert observations
An overt observation is one where participants know they are being observed. A covert observation is one where they do not know.
Covert observations reduce demand characteristics, where participants change behaviour because they know they are being studied. However, covert observation raises BPS ethics issues, especially informed consent, privacy and the right to withdraw.
Evaluating observations
For AO3, think in pairs: structured improves reliability but may miss detail; naturalistic improves ecological validity but reduces control; covert improves natural behaviour but creates ethical problems.
Self-report: asking people directly
Self-report
A self-report is any method where participants provide information about themselves, usually through questionnaires or interviews.
Self-reports are useful for studying thoughts, attitudes and feelings that cannot be directly observed. However, they are vulnerable to social desirability bias, where people give answers that make them look good.
Questionnaires
A questionnaire is a written set of questions. It can include closed questions, which have fixed answers, or open questions, where participants answer in their own words.
Closed questions are easy to analyse and can produce quantitative data. Open questions give richer qualitative data but are harder to code reliably.
Interviews
A structured interview uses the same questions in the same order for everyone. A semi-structured interview has prepared questions but allows follow-up prompts. An unstructured interview is more like a guided conversation.
Structured interviews are reliable and easy to compare. Unstructured interviews can produce deeper insight but are harder to replicate and may be affected by interviewer bias.
Assuming self-report equals truth
A questionnaire measures what participants say, not necessarily what they actually think or do. In evaluation, mention memory errors, social desirability, demand characteristics and leading questions.
Correlation: measuring association
Correlation
A correlation is a statistical relationship between two measured variables, called co-variables. The researcher does not manipulate an IV.
To obtain data for correlational analysis, researchers measure two co-variables for each participant. For example, they might measure stress score and hours of sleep, then plot the paired scores on a scatter diagram.
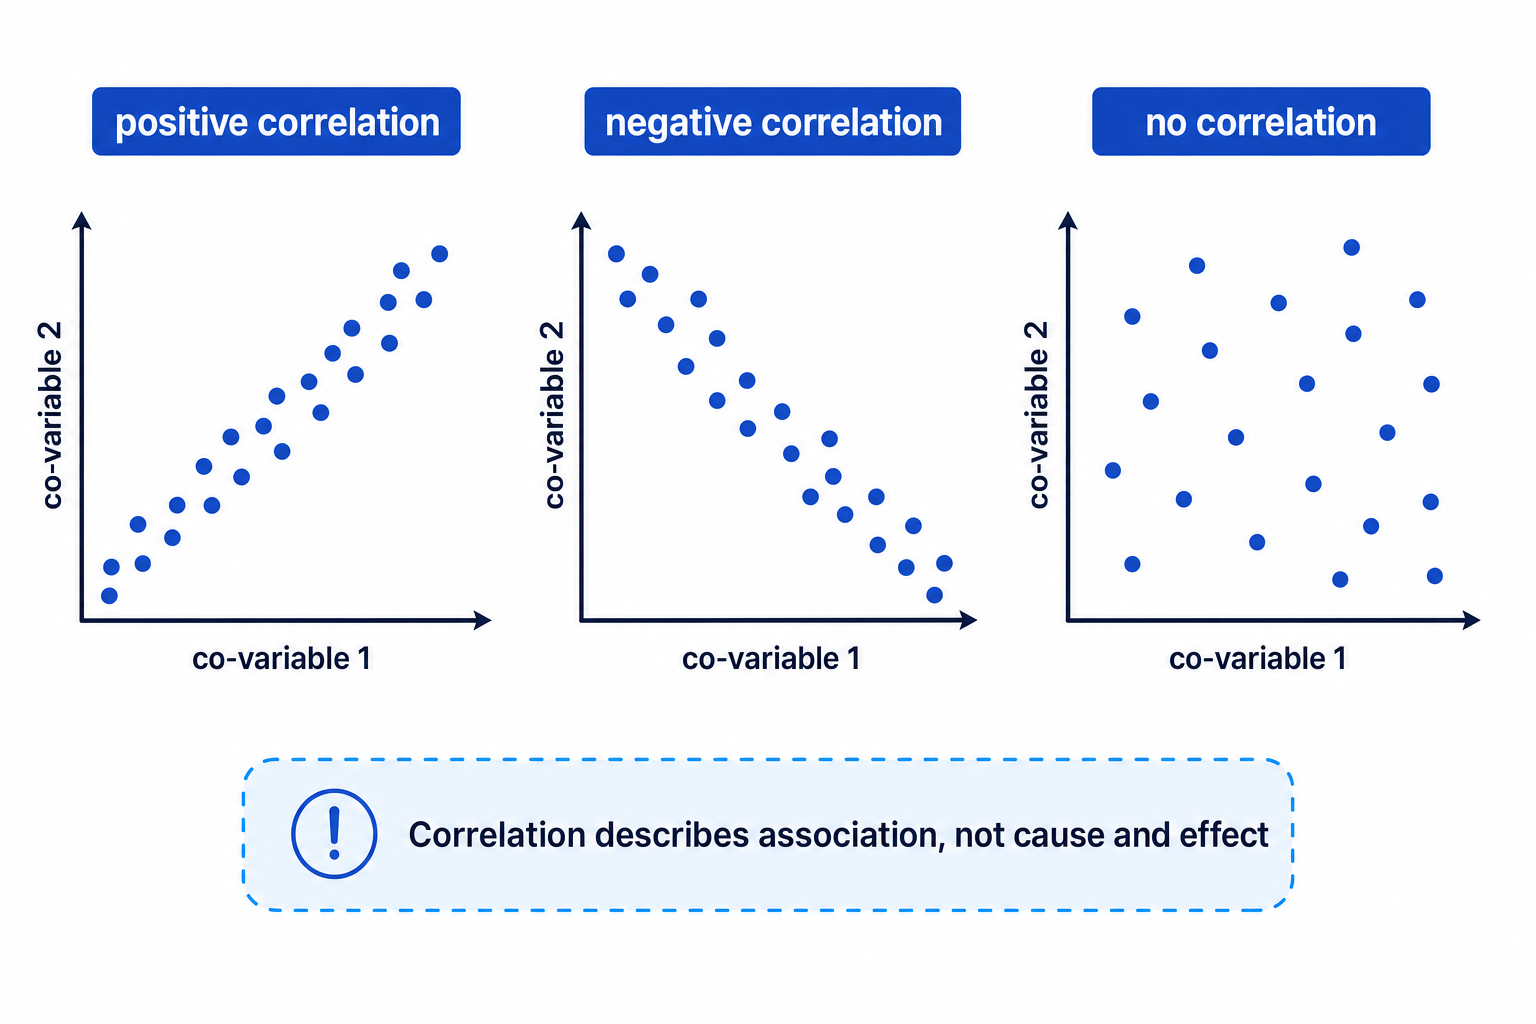
A positive correlation means both co-variables tend to increase together. A negative correlation means one tends to increase as the other decreases. No correlation means there is no clear relationship.
Correlation is not causation
A correlation does not prove that one co-variable causes the other. There may be a third variable, or the direction of effect may be unclear.
Interpreting a correlation
A researcher finds that students who report more revision hours tend to get higher test scores.
- Both variables are measured rather than manipulated, so this is a correlation, not an experiment.
- As revision hours increase, test scores also tend to increase, so the relationship is positive.
- You cannot conclude that revision definitely caused the higher scores because motivation, prior knowledge or teacher support could also explain the relationship.
From methods to data
Psychologists need to know what kind of data they have before choosing averages, graphs or statistical tests.
Levels of measurement
Nominal data is category data, such as “helped” or “did not help”. Ordinal data can be put in order, such as ranks or rating scales. Interval data uses equal units, such as many test scores or reaction times. Ratio data has a true zero, but OCR usually focuses on nominal, ordinal and interval.
Descriptive statistics
The mode is the most common score. The median is the middle score when data is ordered. The mean is the arithmetic average.
The range is the highest score minus the lowest score. Variance and standard deviation describe how spread out the scores are; a larger standard deviation means scores are more dispersed around the mean.
You may also express data using fractions, percentages or ratios. For example, 12 out of 20 participants is 60%, or a ratio of 3:2 if comparing 12 to 8.
Graphs
Use a bar chart for separate categories, a histogram for continuous interval data, a line graph for change across time or ordered conditions, a pie chart for parts of a whole, and a scatter diagram for correlations.
Bar chart versus histogram
Bar charts have gaps because categories are separate. Histograms usually have touching bars because the data is continuous.
Choosing statistical tests
Inferential statistics help decide whether a result is likely to be meaningful or could have occurred by chance.
A significance level is the cut-off for accepting a result as statistically significant. Psychologists often use p<0.05p < 0.05p<0.05, meaning there is less than a 5% probability that the result occurred by chance if the null hypothesis is true. A stricter level is p<0.01p < 0.01p<0.01.
Researchers compare an observed test value with a critical value in statistical tables. The correct table depends on the test, sample size, significance level and whether the hypothesis is one-tailed or two-tailed.
A Type I error is a false positive: saying there is a significant effect when there is not. A Type II error is a false negative: missing a real effect.
Symbols you may see include = for equal to, < for less than, > for greater than, << for much less than, >> for much greater than, ∞ for infinity, and ~ for approximately or “distributed as”.
Named non-parametric tests
Use Mann-Whitney U for a difference between two independent groups using ordinal or ranked data.
Use Wilcoxon Signed Ranks for a difference between two related conditions, such as repeated measures or matched pairs, using ordinal or ranked data.
Use Chi-square for nominal category frequencies, often testing an association between categories.
Use the Binomial Sign test for related nominal data where changes can be coded as plus or minus.
Use Spearman’s Rho for a correlation between two co-variables using ordinal, ranked or non-parametric data.
A parametric test is considered when data is interval or ratio, approximately normally distributed, has similar variance across conditions, and is not badly distorted by outliers.
Choosing a statistical test
A psychologist investigates whether anxiety rank is related to number of hours spent on social media. The data is not normally distributed.
- The question asks about a relationship between two co-variables, not a difference between groups.
- The data can be ranked and parametric assumptions are not met, so a non-parametric correlation test is needed.
- The correct choice is Spearman’s Rho.
- If the result is significant, the researcher can describe the direction and strength of the association, but still cannot claim cause and effect.
In the exam
- For AO1, define the method precisely and name the subtype, such as laboratory experiment, structured observation or semi-structured interview.
- For AO2, apply the method to the scenario: identify the IV/DV, co-variables, behavioural categories, question type or data level.
- For AO3, evaluate using control, ecological validity, reliability, sampling bias, ethics, demand characteristics and usefulness.
Check yourself
- Why can a quasi experiment be useful but weaker for cause and effect than a laboratory experiment?
- What is the difference between a structured observation and an unstructured observation?
- Which statistical test would you consider for a correlation using ranked data?