What you'll learn
- How to describe the main psychological methodologies used in Eduqas Component 2.
- How each method produces quantitative and/or qualitative data.
- How to apply methods to unfamiliar scenarios in AO2 questions.
- How to evaluate methods using validity, reliability, ethics and usefulness.
The big picture: what is a methodology?
A methodology is the overall way a psychologist gathers evidence to answer a research question. A method is the specific procedure used, such as a questionnaire, observation, experiment or brain scan.
The map below shows how the main methodologies connect to data source, data type and time frame.
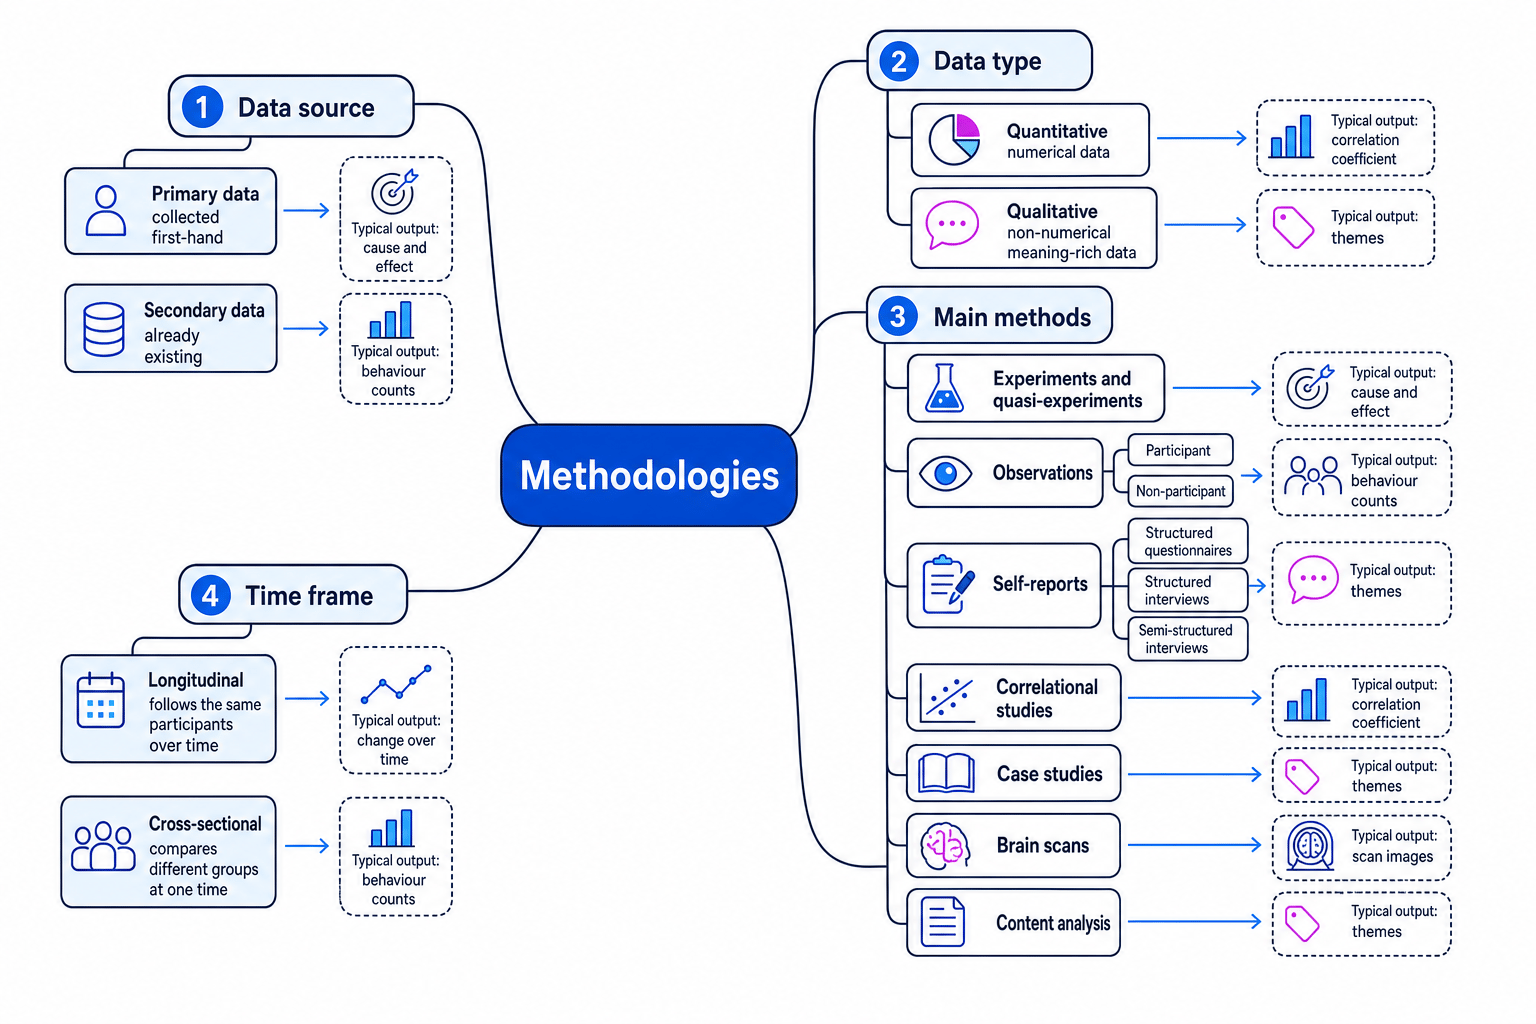
Core data terms
- Primary data is evidence collected first-hand by the researcher for the current study.
- Secondary data is evidence that already exists, such as records, diaries, media reports or published statistics.
- Quantitative data is numerical data, such as scores, frequencies or ratings.
- Qualitative data is non-numerical data, such as interview responses, observations, explanations or themes.
Method choice drives everything
In Component 2, always link the method to the aim, the data type, the sample, the ethics, and the kind of analysis that could be carried out afterwards.
Experiments
An experiment investigates cause and effect by manipulating an independent variable, often shortened to IV. The IV is the factor deliberately changed by the researcher. The dependent variable, or DV, is the outcome measured.
For example, Loftus and Palmer (1974) used an experiment to test whether leading questions affected eyewitness memory. The wording of the question was the IV, and the estimated speed of the car was the DV.
Experiments often use standardisation, meaning the procedure is kept the same for all participants. This increases reliability, which means consistency. Experiments can also have strong internal validity, meaning the researcher can be more confident the IV caused the change in the DV.
However, experiments can be artificial. Participants may show demand characteristics, where they guess the aim and change their behaviour. Ethical issues can also arise if deception or distress is involved, as in Watson and Rayner’s (1920) Little Albert study.
Quasi-experiments
A quasi-experiment compares groups based on a naturally occurring difference rather than a researcher-manipulated IV. For example, Raine, Buchsbaum and LaCasse (1997) compared murderers pleading not guilty by reason of insanity with controls using PET brain scans. The researchers did not manipulate “being a murderer”; it was a participant variable.
Quasi-experiments are useful when manipulation would be impossible or unethical. The weakness is that cause and effect is harder to establish because participants were not randomly allocated to conditions.
Distinguishing an experiment from a correlation
A researcher wants to study whether sleep affects memory.
- If the researcher controls sleep length, such as assigning one group to 4 hours and another to 8 hours, sleep length is being manipulated as the IV.
- If memory is then measured using the same word-recall test, the score is the DV, so the method is an experiment.
- If the researcher simply records each person’s usual sleep and memory score, both are measured variables rather than manipulated variables.
- That second version is a correlational study, so it may show a relationship but cannot prove sleep caused the memory score.
Observations
An observation records behaviour as it happens. In a participant observation, the researcher joins the group or activity being studied. In a non-participant observation, the researcher watches without taking part.
Observations may be overt, where participants know they are being observed, or covert, where they do not. Covert observation can reduce demand characteristics, but it creates serious consent and privacy issues.
Researchers usually create behavioural categories, which are clear, observable behaviours to record. For example, Bandura, Ross and Ross (1961) counted aggressive behaviours such as hitting or kicking the Bobo doll.
Designing behavioural categories
A psychologist is observing helping behaviour in a school corridor.
- “Being kind” is too vague, so it must be operationalised into behaviours that can be seen and counted.
- Suitable categories might include “picks up dropped object”, “gives directions” and “holds door open”.
- The categories should be mutually exclusive, so the same behaviour is not counted twice.
- A second observer could use the same categories, allowing inter-rater reliability to be checked.
Observations can have high ecological validity because behaviour may be natural. However, observer bias can reduce validity if researchers record what they expect to see.
Self-reports: questionnaires and interviews
A self-report is any method where participants provide information about themselves, such as thoughts, feelings, memories or attitudes.
A questionnaire is usually written or online. It may use closed questions, which have fixed answers and produce quantitative data, or open questions, which allow fuller qualitative responses.
A structured interview uses the same fixed questions in the same order for every participant. This makes it easier to compare answers. A semi-structured interview has prepared questions but allows follow-up questions, so it can explore meaning in more depth.
Loftus and Palmer (1974) used questionnaire-style self-report to measure speed estimates. Becker et al. (2002), in research on Fijian adolescents and eating attitudes, used self-report measures and interviews to gather data about attitudes and behaviour over time.
Self-reports are practical and can access private experiences that cannot be directly observed. The main weakness is social desirability bias, where participants give answers that make them look better. Memory errors and misunderstanding questions can also reduce validity.
Assuming self-report means questionnaire only
Questionnaires, structured interviews, semi-structured interviews, rating scales and written diaries can all be self-report methods because the participant is reporting information about themselves.
Content analysis
Content analysis is a systematic way of studying communication, such as newspapers, social media posts, films, diaries, therapy notes or interview transcripts.
It can be quantitative if the researcher counts words, images or themes. It can also be qualitative if the researcher interprets meanings, patterns or representations. Because it often uses existing material, content analysis commonly uses secondary data.
Good content analysis needs clear coding categories and checks for inter-rater reliability, meaning different coders agree on how to classify the material.
Its strengths are that it is unobtrusive and can study real-world material. Its weaknesses are that coding may be subjective, and the researcher may lose context by reducing rich communication to simple categories.
Correlational studies
A correlational study investigates whether two co-variables are related. Co-variables are measured variables, not manipulated variables. The relationship may be positive, negative or absent.
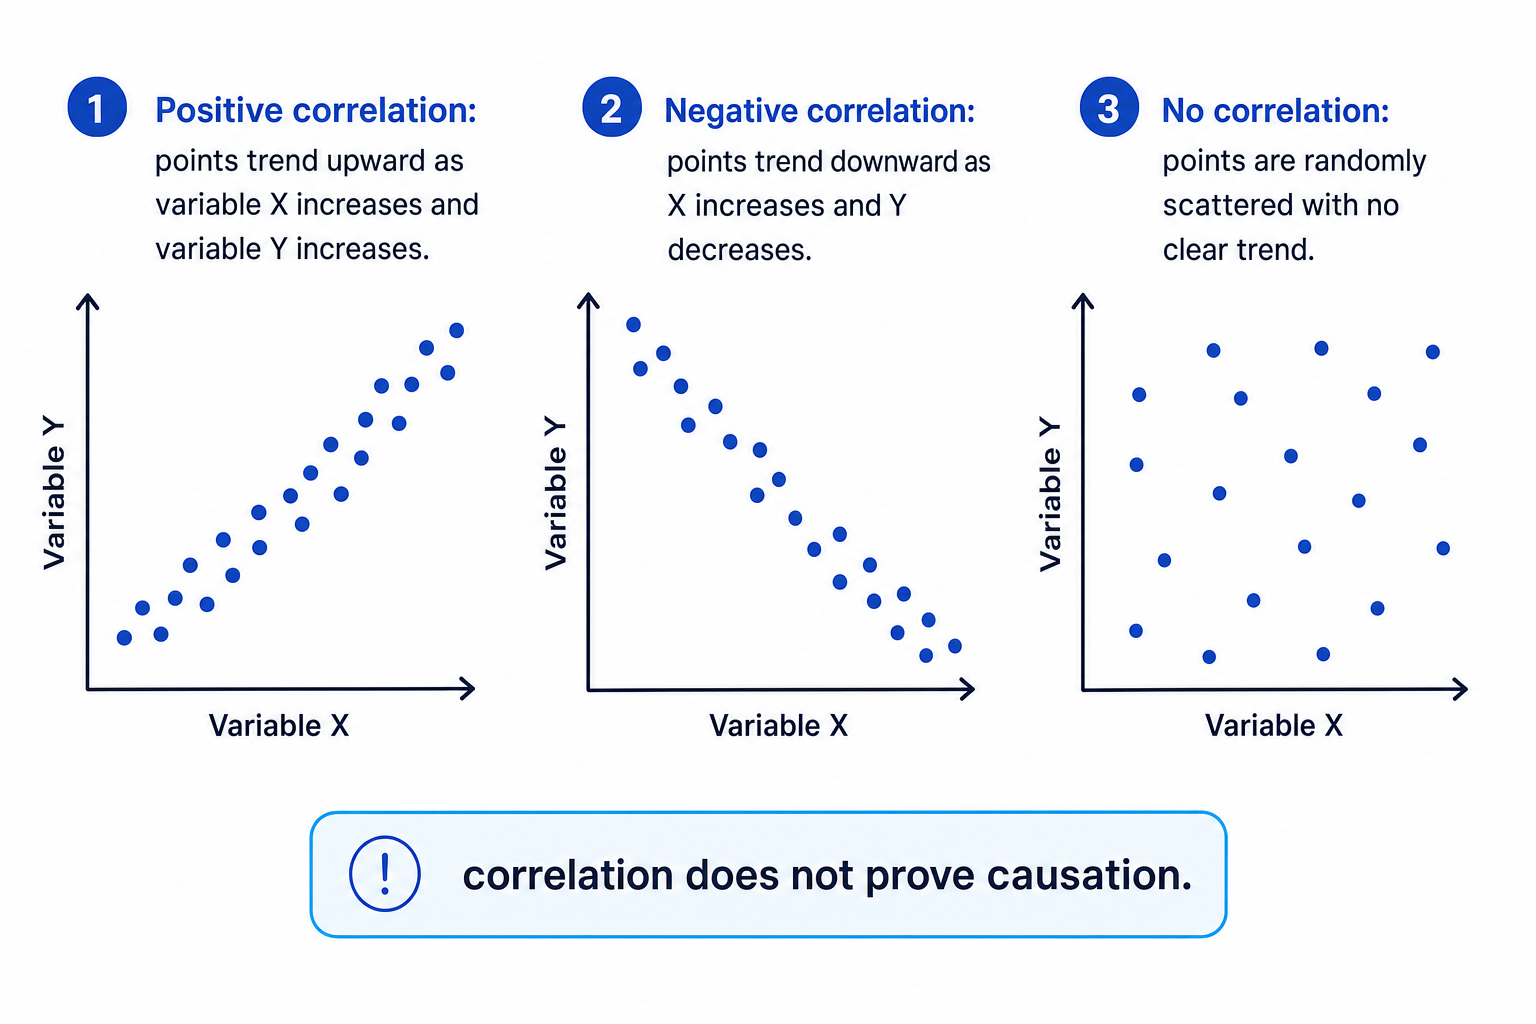
Correlations are useful when experiments would be unethical or impractical. For example, a psychologist could measure stress scores and sleep quality scores to see whether they are related.
Correlation is not causation
A correlation does not prove that one variable caused the other. There may be a third variable, or the direction of cause may be the opposite of what you first assume.
Case studies
A case study is an in-depth investigation of one person, group, institution or unusual event. It often combines several methods, such as interviews, observations, tests and records.
Freud’s (1909) Little Hans study is a classic case study. It produced detailed qualitative data about one child’s phobia, but it is difficult to generalise from one case. Case studies can also be affected by researcher bias, especially when interpretation is central.
Case studies are valuable for rare behaviours or conditions, but they require careful confidentiality because participants may be identifiable.
Brain scans
Brain scans are biological methods used to investigate brain structure or activity. PET scans show activity using a radioactive tracer, fMRI scans infer activity from blood oxygenation, and EEG records electrical activity from the scalp.
Raine et al. (1997) used PET scans to compare brain activity in murderers and controls. Brain scans produce quantitative and visual data, which can seem objective. However, scans are expensive, tasks may be artificial, and interpretation still involves judgement.
Ethically, researchers need informed consent, protection from harm and a plan for dealing with unexpected findings.
Longitudinal and cross-sectional studies
A longitudinal study follows the same participants over time. This is useful for studying development or change, such as how attitudes shift after a social change. Its weaknesses are time, cost and participant drop-out.
A cross-sectional study compares different groups at one point in time, such as younger and older participants. It is quicker, but differences may be due to cohort effects, meaning groups differ because of the historical period or culture they grew up in.
From methodology to analysis
Your method affects the data you collect and the statistical test you can use.
Levels of measurement matter:
- Nominal data uses categories or frequencies, such as yes/no responses.
- Ordinal data can be ranked or ordered, such as rating scales.
- Interval data has equal intervals between values, such as many standardised test scores.
For descriptive statistics, you may use measures of central tendency such as mean, median and mode, and measures of dispersion such as range and standard deviation. Graph choice also matters: bar charts suit categories, scattergraphs suit correlations, and line graphs suit change over time.
For inferential testing, the main Eduqas tests include:
- Spearman’s rho for correlations with ordinal data.
- Mann-Whitney U for differences between unrelated groups using ordinal data.
- Wilcoxon signed-ranks for differences between related conditions using ordinal data.
- Unrelated t-test for differences between unrelated groups using interval data.
- Related t-test for differences between related conditions using interval data.
- Chi-square for associations or differences using nominal frequency data.
- Binomial sign test for related nominal data where direction of change is counted.
A result is usually judged against the default significance level of p≤0.05p \le 0.05p≤0.05. You compare the observed value with a critical value from a table, using the correct sample size, significance level and whether the hypothesis is one-tailed or two-tailed. A one-tailed hypothesis predicts a direction; a two-tailed hypothesis predicts a difference or relationship without saying which direction.
Choosing an inferential test
A researcher compares anxiety ratings from two different therapy groups using a 1–10 rating scale.
- The aim is to test a difference between two groups, not a relationship between co-variables.
- The participants in one therapy group are different from the participants in the other group, so the design is unrelated.
- A rating scale is usually treated as ordinal because the gaps between points may not be equal.
- Difference + unrelated groups + ordinal data means the appropriate test is Mann-Whitney U.
Observed versus critical values
Check the rule for the specific test table. For chi-square, Spearman’s rho and t-tests, larger observed values usually indicate significance; for Mann-Whitney U, Wilcoxon signed-ranks and the binomial sign test, smaller observed values may be significant.
A Type I error is a false positive: concluding there is an effect when there is not. A Type II error is a false negative: missing a real effect. Setting a stricter significance level reduces Type I errors but can increase Type II errors.
Ethics across methodologies
The BPS Code of Ethics and Conduct requires consent, avoidance of unnecessary deception, right to withdraw, protection from harm, confidentiality and debriefing. These apply differently across methods: covert observations challenge consent, brain scans raise protection-from-harm issues, and case studies create confidentiality risks.
For animal research, psychologists must also consider scientific justification, the 3Rs of replacement, reduction and refinement, species-appropriate care, minimising suffering and legal regulation.
In the exam
- Start AO1 by naming and defining the method, then describe how data is collected.
- For AO2, use details from the scenario: participants, setting, variables, data type and ethics.
- For AO3, evaluate validity, reliability, generalisability, ethics and whether the method gives quantitative or qualitative evidence.
Check yourself
- What is the difference between an experiment and a quasi-experiment?
- Why might a semi-structured interview produce richer data than a questionnaire?
- Which method would you choose to study change in the same participants over several years, and why?
