What you'll learn
- How to tell the difference between nominal, ordinal, interval and ratio data.
- Why levels of measurement matter when choosing descriptive statistics, graphs and inferential tests.
- How to apply data levels to Component 2 practical investigations and novel scenarios.
- Common exam traps, especially with Likert scales, ranks and “true zero”.
Why levels of measurement matter
In psychology, researchers turn behaviour into data: numbers, categories, scores, ratings, times or counts. The level of measurement tells you what kind of information those data contain.
This matters because different data levels allow different conclusions. For example, if you only know whether someone chose “yes” or “no”, you cannot calculate a meaningful mean. If you measured reaction time in seconds, a mean and standard deviation make much more sense.
Level of measurement
A level of measurement is the type of information contained in a variable, which determines what mathematical operations, descriptive statistics, graphs and inferential tests are appropriate.
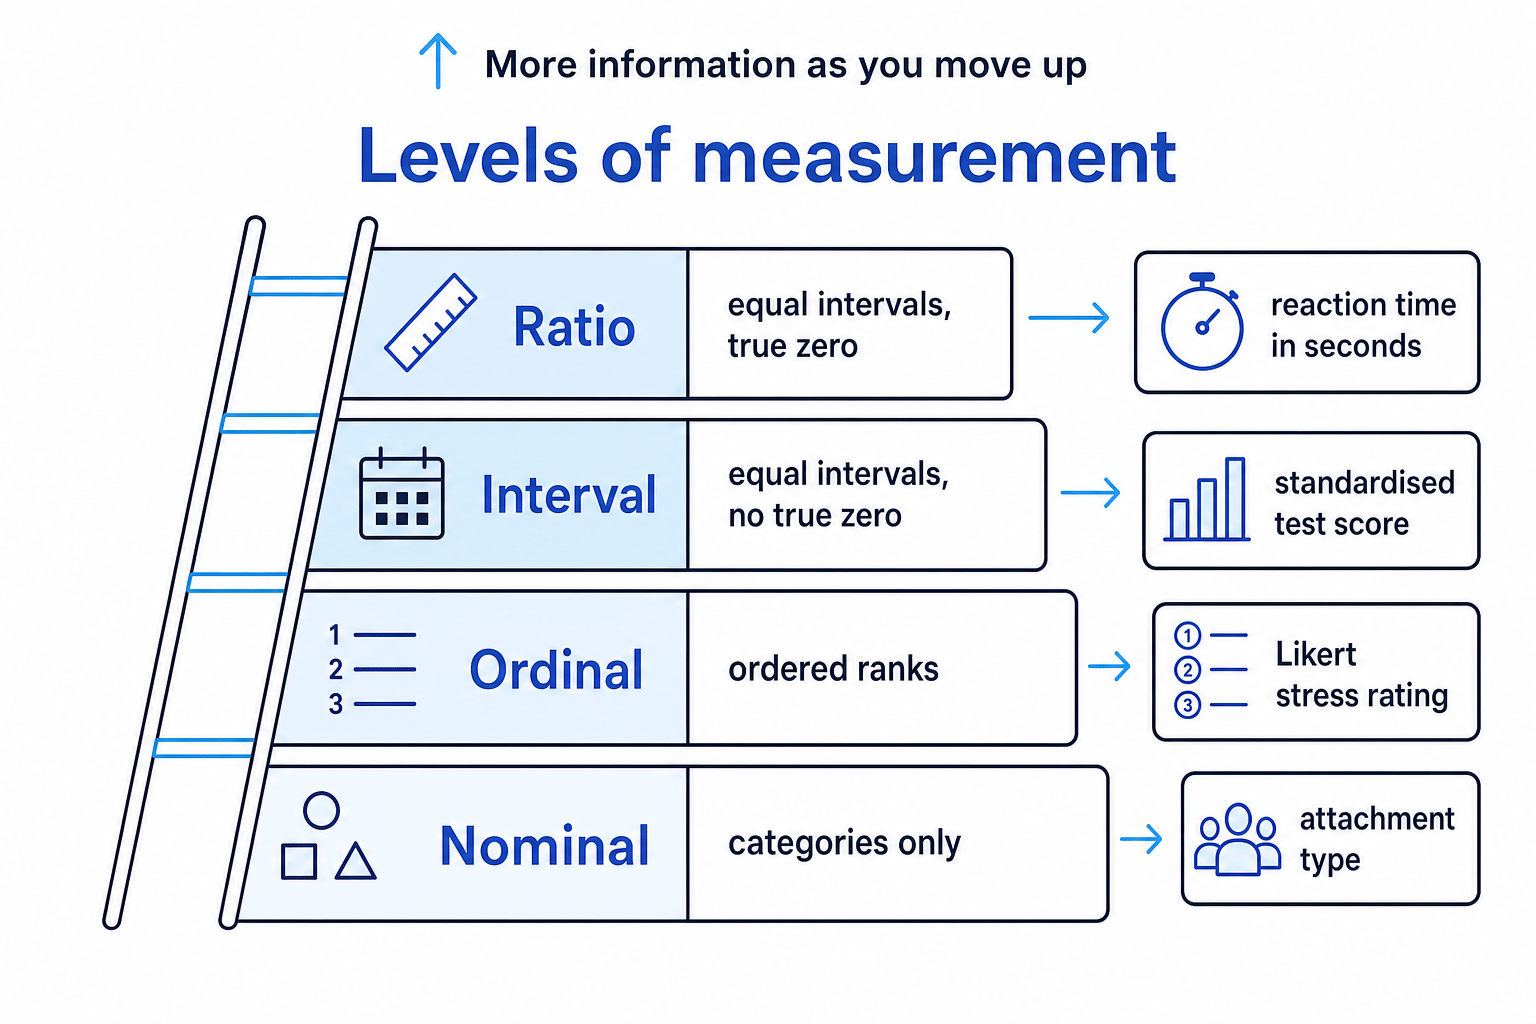
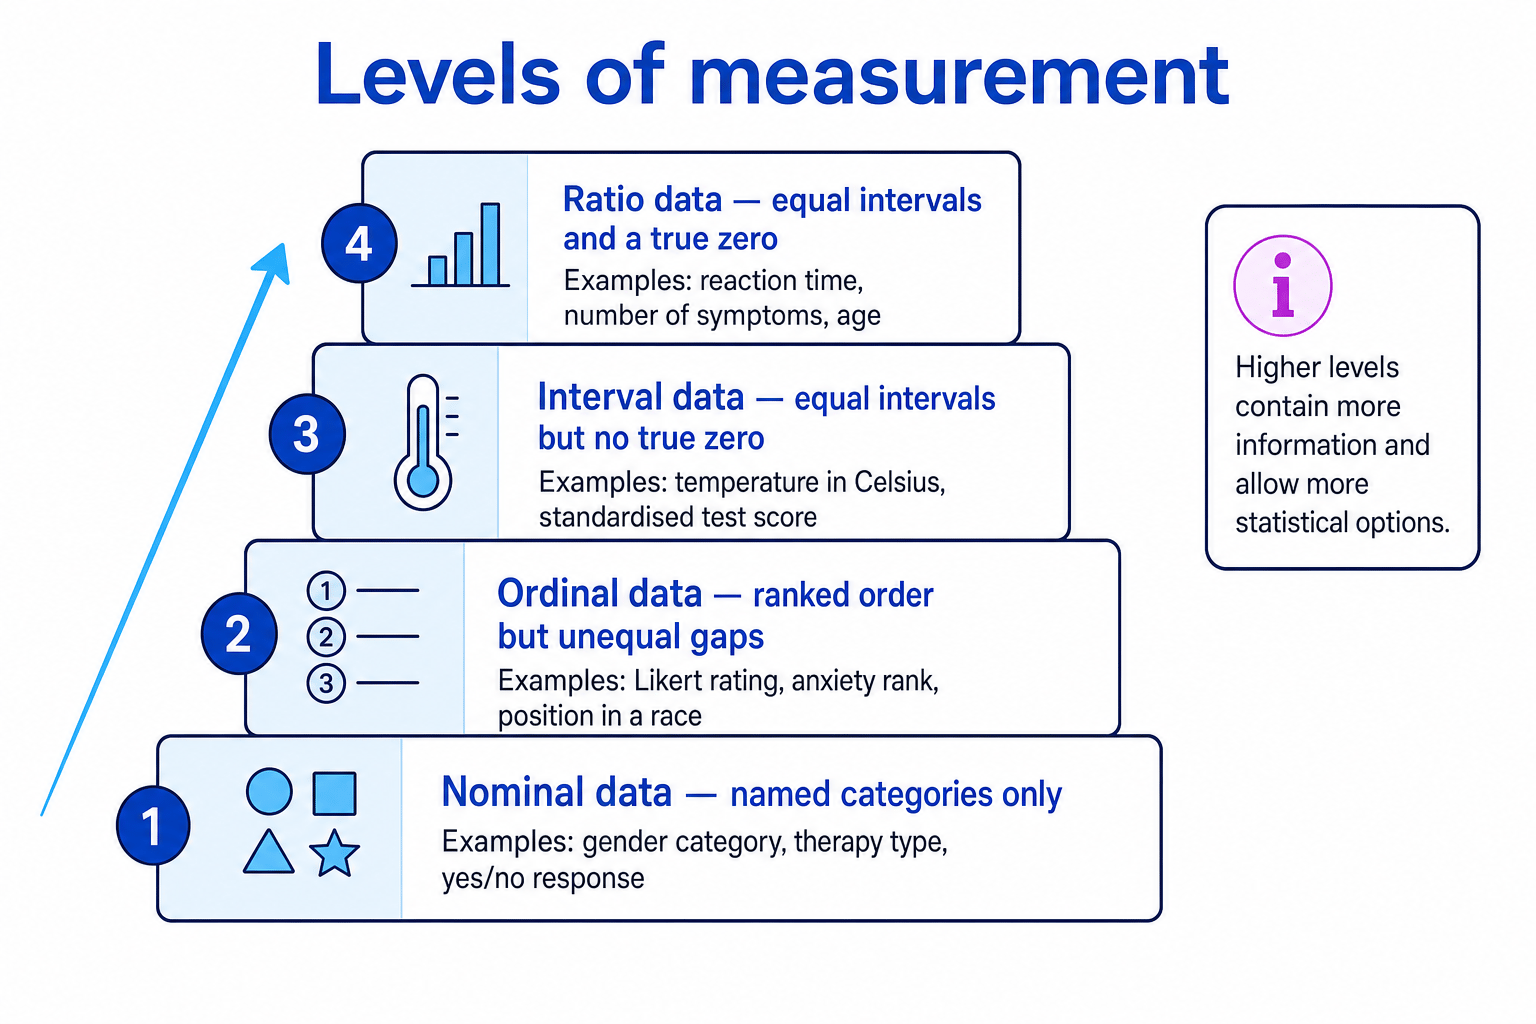
The levels are often shown as a ladder: as you move upwards, the data usually contain more information.
The big rule
Use the highest level of measurement that is genuinely justified by the data, but do not pretend your data are more precise than they really are.
Nominal data: categories with names
Nominal data
Nominal data are data in separate named categories, with no meaningful order between the categories.
“Nominal” comes from the idea of names. The categories are different, but they are not ranked.
Examples in psychology include:
- Therapy type: cognitive behavioural therapy, drug therapy, no treatment.
- Response category: yes or no.
- Attachment type: secure, insecure-avoidant, insecure-resistant.
- Whether a participant helped or did not help in a prosocial behaviour study.
You can count how many people fall into each category, so nominal data are often summarised using frequencies or percentages.
For graphs, you would usually use a bar chart, because the categories are separate rather than continuous.
Nominal data and inferential tests
For Eduqas Component 2, nominal data commonly connect to:
- Chi-square test: used for an association or difference between frequencies in categories.
- Binomial sign test: used for related data where the outcome is simply a sign, direction or category, such as improvement versus deterioration.
Identifying nominal data
A researcher records whether each participant chooses to sit near or far away from a person described as “stressed”.
- The recorded outcome has two categories: “near” and “far”.
- The categories are names only; “near” is not a higher score than “far” in a numerical sense.
- The researcher could count the frequency in each category, so the data are nominal.
Turning labels into fake numbers
If you code “male = 1” and “female = 2”, the numbers are just labels. They do not make the data ordinal or interval, because 2 is not “more” than 1 in a meaningful psychological sense.
Ordinal data: ordered, but uneven
Ordinal data
Ordinal data are data that can be placed in rank order, but the gaps between the values are not known to be equal.
Ordinal data tell you about position. They tell you that one score is higher, lower, better, worse, more anxious or less anxious than another — but not exactly how much higher or lower.
Examples include:
- Ranking participants from most to least aggressive.
- Finishing position in a memory task: first, second, third.
- A Likert-type rating such as strongly disagree to strongly agree.
- Self-rated stress on a scale from 1 to 5.
A median is often appropriate because it identifies the middle value without assuming equal gaps. A range can be used, although it is a fairly crude measure of dispersion.
Likert scales are usually ordinal
A Likert scale is a rating scale where participants choose between ordered response options, such as “strongly disagree”, “disagree”, “neutral”, “agree” and “strongly agree”.
The categories are ordered, but the psychological gap between “agree” and “strongly agree” may not be the same as the gap between “neutral” and “agree”. So, for A-Level exam purposes, treat single Likert items as ordinal unless the question gives you a strong reason not to.
Classifying a stress rating scale
A study asks participants to rate stress from 1 to 10 after completing a maths task.
- A score of 8 indicates more reported stress than a score of 4, so the values are ordered.
- However, the difference between 2 and 3 may not feel psychologically equal to the difference between 8 and 9.
- Because the order is meaningful but equal intervals are not guaranteed, the data are best treated as ordinal.
Ordinal data and inferential tests
Ordinal data often lead to non-parametric tests, which make fewer assumptions about the distribution of scores.
For Eduqas, common links are:
- Mann-Whitney U test: ordinal data, difference between two unrelated groups.
- Wilcoxon signed-ranks test: ordinal data, difference between two related conditions.
- Spearman’s rho: ordinal data, correlation between two co-variables.
- Binomial sign test: related nominal data, often when only direction of change is analysed.
Ranks usually mean ordinal
If the data are positions, ranks or ratings, your first thought should be ordinal. Then check whether the question gives evidence of equal intervals.
Interval data: equal intervals, no true zero
Interval data
Interval data are numerical data with equal intervals between values, but without a true zero point.
Equal intervals mean the difference between 10 and 20 is the same size as the difference between 40 and 50. However, there is no genuine zero meaning “none of the thing exists”.
A classic example is temperature in Celsius. Zero degrees Celsius does not mean “no temperature”. In psychology, some standardised test scores are treated as interval because the scale has equal units, even though zero may not mean total absence of the ability or trait.
With interval data, researchers can often calculate:
- Mean: the arithmetic average.
- Standard deviation: a measure of how spread out scores are around the mean.
- Line graphs or histograms, depending on the design and how the data are grouped.
Recognising interval data
A cognitive psychologist uses a standardised memory test where scores are scaled so that each 10-point increase represents the same increase in test performance.
- The scores are numerical and ordered, because higher scores represent better memory performance.
- The scale is designed so equal point differences represent equal performance differences.
- If zero does not mean “no memory ability at all”, the data are best described as interval rather than ratio.
Ratio data: equal intervals and a true zero
Ratio data
Ratio data are numerical data with equal intervals and a true zero, where zero means a complete absence of the measured quantity.
Ratio data allow the strongest mathematical comparisons. If one participant takes 10 seconds and another takes 20 seconds, it is meaningful to say the second took twice as long.
Examples in psychology include:
- Reaction time in seconds.
- Number of words recalled.
- Number of aggressive acts observed.
- Age.
- Time spent looking at a stimulus.
Ratio data are very common in experimental research because psychologists often measure time, frequency or countable behaviour.
Recognising ratio data
A researcher records how many symptoms of anxiety each participant reports on a checklist.
- The values are numerical counts: 0, 1, 2, 3 and so on.
- The gap between 1 and 2 symptoms is the same size as the gap between 6 and 7 symptoms.
- A score of 0 means no symptoms were reported, so there is a true zero. The data are ratio.
Eduqas test-choice wording
Eduqas often groups interval and ratio data together when choosing parametric tests, because both have equal intervals. Still, if asked to define the levels separately, remember: ratio has a true zero; interval does not.
How levels affect descriptive statistics
A descriptive statistic summarises a set of data. Your choice should fit the measurement level.
For nominal data, use:
- Frequency.
- Percentage.
- Mode, if useful.
For ordinal data, use:
- Median.
- Range.
- Sometimes mode.
For interval or ratio data, use:
- Mean.
- Median, if the data are skewed or have outliers.
- Range.
- Standard deviation.
Standard deviation
The standard deviation is a measure of dispersion showing how much scores typically vary around the mean.
Calculating a mean from categories
Do not calculate a mean for nominal categories. A “mean therapy type” or “average gender category” is meaningless, even if the categories have been coded as numbers.
How levels affect inferential tests
An inferential test helps decide whether a pattern in sample data is likely to reflect a real effect or could reasonably be due to chance.
In Eduqas, choosing the correct test usually depends on three questions:
- Are you testing a difference, an association, or a correlation?
- Is the design related or unrelated?
- What is the level of measurement?
Key test choices
For differences between two unrelated groups:
- Use Mann-Whitney U for ordinal data.
- Use an unrelated t-test for interval or ratio data.
For differences between two related conditions:
- Use Wilcoxon signed-ranks for ordinal data.
- Use a related t-test for interval or ratio data.
- Use the binomial sign test if you only record direction of change, such as improved or not improved.
For correlations:
- Use Spearman’s rho for ordinal data or ranked data.
- A Pearson test may be used for interval or ratio data in some courses, but focus on the tests named by Eduqas.
For associations between categories:
- Use chi-square with nominal frequency data.
Choosing an inferential test
A researcher compares anxiety ratings from two separate groups: one group practises mindfulness and another group does not. Anxiety is rated on a 1 to 10 scale.
- The researcher is testing a difference because the aim is to compare two groups.
- The groups are unrelated because different participants are in the mindfulness and no-mindfulness conditions.
- The anxiety rating is best treated as ordinal because it is a rating scale and equal psychological intervals are not guaranteed.
- The suitable test is therefore Mann-Whitney U.
Significance, critical values and errors
A significance level is the probability level a researcher uses to decide whether a result is statistically significant. In psychology, the default convention is usually p≤0.05p \leq 0.05p≤0.05, meaning there is a 5% or lower probability that the result occurred by chance if the null hypothesis is true.
A critical value is the value from a statistical table that your observed value must reach to be significant. The observed value is the value calculated from your data.
Whether the observed value must be higher or lower than the critical value depends on the test, so always read the table instructions carefully.
A one-tailed test is used when the hypothesis predicts the direction of the effect. A two-tailed test is used when the hypothesis predicts a difference or relationship but not the direction.
Type I and Type II errors
A Type I error is a false positive: rejecting the null hypothesis when it is actually true. A Type II error is a false negative: failing to reject the null hypothesis when there really is an effect.
Measurement level links to this because choosing the wrong test can make your conclusion less valid. For example, treating ordinal rating data as interval may increase the risk of misleading significance decisions.
Applying this to your own practical investigation
In Component 2, you may need to design, conduct or evaluate a practical investigation. Be explicit about your measurement level.
For example:
- If you observe whether participants help or do not help, you have nominal data.
- If participants rank images from most to least stressful, you have ordinal data.
- If you record reaction times, you have ratio data.
- If you use a standardised psychological scale, decide whether the exam scenario treats it as ordinal or interval.
Ethically, your measurement choices should not pressure or mislead participants. Follow the BPS Code of Ethics and Conduct: gain valid consent, avoid unnecessary deception, protect participants from harm, preserve confidentiality, give the right to withdraw and provide a debrief. If collecting sensitive ratings, such as stress, anxiety or mood, take extra care with protection from harm and confidentiality.
AO2 application sentence
A strong application sentence sounds like: “The data would be ordinal because participants give ranked anxiety ratings, so the researcher should avoid assuming equal intervals between scores.”
AO3 evaluation: strengths and limitations
A strength of understanding measurement levels is that it improves internal validity. If the researcher chooses statistics that match the data, their conclusions are more likely to be justified.
Another strength is that it helps make research more replicable. Clearly stating whether data are nominal, ordinal, interval or ratio allows another researcher to repeat the analysis in the same way.
A limitation is that real psychological variables are sometimes messy. Constructs such as intelligence, stress, wellbeing or aggression may be measured using scales that look numerical but are based on subjective judgements. This can create debate about whether the data are truly interval or only ordinal.
There is also a practical trade-off. Ratio data such as reaction times may be precise, but they can miss subjective meaning. Ordinal self-report ratings capture personal experience, but they may be affected by demand characteristics, social desirability or individual differences in how people use scales.
In the exam
- Identify the variable first, then ask whether the data are categories, ranks, equal-interval scores or true-zero measurements.
- Link the level of measurement to the statistic or test: nominal with frequencies and chi-square; ordinal with medians, ranks and non-parametric tests; interval or ratio with means, standard deviations and t-tests.
- For application questions, justify your choice using the scenario rather than just naming the level.
Check yourself
- Why is a single Likert rating usually treated as ordinal rather than interval?
- What is the difference between interval and ratio data?
- Which inferential test would you choose for a difference between two unrelated groups using ordinal data?