What you'll learn
- How to calculate and interpret the mean, median and mode.
- How to calculate and interpret range and standard deviation.
- How to choose suitable tables and graphs for psychological data.
- How to evaluate descriptive statistics in AO2/AO3-style answers.
Why descriptive statistics matter
Psychologists collect data from participants, but raw data are often messy. Descriptive statistics help you summarise the pattern in the data before you make any bigger claims.
Descriptive statistics
Descriptive statistics are numerical or visual summaries of a set of data, such as averages, spread, tables and graphs. They describe what the data look like; they do not prove whether a result is statistically significant.
In Component 2, you may be asked to calculate descriptive statistics, interpret them in a research scenario, or justify why one statistic is more appropriate than another.
The big picture
Descriptive statistics answer questions like: “What is the typical score?” and “How spread out are the scores?” They do not, by themselves, answer: “Is this result significant?”
Before you calculate: data and levels of measurement
A score is one participant’s result on a measured variable, such as a memory score, anxiety rating or number of aggressive acts observed.
A variable is something that can change. In an experiment, the independent variable is manipulated by the researcher, and the dependent variable is measured.
You also need to know the level of measurement, because this affects which descriptive statistics are suitable.
Nominal data
Nominal data are categories with no meaningful order. Examples include therapy type, gender category, or whether a participant did or did not show a behaviour.
The most suitable measure of central tendency is usually the mode, because calculating a mean category would make no sense.
Ordinal data
Ordinal data are ordered, but the gaps between scores may not be equal. For example, a 1–10 stress rating has an order, but the difference between 2 and 3 may not feel exactly the same as the difference between 8 and 9.
The median is often useful for ordinal data.
Interval data
Interval data use numerical scales where the gaps between values are treated as equal. Examples include number of words recalled, number of errors, or a score on a standardised questionnaire.
The mean and standard deviation are often appropriate if the data are not badly skewed.
Classifying levels of measurement
-
If participants are placed into “CBT”, “drug therapy” or “no treatment” groups, the data are nominal because these are named categories with no natural rank order.
-
If participants rate their mood from 1 to 7, the data are ordinal because higher numbers mean more of something, but the psychological distance between points is not guaranteed to be equal.
-
If participants recall 4, 8 or 12 words from a list, the data can be treated as interval because the numerical differences are meaningful: recalling 8 words is 4 more than recalling 4 words.
Measures of central tendency
A measure of central tendency tells you the typical, central or average score in a dataset.
The three main measures are:
- Mean
- Median
- Mode
The mean
The mean is the arithmetic average. Add up all the scores, then divide by the number of scores.
Mean formula
The mean is calculated using:
xˉ=∑xn\bar{x} = \frac{\sum x}{n}xˉ=n∑xwhere xˉ\bar{x}xˉ is the mean, ∑x\sum x∑x means the total of all scores, and nnn is the number of scores.
The mean is useful because it uses every score in the dataset. However, it can be distorted by outliers, which are unusually high or low scores.
Calculating the mean
A memory study produces these recall scores: 6, 7, 7, 8, 12.
-
Add the scores together: 6+7+7+8+12=406 + 7 + 7 + 8 + 12 = 406+7+7+8+12=40.
-
Divide by the number of scores: 405=8\frac{40}{5} = 8540=8.
-
Interpret the result in context: the mean recall score is 8 words, but the score of 12 pulls the mean upwards, so it may make the group look slightly better than most participants actually were.
The median
The median is the middle score when all scores are placed in order.
If there is an odd number of scores, the median is the middle one. If there is an even number of scores, the median is halfway between the two middle scores.
The median is less affected by outliers than the mean, so it is useful for skewed data.
The mode
The mode is the most frequently occurring score or category.
It is especially useful for nominal data, such as the most common diagnosis, attachment style or therapy choice.
Finding the median and mode
Using the scores 6, 7, 7, 8, 12:
-
Put the scores in order. They are already ordered: 6, 7, 7, 8, 12.
-
Find the middle score. There are five scores, so the third score is the median: 7.
-
Identify the most frequent score. The score 7 appears twice, more than any other score, so the mode is 7.
Forgetting to order the data
The median must be found after putting scores in numerical order. If you use the original order in which participants were tested, you may choose the wrong middle value.
Choosing between mean, median and mode
A distribution is the pattern of scores in a dataset. Some distributions are symmetrical, while others are skewed, meaning the scores are pulled out into a longer tail on one side.
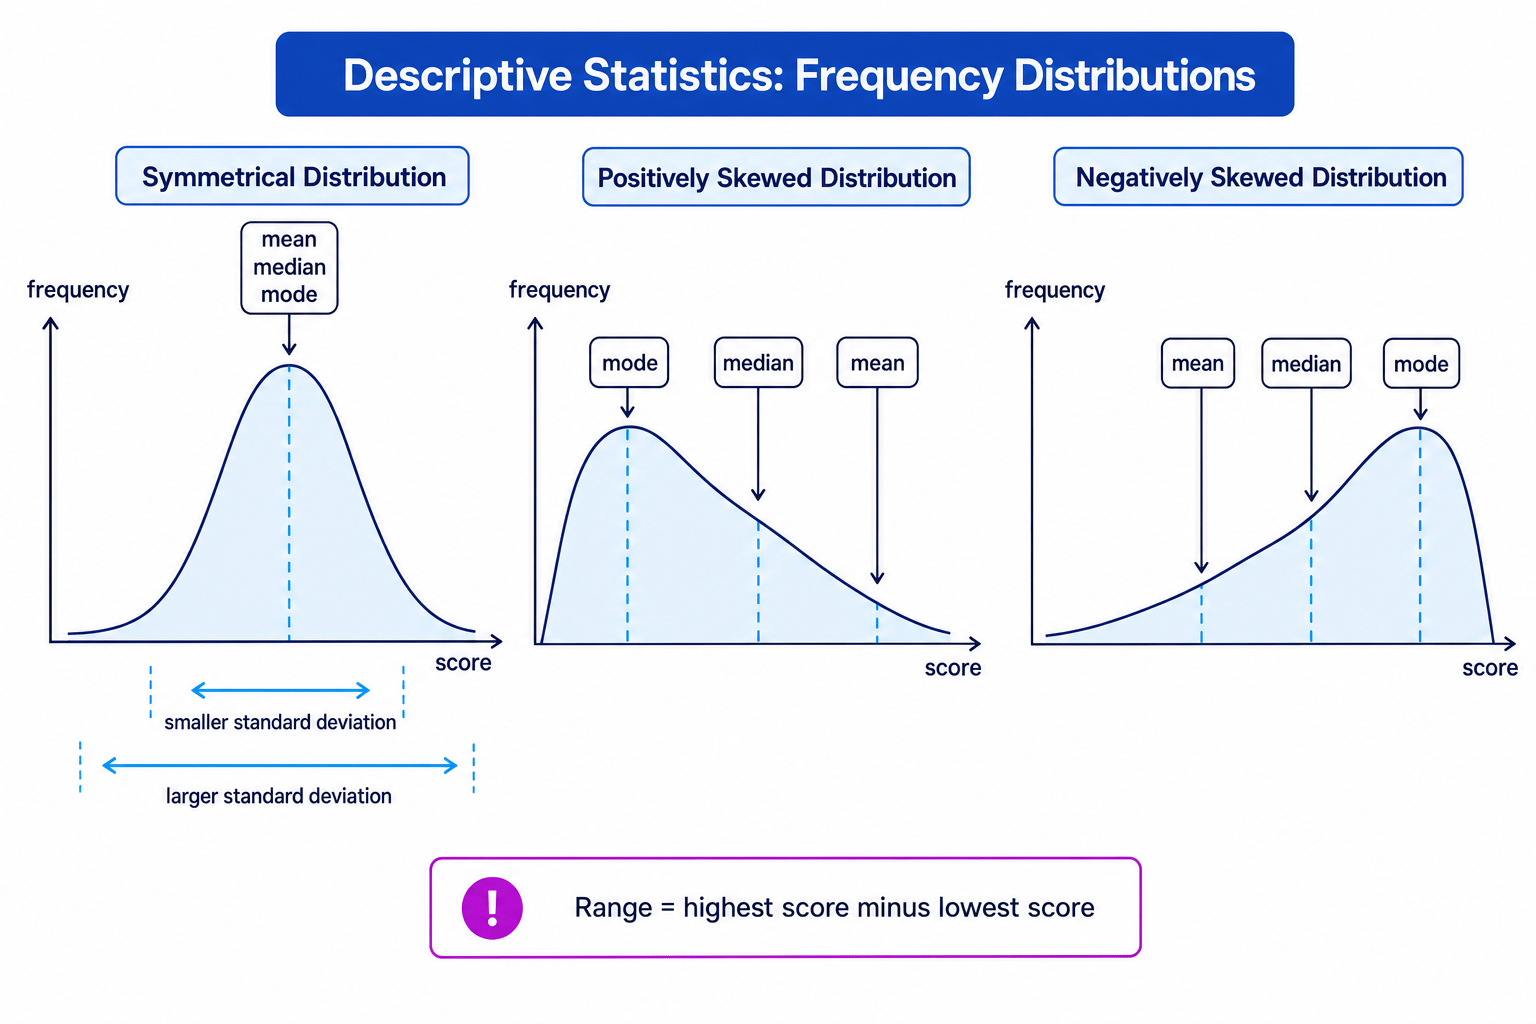
Use this as a quick guide:
- Use the mean for interval data when there are no extreme outliers.
- Use the median when data are ordinal or skewed.
- Use the mode for nominal categories or when you want the most common score.
Mean follows the tail
In a skewed distribution, the mean is pulled towards the extreme scores. If a few participants score unusually high or low, the median may give a fairer picture of the typical participant.
Measures of dispersion
A measure of dispersion tells you how spread out the scores are.
Two groups can have the same mean but very different spreads. For example, one class might all score close to 15, while another has scores ranging from 3 to 27. The average alone would hide that difference.
The range
The range is the simplest measure of dispersion.
Range
The range is calculated as:
range=highest score−lowest score\text{range} = \text{highest score} - \text{lowest score}range=highest score−lowest scoreThe range is quick and easy, but it only uses two scores, so it can be badly affected by outliers.
Standard deviation
The standard deviation is a measure of how far scores typically spread around the mean.
A small standard deviation means scores are clustered close to the mean. A large standard deviation means scores are more spread out.
Standard deviation formula
For a sample, standard deviation can be calculated using:
s=∑(x−xˉ)2n−1s = \sqrt{\frac{\sum (x - \bar{x})^2}{n - 1}}s=n−1∑(x−xˉ)2where sss is the sample standard deviation, xxx is each individual score, xˉ\bar{x}xˉ is the mean, and nnn is the number of scores.
The formula uses n−1n - 1n−1 because A-Level Psychology usually treats your data as a sample from a wider population, not the whole population.
Calculating standard deviation
A researcher records five questionnaire scores: 4, 5, 6, 6, 9.
-
Calculate the mean: 4+5+6+6+95=6\frac{4 + 5 + 6 + 6 + 9}{5} = 654+5+6+6+9=6.
-
Subtract the mean from each score and square the result: (4−6)2=4(4 - 6)^2 = 4(4−6)2=4, (5−6)2=1(5 - 6)^2 = 1(5−6)2=1, (6−6)2=0(6 - 6)^2 = 0(6−6)2=0, (6−6)2=0(6 - 6)^2 = 0(6−6)2=0, and (9−6)2=9(9 - 6)^2 = 9(9−6)2=9.
-
Add the squared deviations and divide by n−1n - 1n−1: 4+1+0+0+95−1=144=3.5\frac{4 + 1 + 0 + 0 + 9}{5 - 1} = \frac{14}{4} = 3.55−14+1+0+0+9=414=3.5.
-
Take the square root: s=3.5≈1.87s = \sqrt{3.5} \approx 1.87s=3.5≈1.87. The standard deviation is about 1.87, meaning scores typically vary by roughly 1.87 points from the mean.
Treating standard deviation like a score
Standard deviation is not another participant’s score. It summarises spread around the mean. It also cannot be negative, because it is based on squared deviations and a square root.
Tables and standard graphs
Descriptive statistics are often presented visually.
A frequency table shows how often each score or category occurs. It is useful when scores repeat.
Common graphs in Psychology include:
- Bar chart: used for separate categories or conditions. Bars usually have gaps.
- Histogram: used for continuous numerical data grouped into intervals. Bars touch because the scale is continuous.
- Scattergram: used for correlations, where each point represents one participant’s pair of scores.
- Line graph: useful when scores are measured across ordered time points.
- Pie chart: shows proportions or percentages of categories, though it is less useful for detailed statistical comparison.
Choosing a graph and summary statistic
A researcher compares the number of words recalled by participants in a silent condition and a noisy condition.
-
The dependent variable is number of words recalled, which can be treated as interval data, so the researcher can calculate the mean for each condition.
-
The researcher should also calculate a measure of dispersion, such as standard deviation, to show whether scores were consistent within each condition.
-
A bar chart would be suitable for displaying the two condition means because the independent variable has separate categories: silent and noisy.
Estimating from grouped data
Sometimes data are grouped into intervals, so you no longer know each exact raw score. In that case, you can estimate using the midpoint of each interval.
Midpoint
The midpoint is the value halfway between the lower and upper boundary of a grouped interval.
Estimating a mean from grouped scores
A questionnaire score distribution is grouped as follows: 0–4 has 2 participants, 5–9 has 5 participants, and 10–14 has 3 participants.
-
Find the midpoint of each interval: 0–4 has midpoint 2, 5–9 has midpoint 7, and 10–14 has midpoint 12.
-
Multiply each midpoint by its frequency: 2⋅2=42 \cdot 2 = 42⋅2=4, 7⋅5=357 \cdot 5 = 357⋅5=35, and 12⋅3=3612 \cdot 3 = 3612⋅3=36.
-
Add these estimated totals and divide by the total number of participants: 4+35+3610=7.5\frac{4 + 35 + 36}{10} = 7.5104+35+36=7.5.
-
Interpret carefully: the estimated mean is 7.5, but it is only an estimate because the exact individual scores are unknown.
Interpreting descriptive statistics in psychology
When interpreting descriptive statistics, always connect the number back to the study.
For example, if the noisy condition has a lower mean recall score than the silent condition, this suggests participants remembered fewer words in noise. If the noisy condition also has a larger standard deviation, this suggests participants’ recall scores were less consistent in that condition.
Use the words “suggests” and “indicates”
Descriptive statistics should be interpreted cautiously. They can suggest a pattern, but they do not prove that the independent variable caused the difference.
AO3: evaluating descriptive statistics
Strengths
Descriptive statistics make large amounts of data easier to understand. Means, medians, ranges and standard deviations allow researchers to compare conditions quickly.
They are also useful for communication. A graph can make a pattern clear to readers who would struggle to interpret a full raw data set.
Weaknesses
Descriptive statistics can hide individual differences. Two groups may have the same mean but very different standard deviations.
The mean can be distorted by outliers. The range is also very sensitive to extreme scores because it only uses the highest and lowest values.
Standard deviation is powerful, but it is most meaningful when the mean is an appropriate average. If the data are highly skewed or ordinal, the median and interquartile range may be more suitable, although the Eduqas spec specifically requires range and standard deviation.
Ethics when presenting data
Even descriptive statistics involve ethical responsibilities. Under the BPS Code of Ethics and Conduct, researchers should protect participants’ confidentiality and avoid presenting data in a way that makes individuals identifiable.
For example, if only one participant in a school sample has an extreme anxiety score, a researcher should not publish enough detail for others to work out who that participant is. Consent, right to withdraw, protection from harm, confidentiality and debrief still matter when data are analysed and reported.
Descriptive statistics are not inferential tests
Do not confuse descriptive statistics with inferential statistics, which test whether results are likely to be due to chance.
Later in Component 2, you choose inferential tests using criteria such as research design and level of measurement. For example, Spearman’s rho is used for correlations, chi-square for nominal data, the sign test for related nominal data, Mann-Whitney U for unrelated non-parametric data, Wilcoxon signed-ranks for related non-parametric data, and related or unrelated t-tests for interval data that meet parametric assumptions.
Inferential testing involves observed values, critical values, one-tailed or two-tailed hypotheses, and significance conventions such as p≤0.05p \le 0.05p≤0.05. Descriptive statistics do not involve Type I or Type II errors because they are not significance tests.
In the exam
-
Name the statistic, define it briefly, and then apply it directly to the scenario or data given.
-
Justify your choice: mention the level of measurement, whether the data are skewed, and whether outliers might affect the result.
-
Interpret in context: say what the mean, median, range or standard deviation suggests about the participants’ behaviour, but avoid claiming significance unless an inferential test has been carried out.
Check yourself
-
When would the median be a better measure of central tendency than the mean?
-
What does a large standard deviation tell you about participants’ scores?
-
Which graph would you use to show mean recall scores in two experimental conditions, and why?
