What you'll learn
- How inferential statistics help psychologists decide whether results are significant.
- How to choose between tests such as Chi-square, Mann-Whitney U, Wilcoxon, Spearman’s rho and the sign test.
- How to interpret probability values, significance levels, observed values and critical values.
- How to avoid common exam mistakes with one-tailed/two-tailed tests and Type I/Type II errors.
Why inferential statistics matter
In Component 2, you are not just describing data — you are deciding what the data mean. A difference between two conditions, or a correlation between two variables, might look interesting, but it could have happened by chance.
Inferential statistics
Inferential statistics are statistical tests used to decide whether a pattern in sample data is likely to reflect a real effect in the wider population, rather than random chance.
Descriptive statistics summarise data. These include measures of central tendency such as the mean, median and mode, and measures of dispersion such as the range and standard deviation. Graphs such as bar charts, scattergraphs, histograms and tables help you see patterns. Inferential statistics go further: they test whether the pattern is statistically meaningful.
The big idea
Inferential statistics help you decide whether to reject the null hypothesis or fail to reject the null hypothesis.
Hypotheses: the starting point
A hypothesis is a testable prediction.
Null and alternative hypotheses
The null hypothesis predicts no significant difference, relationship or association. The alternative hypothesis predicts that there will be a significant difference, relationship or association.
For example, in a memory experiment inspired by Loftus and Palmer (1974), the null hypothesis might state that the verb used in a leading question has no significant effect on estimated speed. The alternative hypothesis might state that the verb does affect estimated speed.
One-tailed and two-tailed tests
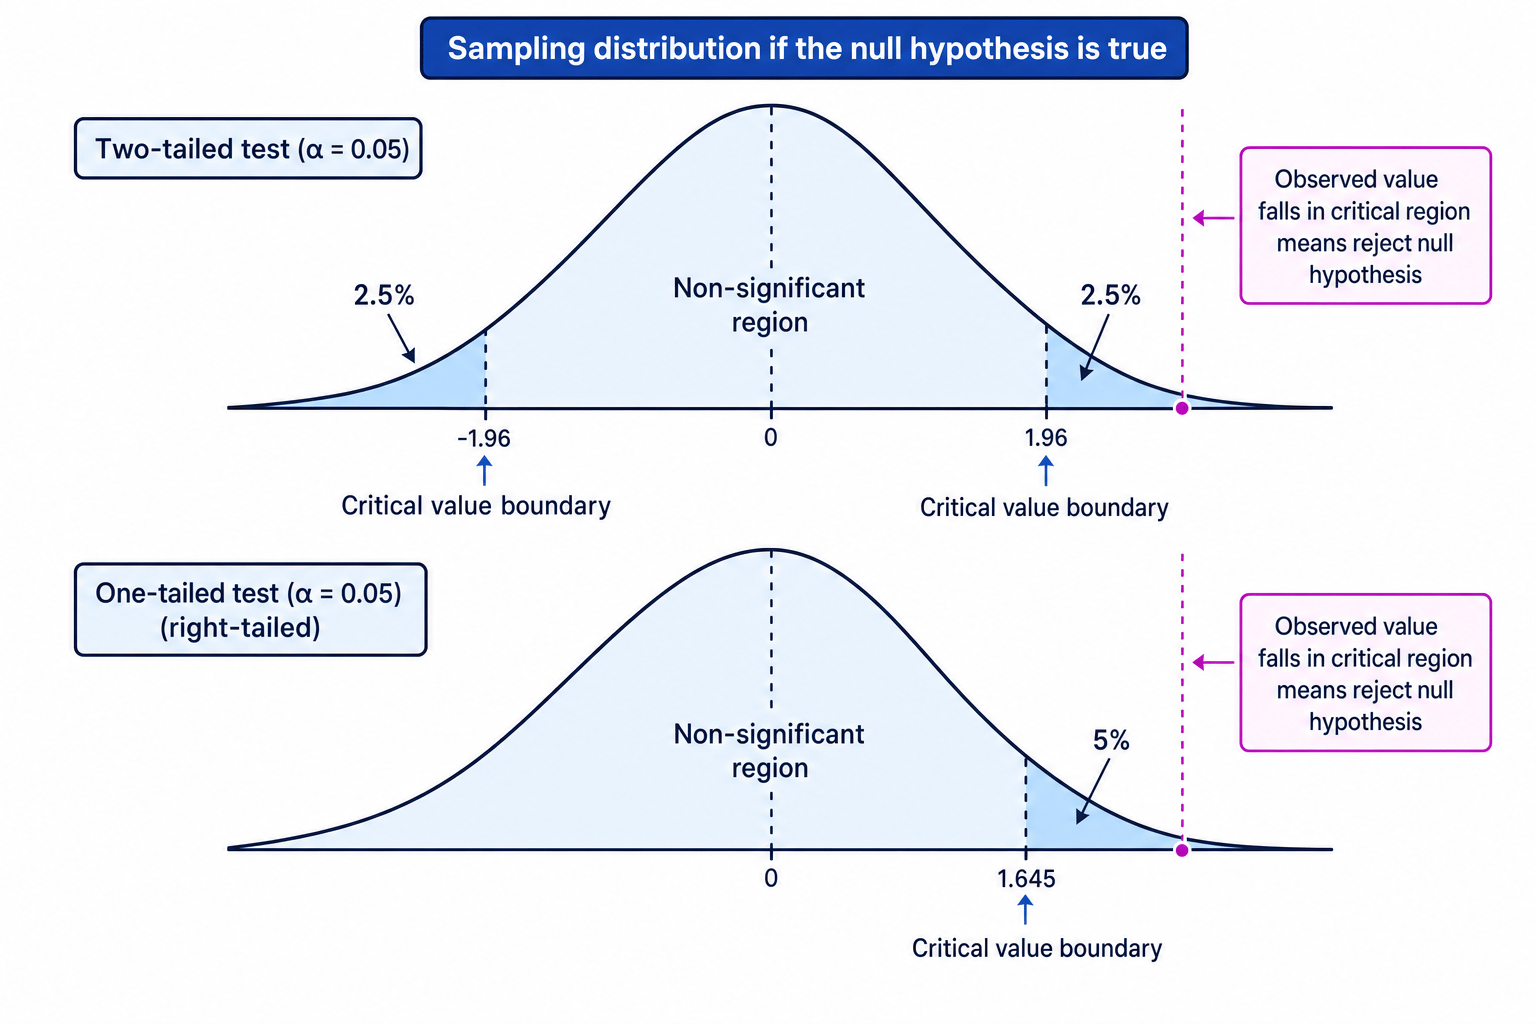
A one-tailed test is used when the alternative hypothesis is directional. It predicts the direction of the effect, such as “Group A will score higher than Group B”.
A two-tailed test is used when the alternative hypothesis is non-directional. It predicts an effect but not its direction, such as “There will be a difference between Group A and Group B”.
Changing the tail after seeing the results
You must decide whether a test is one-tailed or two-tailed from the hypothesis before looking at the results. Do not switch to one-tailed just because it makes the finding significant.
Probability values and significance levels
Probability value
A probability value, written as ppp, tells you how likely it is that the observed result would occur if the null hypothesis were true.
In psychology, the usual significance level is 5%. This is written as α=0.05\alpha = 0.05α=0.05 or p≤0.05p \leq 0.05p≤0.05.
That means researchers are willing to accept a 5% risk of saying there is a significant effect when the result may actually be due to chance.
Significance level
A significance level is the cut-off point used to decide whether a result is statistically significant. In A-Level Psychology, the default convention is usually p≤0.05p \leq 0.05p≤0.05.
If the result is significant, you reject the null hypothesis. If it is not significant, you fail to reject the null hypothesis. You do not “prove” the null hypothesis is true.
Type I and Type II errors
A Type I error happens when you reject the null hypothesis even though it is actually true. This is a false positive.
A Type II error happens when you fail to reject the null hypothesis even though the alternative hypothesis is actually true. This is a false negative.
Remembering the errors
Type I error: you think there is an effect, but there isn’t.
Type II error: you think there is no effect, but there is.
Observed values and critical values
Observed and critical values
The observed value is the value calculated from your data. The critical value is the cut-off value found in a statistical table.
To decide whether a result is significant, compare the observed value with the critical value. The rule depends on the test.
For some tests, the observed value must be greater than or equal to the critical value. This usually applies to Chi-square, Spearman’s rho and t-tests.
For other tests, the observed value must be less than or equal to the critical value. This usually applies to Mann-Whitney U, Wilcoxon signed-ranks and the sign test.
The symbols matter:
- === means equal to
- ≤\leq≤ means less than or equal to
- <<< means less than
- >>> means greater than
- ≥\geq≥ means greater than or equal to
Interpreting a critical value comparison
A researcher calculates Spearman’s rank order correlation coefficient and gets an observed value of rs=0.62r_s = 0.62rs=0.62. The critical value at p≤0.05p \leq 0.05p≤0.05 is 0.45.
- Identify the test rule: for Spearman’s rho, the observed value must usually be at least as large as the critical value.
- Compare the values: 0.62≥0.450.62 \geq 0.450.62≥0.45, so the observed value reaches the critical value.
- Interpret the decision: the correlation is significant at p≤0.05p \leq 0.05p≤0.05, so the researcher rejects the null hypothesis.
Using the wrong inequality
Do not assume “bigger is always better”. For Mann-Whitney U, Wilcoxon and the sign test, a smaller observed value can indicate significance.
Levels of measurement
Before choosing a test, identify the level of measurement of your data.
Levels of measurement
Nominal data are categories or frequencies. Ordinal data are ordered or ranked data. Interval data use numerical scales with equal intervals between points.
Examples:
- Nominal: aggressive/not aggressive, pass/fail, yes/no.
- Ordinal: rank order, Likert scale ratings, severity scores.
- Interval: reaction time, test score, estimated speed.
In psychology, interval and ratio data are often grouped together for test-choice purposes, especially when deciding between parametric tests such as t-tests and non-parametric alternatives.
Identifying the level of measurement
A researcher asks participants to rate their anxiety on a scale from 1 to 10 before and after a relaxation task.
- Decide whether the data are categories, ranks or equal-interval scores: the anxiety ratings are ordered numerical ratings.
- Consider whether the distances between points are definitely equal: with rating scales, this is often treated cautiously.
- Classify the data for test choice: this would usually be treated as ordinal data, making Wilcoxon appropriate if the same participants are tested twice.
Choosing the correct inferential test
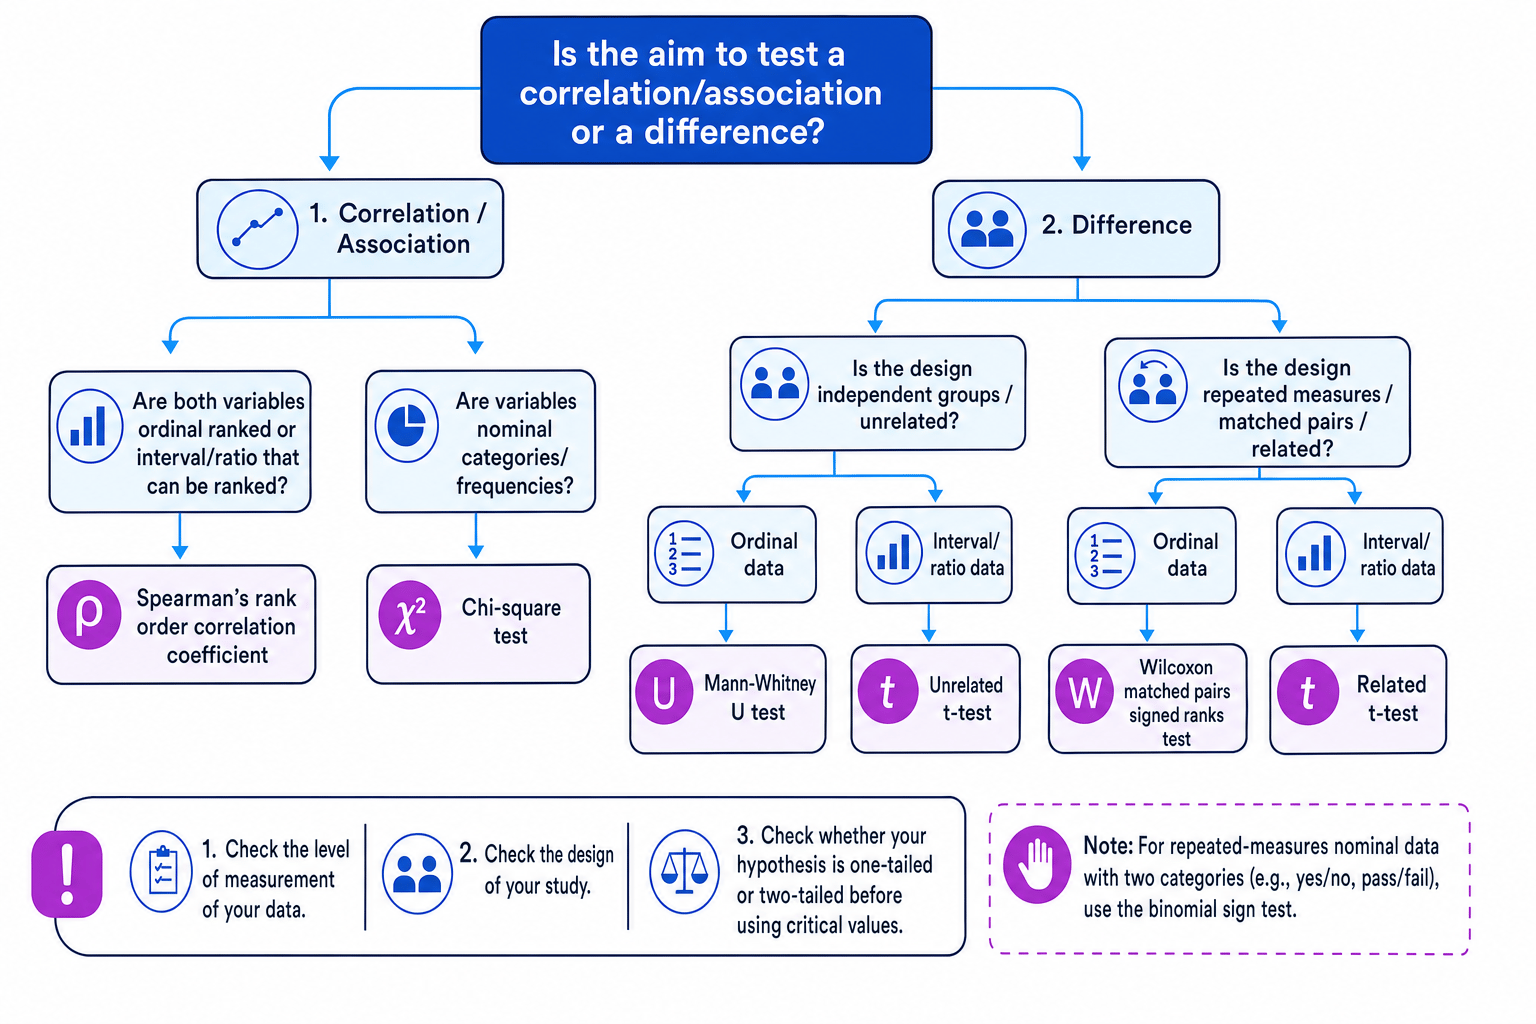
To choose a test, ask three questions:
- Are you testing a difference, a correlation, or an association?
- What is the experimental design: independent groups, repeated measures, or matched pairs?
- What is the level of measurement: nominal, ordinal, or interval?
Key tests you need to know
| Test | Used for | Typical data/design |
|---|---|---|
| Chi-square test | Association or difference between categories | Nominal data/frequencies |
| Mann-Whitney U test | Difference between two unrelated groups | Ordinal data |
| Wilcoxon matched pairs signed-ranks test | Difference between two related conditions | Ordinal data |
| Sign test | Difference between related pairs when data are in two categories or directions | Nominal data |
| Spearman’s rank order correlation coefficient | Correlation between two variables | Ordinal or ranked data |
| Unrelated t-test | Difference between two unrelated groups | Interval data |
| Related t-test | Difference between two related conditions | Interval data |
Choosing the correct test
A psychologist compares the number of aggressive acts shown by children who watched an aggressive model and children who watched a non-aggressive model, similar to Bandura, Ross and Ross (1961). The groups are different children and the aggression scores are ranked.
- Identify the aim: the researcher is testing a difference between two conditions.
- Identify the design: the children are in separate groups, so this is an independent groups design.
- Identify the data level: ranked aggression scores are ordinal.
- Select the test: the correct test is the Mann-Whitney U test.
The named tests in more detail
Chi-square test
The Chi-square test is used with nominal data, usually frequencies in categories. It checks whether observed frequencies differ significantly from expected frequencies.
The formula is:
χ2=∑(O−E)2E\chi^2 = \sum \frac{(O - E)^2}{E}χ2=∑E(O−E)2Here, OOO means observed frequency and EEE means expected frequency.
For Chi-square, you also need degrees of freedom, often written as df. For a contingency table:
df=(r−1)(c−1)\text{df} = (r - 1)(c - 1)df=(r−1)(c−1)where rrr is the number of rows and ccc is the number of columns.
Mann-Whitney U test
The Mann-Whitney U test compares two unrelated groups using ordinal data. It ranks all scores together, then looks at whether the ranks are distributed differently between the two groups.
Use it for independent groups when the data are not suitable for an unrelated t-test.
Wilcoxon matched pairs signed-ranks test
The Wilcoxon matched pairs signed-ranks test compares two related conditions using ordinal data. It considers both the direction and size of differences between paired scores.
Use it for repeated measures or matched pairs when the data are ordinal.
Sign test
The sign test is used with related data when you only consider the direction of change: positive, negative or no change. Ties are ignored.
Calculating a sign test decision
Eight participants complete an anxiety score before and after relaxation training. Lower after-scores mean improvement. Seven participants improve and one gets worse. The critical value for a one-tailed sign test with 8 usable pairs at p≤0.05p \leq 0.05p≤0.05 is 1.
- Count the signs: there are 7 improvements and 1 worsening.
- Find the observed value: for the sign test, use the less frequent sign, so S=1S = 1S=1.
- Compare with the critical value: for the sign test, significance is found when S≤CS \leq CS≤C, so 1≤11 \leq 11≤1.
- Interpret the result: the improvement is significant at p≤0.05p \leq 0.05p≤0.05, so the null hypothesis is rejected.
Spearman’s rank order correlation coefficient
Spearman’s rho tests whether there is a significant correlation between two variables measured at ordinal level or converted into ranks.
If you calculate it, the formula is often written as:
rs=1−6∑d2n(n2−1)r_s = 1 - \frac{6\sum d^2}{n(n^2 - 1)}rs=1−n(n2−1)6∑d2Here, ddd is the difference between paired ranks and nnn is the number of pairs.
A positive correlation means both variables tend to increase together. A negative correlation means one variable tends to increase as the other decreases.
AO1, AO2 and AO3: how this becomes exam-worthy
AO1: describe accurately
For AO1, define the test or concept precisely. For example, state that Mann-Whitney U is used to test a difference between two unrelated groups using ordinal data.
AO2: apply to a scenario
For AO2, link your choice directly to the scenario. Mention the aim, design and data level. You might apply inferential statistics to familiar studies such as Loftus and Palmer (1974) on leading questions, Bandura, Ross and Ross (1961) on social learning, or Raine et al. (1997) on brain activity in murderers pleading not guilty by reason of insanity.
AO3: evaluate carefully
Inferential statistics improve objectivity because they provide a clear decision rule. However, they do not fix poor methodology. A significant result from a biased sample, invalid measure or uncontrolled procedure may still be misleading.
Ethics also matter. In your practical investigation, follow the BPS Code of Ethics and Conduct: informed consent, avoidance of unnecessary deception, right to withdraw, protection from harm, confidentiality and debriefing. If animal research is ever discussed, additional considerations include welfare, humane treatment and whether the scientific value justifies the cost.
Significant does not mean important
A statistically significant result is not automatically a large, useful or ethical finding. It only means the result is unlikely to have occurred by chance at the chosen significance level.
In the exam
- Identify the aim, design and data level before naming a test.
- State the correct comparison rule: some tests need the observed value to be greater than or equal to the critical value, while others need it to be less than or equal to the critical value.
- Use cautious wording: say “reject” or “fail to reject” the null hypothesis, not “prove” or “accept” it.
Check yourself
- When would you use Spearman’s rho rather than Chi-square?
- Why does a one-tailed test need a directional hypothesis?
- For which tests does a smaller observed value usually indicate significance?
