What you'll learn
- How psychologists collect data using experiments, observations, questionnaires, interviews and other methods.
- How to design research using samples, hypotheses, variables and controls.
- How to summarise data with descriptive statistics and choose the correct inferential test.
- How to evaluate research using validity, reliability, ethics and published-research conventions.
The big idea: turning questions into evidence
Psychological methods are the tools researchers use to turn a question about behaviour into evidence. A good methods answer usually needs:
- AO1: accurate description of the method, design or statistic.
- AO2: application to a scenario, study or practical investigation.
- AO3: evaluation of strengths, weaknesses, ethics and usefulness.
For example, Baddeley (1966) used controlled memory experiments, Bartlett (1932) used repeated reproduction of stories, Sherif et al. (1954/1961) used a field study at Robbers Cave, and Burger (2009) used a carefully controlled partial replication of Milgram’s obedience research.
Variables and operationalisation
A variable is anything that can change or vary. In an experiment, the independent variable (IV) is what the researcher changes, and the dependent variable (DV) is what the researcher measures. Operationalisation means defining variables clearly enough to measure or replicate them, such as measuring “memory” as “number of words correctly recalled from a list of 20”.
Types of data
Qualitative and quantitative data
Qualitative data is non-numerical data, such as interview answers, diary entries or observation notes. It is rich and detailed but harder to summarise objectively.
Quantitative data is numerical data, such as reaction times, test scores or frequency counts. It is easier to analyse statistically but may lose depth.
Primary and secondary data
Primary data is collected first-hand by the researcher for their current study. Secondary data already exists, such as published statistics, historical records or previous studies used in a meta-analysis.
Data choice
Quantitative data is useful for testing patterns statistically; qualitative data is useful for understanding meanings, experiences and context.
Sampling techniques
A target population is the group the researcher wants to generalise to. A sample is the smaller group actually studied.
- Random sampling: everyone in the target population has an equal chance of selection. It can reduce bias, but you need a full sampling frame.
- Stratified sampling: the sample reflects key subgroups in the population, such as gender or year group, in the correct proportions. It is representative but time-consuming.
- Volunteer sampling: participants opt in, often after an advert. It is practical but may produce volunteer bias, because volunteers may be unusually motivated.
- Opportunity sampling: the researcher uses people who are conveniently available. It is quick but often unrepresentative.
Representative does not mean large
A large sample can still be biased. A smaller stratified sample may be more representative than a huge opportunity sample.
Experimental and research designs
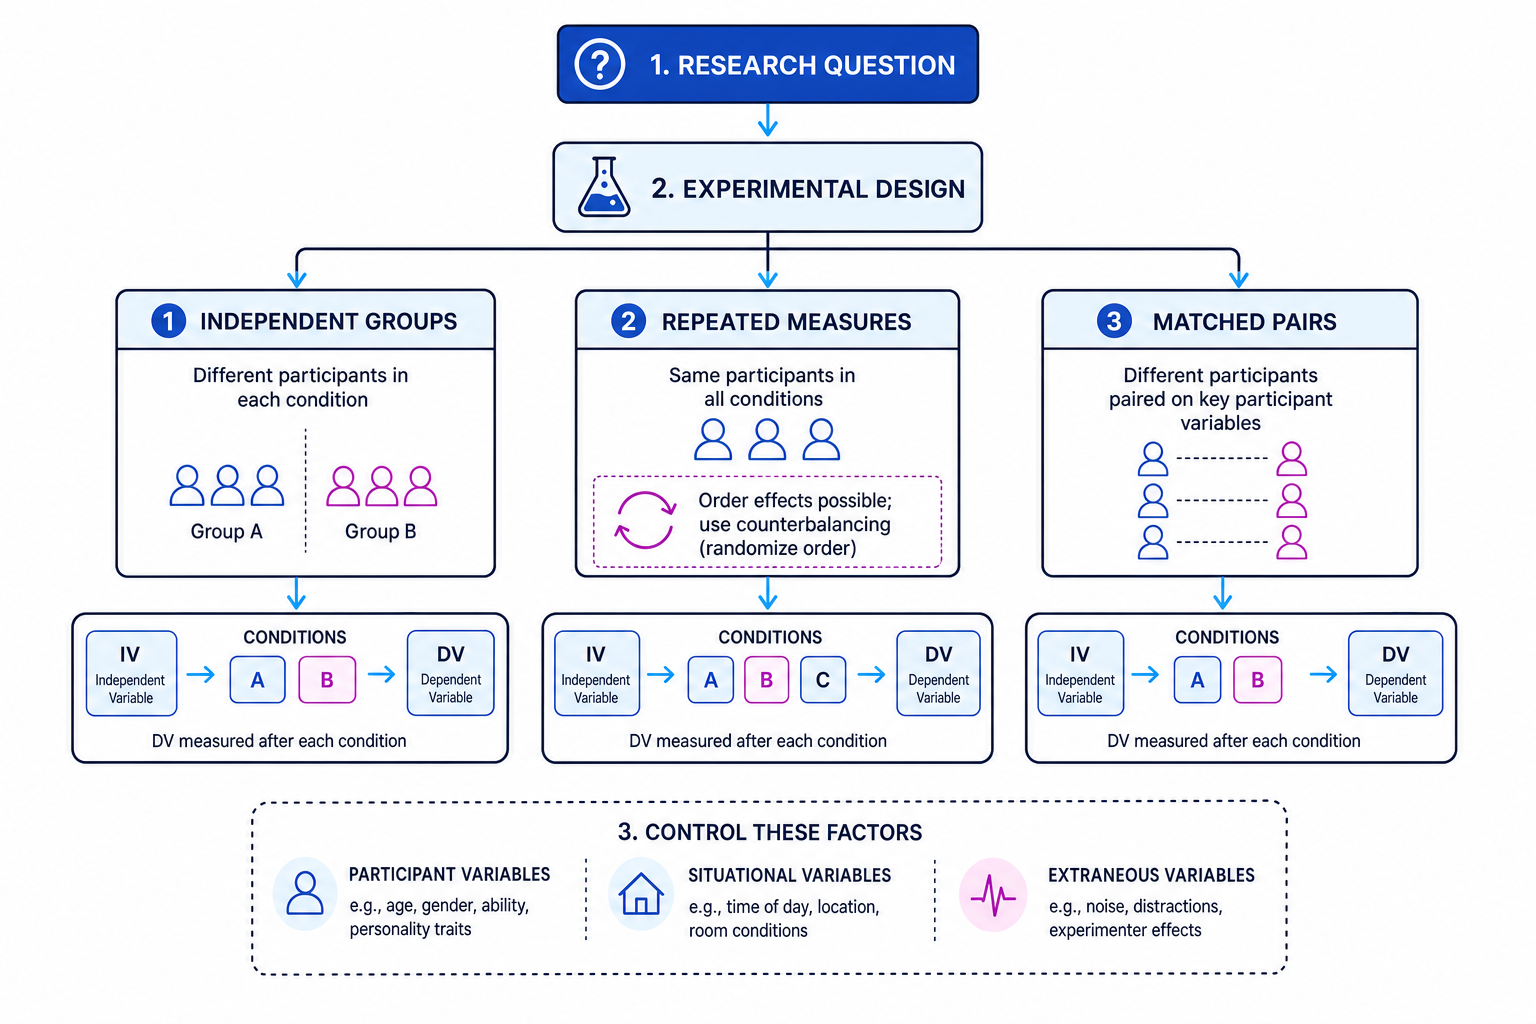
An experimental design explains how participants are allocated to conditions.
Independent groups
In an independent groups design, different participants take part in each condition. This avoids order effects, but participant variables may differ between groups.
Repeated measures
In a repeated measures design, the same participants take part in every condition. This controls participant variables, but can create order effects, where performance changes because of practice, boredom or fatigue.
Matched pairs
In a matched pairs design, different participants are paired on important characteristics, such as age, gender or baseline memory score. It reduces participant-variable problems, but matching is difficult.
Counterbalancing
Counterbalancing is a control technique used in repeated measures designs. Half the participants do condition A then B, while the other half do B then A, so order effects are spread evenly.
Hypotheses
A hypothesis is a testable prediction.
- A null hypothesis, written as H0H_0H0, predicts no significant difference, relationship or association; any pattern is due to chance.
- An alternative hypothesis, written as H1H_1H1, predicts a significant relationship or difference.
- An experimental hypothesis is the alternative hypothesis used in an experiment, predicting that the IV will affect the DV.
- A directional hypothesis predicts the direction of the effect, such as “scores will be higher”.
- A non-directional hypothesis predicts an effect but not its direction, such as “scores will differ”.
Writing hypotheses for a memory experiment
A researcher tests whether quiet or noisy conditions affect recall.
- Identify the IV: noise condition, with two levels — quiet and noisy.
- Identify the DV: number of words correctly recalled from a list.
- Write a directional experimental hypothesis if previous research suggests a direction: “Participants in the quiet condition will recall more words than participants in the noisy condition.”
- Write the null hypothesis: “There will be no significant difference in the number of words recalled in the quiet and noisy conditions.”
Questionnaires, interviews and self-report data
Self-report data is information participants give about themselves, such as thoughts, feelings or behaviours.
A questionnaire is a written set of questions. Closed questions give fixed answers and produce quantitative data. Open questions allow detailed answers and produce qualitative data. Ranked scale questions ask participants to rate or order responses, such as rating anxiety from 1 to 5.
An interview involves asking questions verbally:
- Structured interviews use the same fixed questions for everyone.
- Semi-structured interviews use planned questions but allow follow-ups.
- Unstructured interviews are flexible and conversational.
Self-reports can access private experiences, but they are vulnerable to social desirability, where participants answer in a way that makes them look good.
Experiments: laboratory and field
A laboratory experiment takes place in a controlled setting where the researcher manipulates the IV and measures the DV. It has strong control and can show cause and effect, but may lack ecological validity.
A field experiment takes place in a real-world setting. It can have higher ecological validity, but less control over extraneous variables. Sherif et al.’s Robbers Cave study is often discussed as a field study because it investigated boys’ intergroup behaviour in a camp setting.
Observations
An observation records behaviour directly.
- Tallying means counting each time a behaviour occurs.
- Event sampling records every occurrence of a defined behaviour.
- Time sampling records behaviour at set time intervals.
- Covert observation means participants do not know they are being observed.
- Overt observation means participants know they are being observed.
- Participant observation means the researcher joins the group.
- Non-participant observation means the researcher watches without joining.
- Structured observation uses pre-set behavioural categories.
- Naturalistic observation studies behaviour in its usual setting.
Observation quality
Good observations need clear behavioural categories and, where possible, more than one observer to check inter-observer reliability.
Additional research methods and techniques
Psychology uses a wide toolkit:
- Twin studies compare monozygotic and dizygotic twins to estimate genetic influence.
- Adoption studies compare adopted children with biological and adoptive relatives to separate genetic and environmental influences.
- Animal experiments use non-human animals, often for biological processes, but raise generalisability and ethical issues.
- Case studies investigate one person, group or situation in depth, such as unusual memory or brain-damage cases.
- Scanning techniques include CAT scans for brain structure, PET scans for metabolic activity using a tracer, and fMRI for blood-oxygen changes linked to neural activity.
- Content analysis systematically codes communication, such as adverts, films or interview transcripts.
- Correlational research investigates relationships between co-variables but cannot prove causation.
- Longitudinal research follows the same people over time.
- Cross-sectional research compares different groups at one time.
- Cross-cultural research compares behaviour across cultures, but must avoid ethnocentric interpretations.
- Meta-analysis combines findings from multiple studies to identify overall patterns.
Correlation is not causation
If two variables are related, one may cause the other, but there may also be a third variable causing both.
Control issues
Good research tries to control variables that might distort results.
- Participant variables: individual differences, such as age, intelligence or personality.
- Situational variables: environmental factors, such as time of day, noise or room temperature.
- Extraneous variables: unwanted variables that may affect the DV.
- Confounding variables: extraneous variables that vary systematically with the IV, making it unclear what caused the results.
- Demand characteristics: cues that reveal the study aim and change participant behaviour.
- Experimenter effects: the researcher unintentionally influences participants or interpretation.
Control and validity
The more effectively a study controls confounding variables, the stronger its internal validity and the more confidently it can make cause-and-effect claims.
Descriptive statistics
Descriptive statistics summarise data before inferential testing.
Measures of central tendency
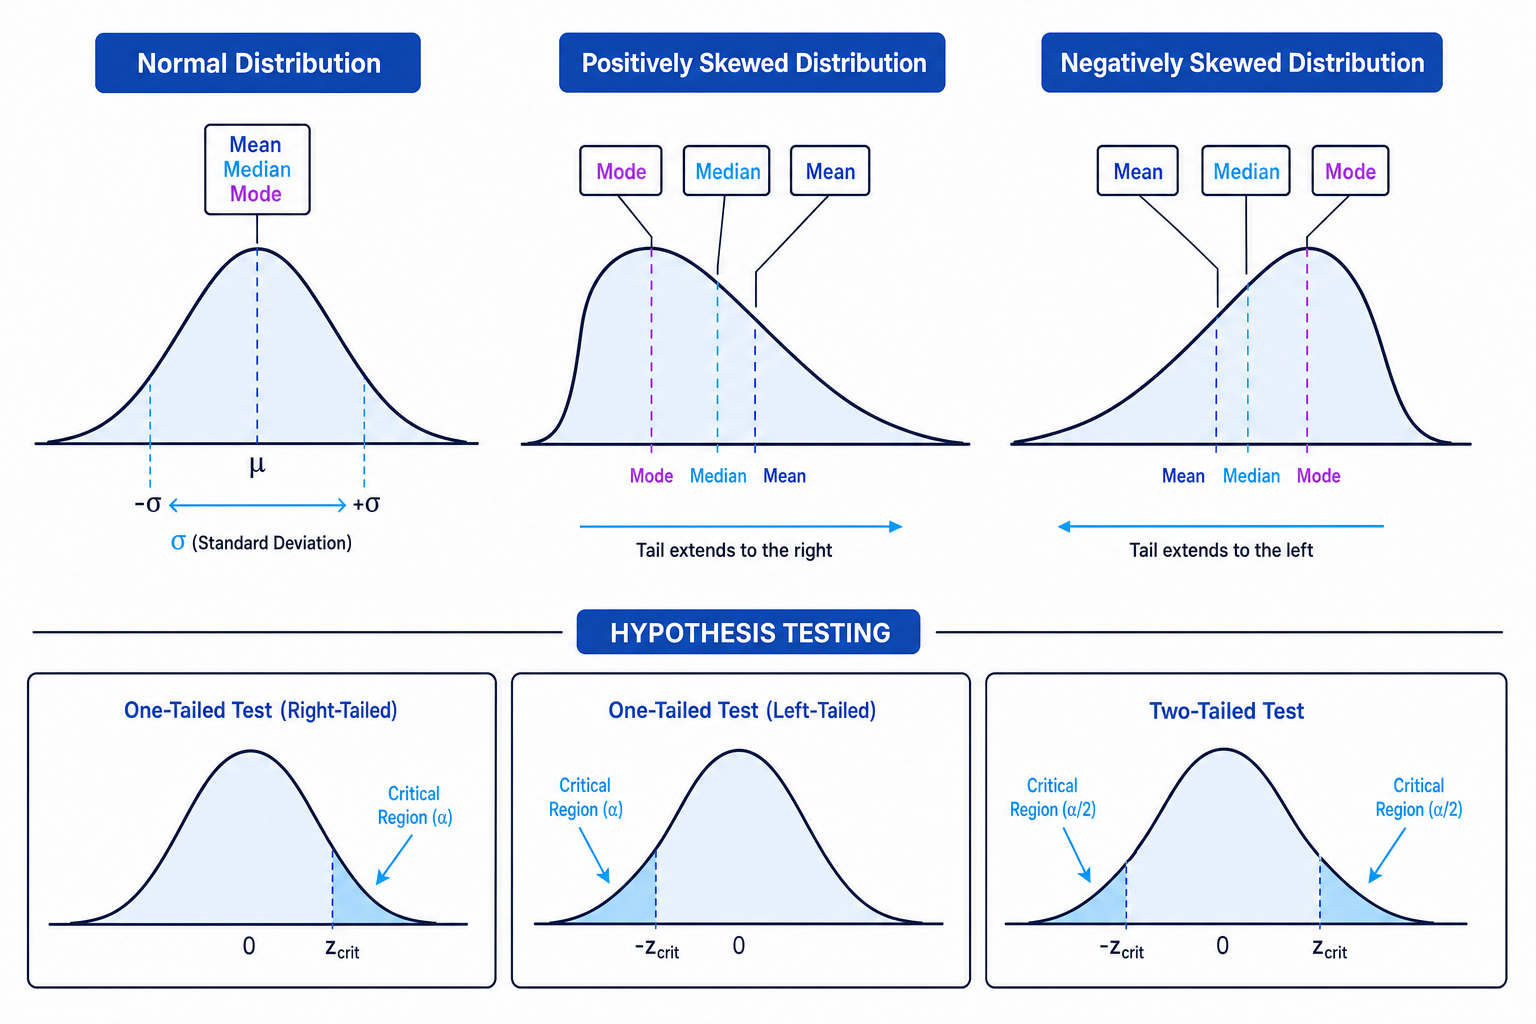
- Mean: add all scores and divide by the number of scores. It uses all data but is affected by outliers.
- Median: the middle score when data is ordered. It is useful for skewed data.
- Mode: the most common score. It is useful for categories.
Measures of dispersion
Range is the highest score minus the lowest score. Standard deviation shows how spread out scores are around the mean. A small standard deviation means scores are clustered closely; a large standard deviation means scores vary more widely.
Tables, graphs and distributions
A frequency table shows how often each score or category occurs. A bar chart is used for separate categories. A histogram is used for continuous data. A scatter diagram shows relationships between co-variables.
A normal distribution is symmetrical, with the mean, median and mode in the centre. A skewed distribution has a long tail to one side.
Comparing two sets of scores
Two groups complete a recall task. Group A scores: 6, 7, 7, 8, 12. Group B scores: 5, 6, 7, 7, 8.
- Calculate the mean for Group A: 6+7+7+8+125=8\frac{6+7+7+8+12}{5}=856+7+7+8+12=8.
- Calculate the mean for Group B: 5+6+7+7+85=6.6\frac{5+6+7+7+8}{5}=6.655+6+7+7+8=6.6.
- Compare spread: Group A has a range of 6, while Group B has a range of 3.
- Interpret cautiously: Group A has the higher mean, but its scores are more spread out and the score of 12 may be pulling the mean upwards.
Inferential statistics
Inferential statistics help decide whether a result is statistically significant or likely due to chance. The usual default significance level is p≤.05p \le .05p≤.05, meaning the probability of the result occurring if the null hypothesis were true is 5% or less.
Levels of measurement
- Nominal data: categories, such as “obedient” or “not obedient”.
- Ordinal data: ordered or ranked data, such as anxiety ratings.
- Interval data: numerical data with equal intervals, such as test scores.
Choosing the correct test
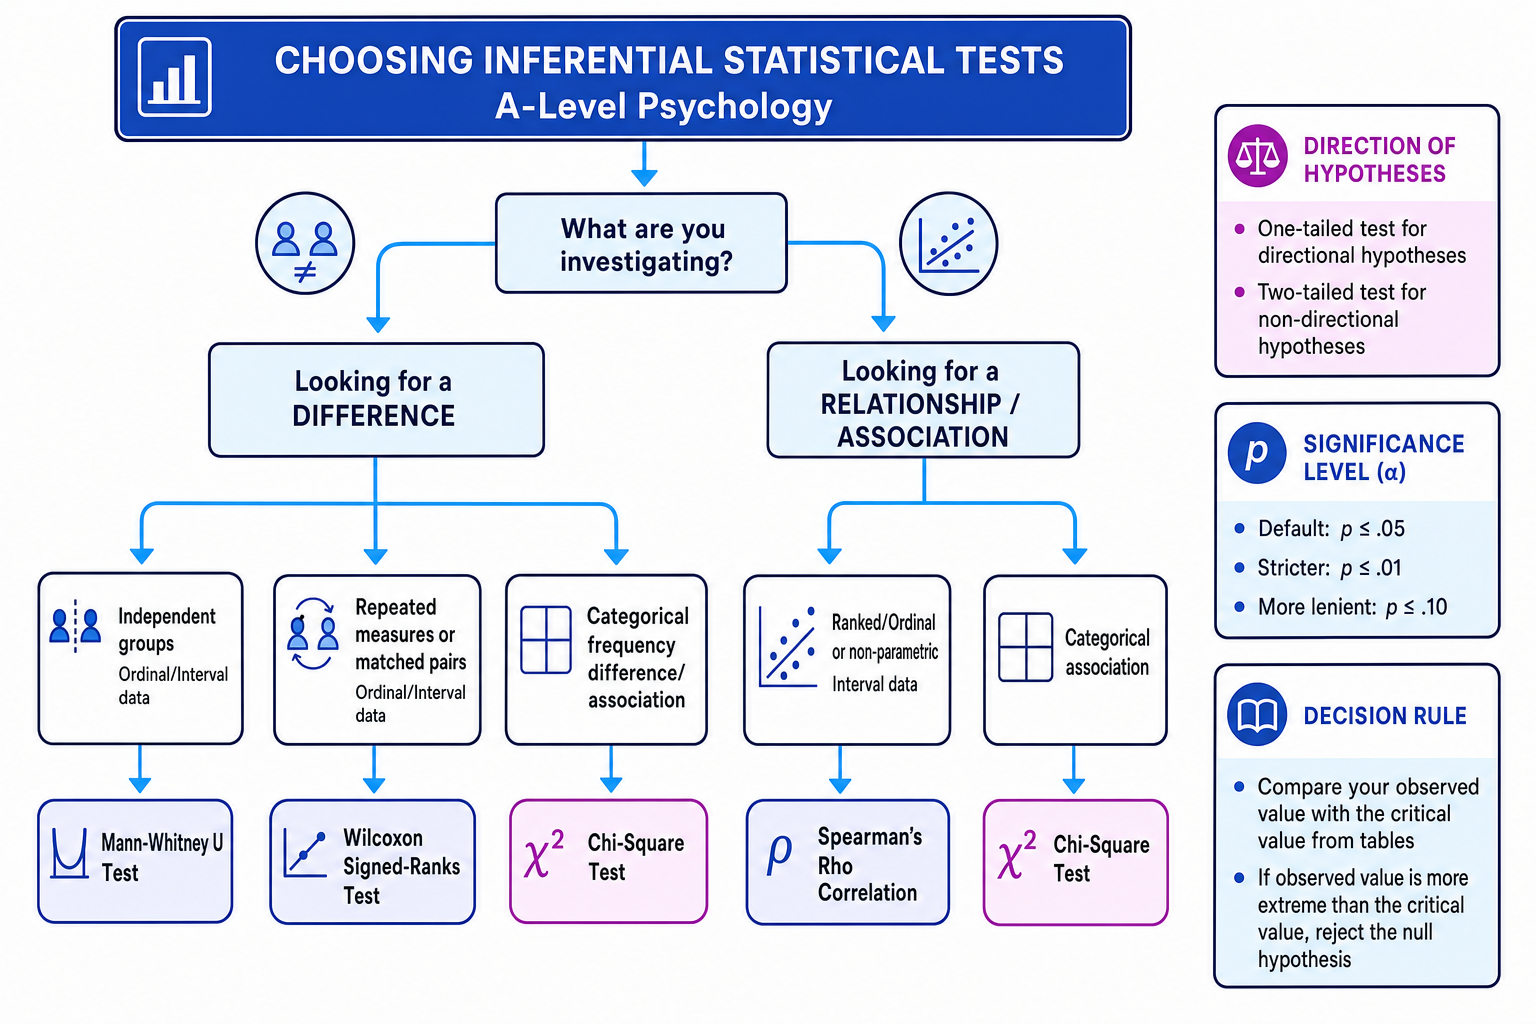
- Mann-Whitney U: test of difference for independent groups with ordinal or non-normally distributed interval data.
- Wilcoxon signed-ranks: test of difference for repeated measures or matched pairs with ordinal or non-normally distributed interval data.
- Spearman’s rho: test of correlation for ranked/ordinal data or non-parametric interval data.
- Chi-square: test for association or difference using nominal frequency data.
Direction, significance and errors
A one-tailed test is used with a directional hypothesis. A two-tailed test is used with a non-directional hypothesis.
Researchers compare an observed value from their data with a critical value from a table. For Mann-Whitney U and Wilcoxon, the observed value usually needs to be equal to or smaller than the critical value. For Spearman’s rho and chi-square, the observed value usually needs to be equal to or larger than the critical value.
A Type I error is a false positive: rejecting a true null hypothesis. It is more likely with a lenient level such as p≤.10p \le .10p≤.10. A Type II error is a false negative: failing to reject a false null hypothesis. It is more likely when the test is too strict, such as p≤.01p \le .01p≤.01, or when sample size is low.
Choosing and interpreting a statistical test
A researcher compares anxiety ratings in an independent groups design. The observed Mann-Whitney U value is 8. The critical value at p≤.05p \le .05p≤.05 for a two-tailed test is 10.
- Decide the purpose: the researcher is testing a difference between two independent groups.
- Check the data level: anxiety ratings are ordinal, so Mann-Whitney U is appropriate.
- Use the correct tail: if the hypothesis is non-directional, use the two-tailed critical value.
- Compare values: for Mann-Whitney U, 8≤108 \le 108≤10, so the result is significant.
- Make the decision: reject H0H_0H0 and conclude there is a significant difference in anxiety ratings.
Qualitative analysis
Thematic analysis identifies patterns or themes in qualitative data. Researchers read the data, code meaningful sections, group codes into themes, review the themes and support them with quotes.
Grounded theory builds theory from the data itself. Analysis and data collection happen together until no major new themes appear, known as saturation.
Methodological issues
- Internal validity: whether the study really measures the effect of the IV on the DV.
- Predictive validity: whether findings predict future behaviour.
- Ecological validity: whether findings apply to real-world settings.
- Reliability: whether findings are consistent and replicable.
- Generalisability: whether findings apply beyond the sample studied.
- Objectivity: whether conclusions are based on evidence rather than personal opinion.
- Subjectivity: when interpretation is influenced by researcher bias.
- Credibility: whether evidence is trustworthy, especially in qualitative research.
Published psychological research
A published report usually includes:
- Abstract: brief summary.
- Introduction: background research and rationale.
- Aims and hypotheses: what is being tested.
- Method: design, participants, materials, procedure and ethics.
- Results: descriptive and inferential findings.
- Discussion: interpretation, evaluation, applications and future research.
Peer review means other experts check the research before publication. It improves quality control, but it does not guarantee research is perfect.
Ethics in human and animal research
Human research in the UK is guided by the BPS Code of Ethics and Conduct (2009). Researchers should consider informed consent, deception, right to withdraw, protection from harm, confidentiality and debriefing. A risk assessment should identify possible physical or psychological risks and how they will be reduced.
Animal research is regulated by the Scientific Procedures Act 1986 and Home Office regulations. Researchers must justify the likely benefits, minimise suffering, use appropriate licences and follow the principles of replacement, reduction and refinement.
In the exam
- For methods questions, name the method/design/test first, then justify it using the scenario details.
- In evaluation, link every point to a methodological issue such as validity, reliability, generalisability, objectivity or ethics.
- For statistics, always state the decision rule clearly: compare observed and critical values, then reject or retain H0H_0H0.
Check yourself
- Can you explain the difference between an extraneous variable and a confounding variable?
- Which inferential test would you use for a correlation using ranked data?
- Why might Burger’s 2009 obedience study be considered more ethical than Milgram’s original research?
