What you'll learn
- How observations can gather quantitative and qualitative data about learned behaviour.
- How animal laboratory research links to learning theories, and why ethics matter.
- How to choose and use the chi-squared test for categorical data.
- How to write about your practical investigation, key question, and scientific evaluation using AO1, AO2 and AO3.
The big picture: methods in Learning theories
Learning theories often study behaviour that has been acquired through experience: for example, fear responses in Watson and Rayner’s (1920) “Little Albert” study, imitation in Bandura, Ross and Ross (1961), and animal conditioning in Pavlov (1927) and Skinner (1938).
In Topic 4, your research methods focus is mainly observation: watching behaviour, recording it carefully, and then analysing both numbers and meanings.
Observational research
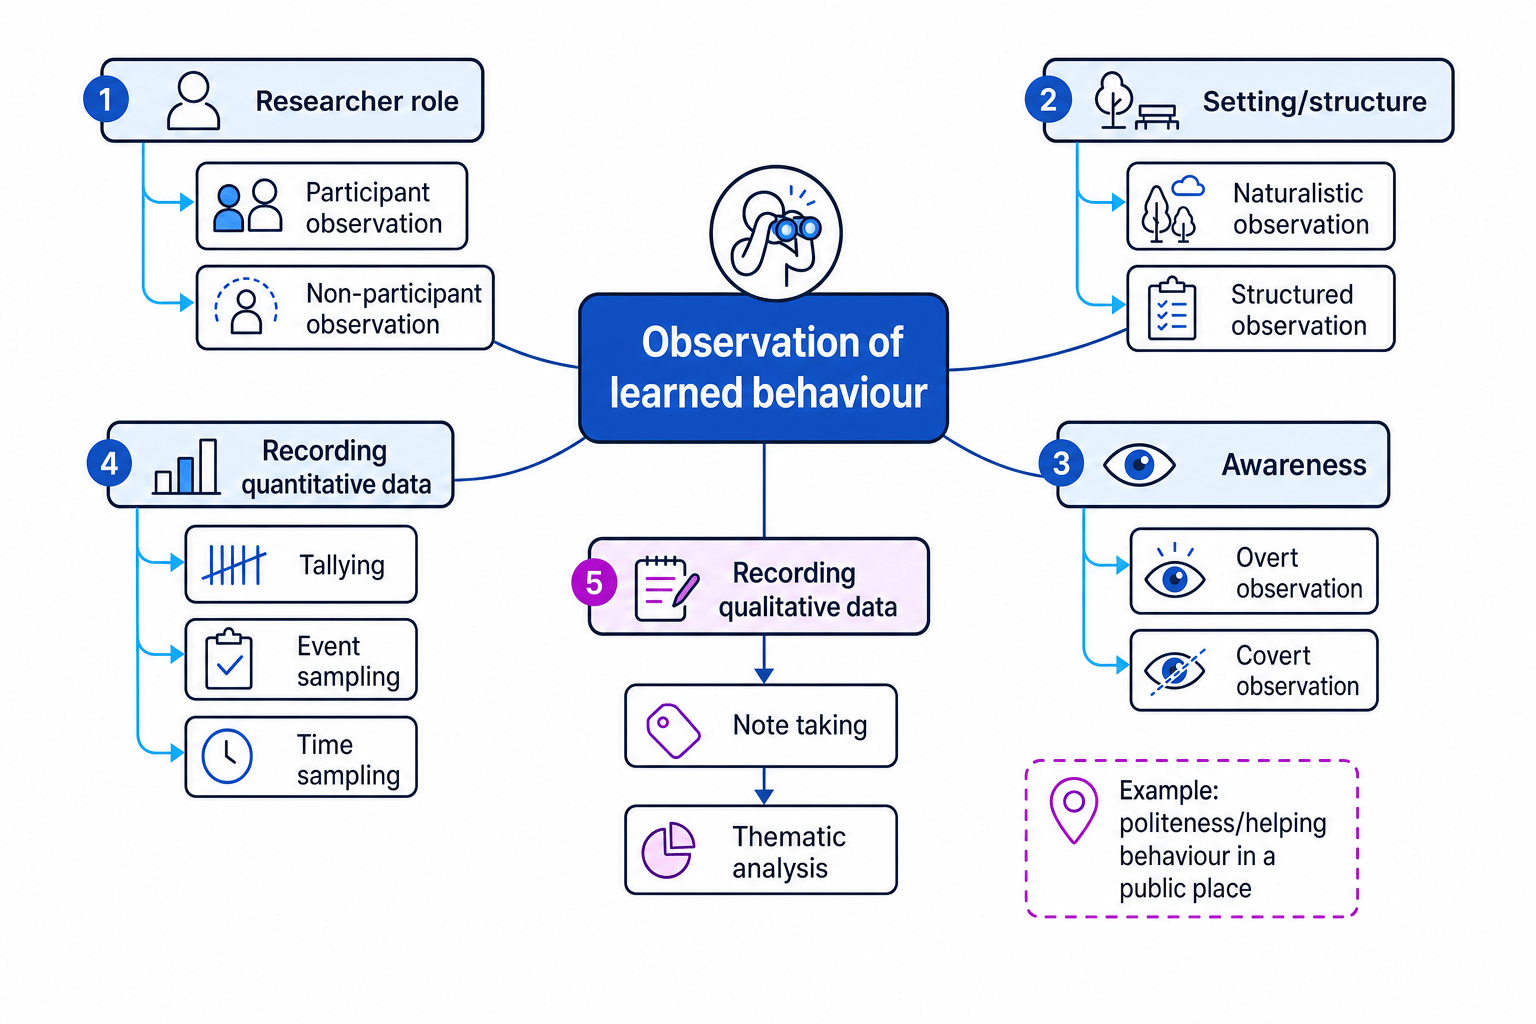
An observational research method studies behaviour by watching and recording it, rather than directly manipulating an independent variable. Quantitative data are numerical counts or scores. Qualitative data are descriptive words, such as field notes about what people said or did.
Human research: observations
Types of observation
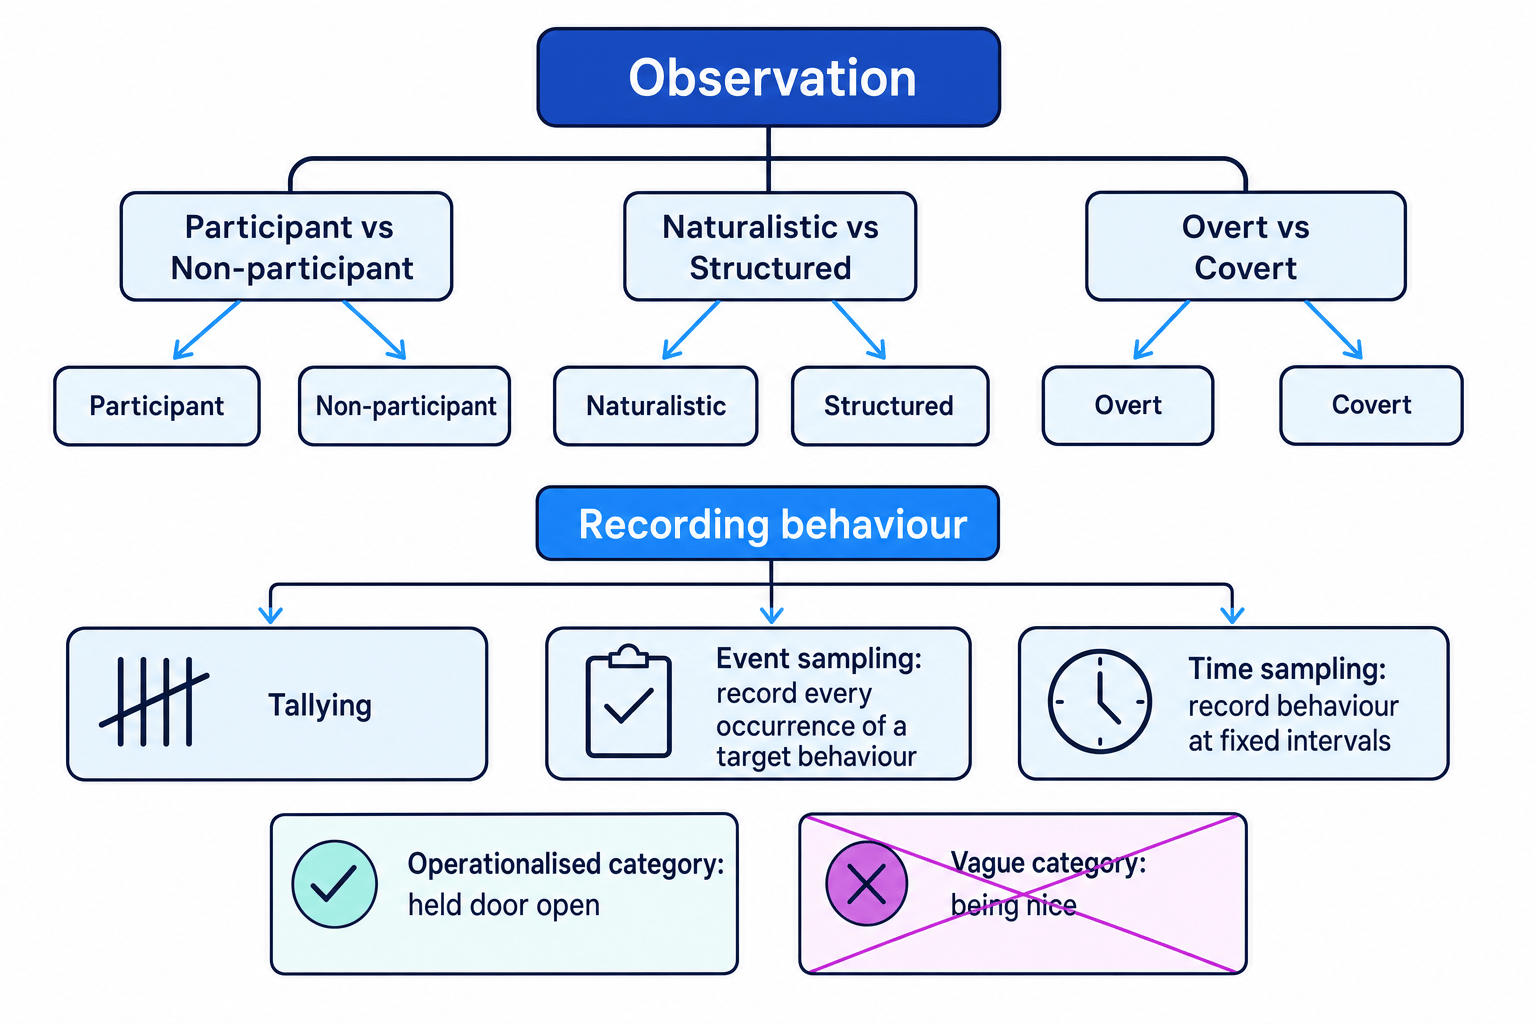
A participant observation is when the researcher joins the group being studied. A non-participant observation is when the researcher watches without joining in.
A naturalistic observation takes place in a real-world setting, such as a street or classroom. A structured observation uses pre-set behavioural categories so the researcher knows exactly what to record.
An overt observation is when participants know they are being observed. A covert observation is when they do not know.
Recording behaviour
Tallying means making a mark each time a behaviour occurs. Event sampling means recording every occurrence of a target behaviour, such as every time someone holds a door open. Time sampling means recording behaviour at fixed time intervals, such as every 30 seconds.
Designing an observation of polite behaviour
- Choose an observable learned behaviour, such as holding a door open. This is better than “being nice”, because “nice” is too vague to record reliably.
- Decide on categories: for example, “held door open”, “did not hold door open”, and “said thank you”. These categories allow tallying and later frequency analysis.
- Choose a naturalistic, non-participant observation in a public place, because politeness is likely to occur naturally and the researcher does not need to interact.
- Add qualitative note taking, such as short notes on tone of voice or context, so the same observation can produce both numerical tallies and material for thematic analysis.
Vague behavioural categories
Do not write categories such as “aggressive”, “helpful” or “rude” without operationalising them. Say exactly what counts, such as “pushed another person”, “picked up a dropped item”, or “spoke over someone”.
Content analysis
Content analysis
Content analysis is a research method that systematically codes communication, such as adverts, films, magazines, websites or social media posts, into categories for analysis.
In Learning theories, content analysis can be used for a key question such as whether celebrities and role models influence eating behaviour. For example, a researcher might code social media posts for “thin-ideal images”, “diet praise”, or “before-and-after body transformation”.
Content analysis can produce quantitative data, such as the number of posts containing a theme, and qualitative data, such as examples of repeated messages. It is more reliable when the coding categories are clear and when two researchers code the same material to check agreement.
Animal research in learning theories
Animal laboratory experiments have been important in learning theory. Pavlov (1927) used dogs to study classical conditioning, while Skinner (1938) used rats and pigeons to study operant conditioning. The logic is that some learning processes, such as forming associations or learning through reinforcement, may be shared across species.
However, generalising from animals to humans can be reductionist because human behaviour also involves language, culture, conscious thought and social meaning.
Reductionism
Reductionism means explaining a complex behaviour using a simpler level of explanation, such as explaining phobias only through stimulus-response learning.
Animal research must follow the Scientific Procedures Act (1986) and Home Office Regulations. Researchers need licences, must justify the scientific value, and should minimise suffering. The usual ethical principles include replacing animals where possible, reducing the number used, and refining procedures to reduce harm.
Analysis of data
Descriptive statistics first
Before inferential statistics, you describe your data.
Measures of central tendency show the typical score: the mean is the arithmetic average, the median is the middle value, and the mode is the most common value.
Measures of dispersion show spread: the range is the highest value minus the lowest value, and the standard deviation shows how much scores typically vary around the mean.
A normal distribution is roughly symmetrical and bell-shaped. A skewed distribution has a long tail on one side. If data are skewed, the median and range may be more useful than the mean and standard deviation.
Use frequency tables to show counts. Use bar charts for separate categories, such as “helped” and “did not help”. Use histograms for continuous data grouped into intervals, such as driving speeds.
Inferential statistics: choosing the right test
Inferential statistics
Inferential statistics are tests used to judge whether a pattern in data is likely to be a real effect or could reasonably have occurred by chance.
The level of measurement matters. Nominal data are categories, such as male/female or helped/did not help. Ordinal data are ranked. Interval or ratio data use equal numerical units, such as time taken.
Across the A-Level course, the named tests are:
- Mann-Whitney U: difference between two unrelated groups.
- Wilcoxon signed-ranks: difference between two related conditions or matched pairs.
- Spearman’s rho: correlation between two ranked variables.
- Chi-squared test: association or difference in frequencies using nominal data.
The chi-squared test
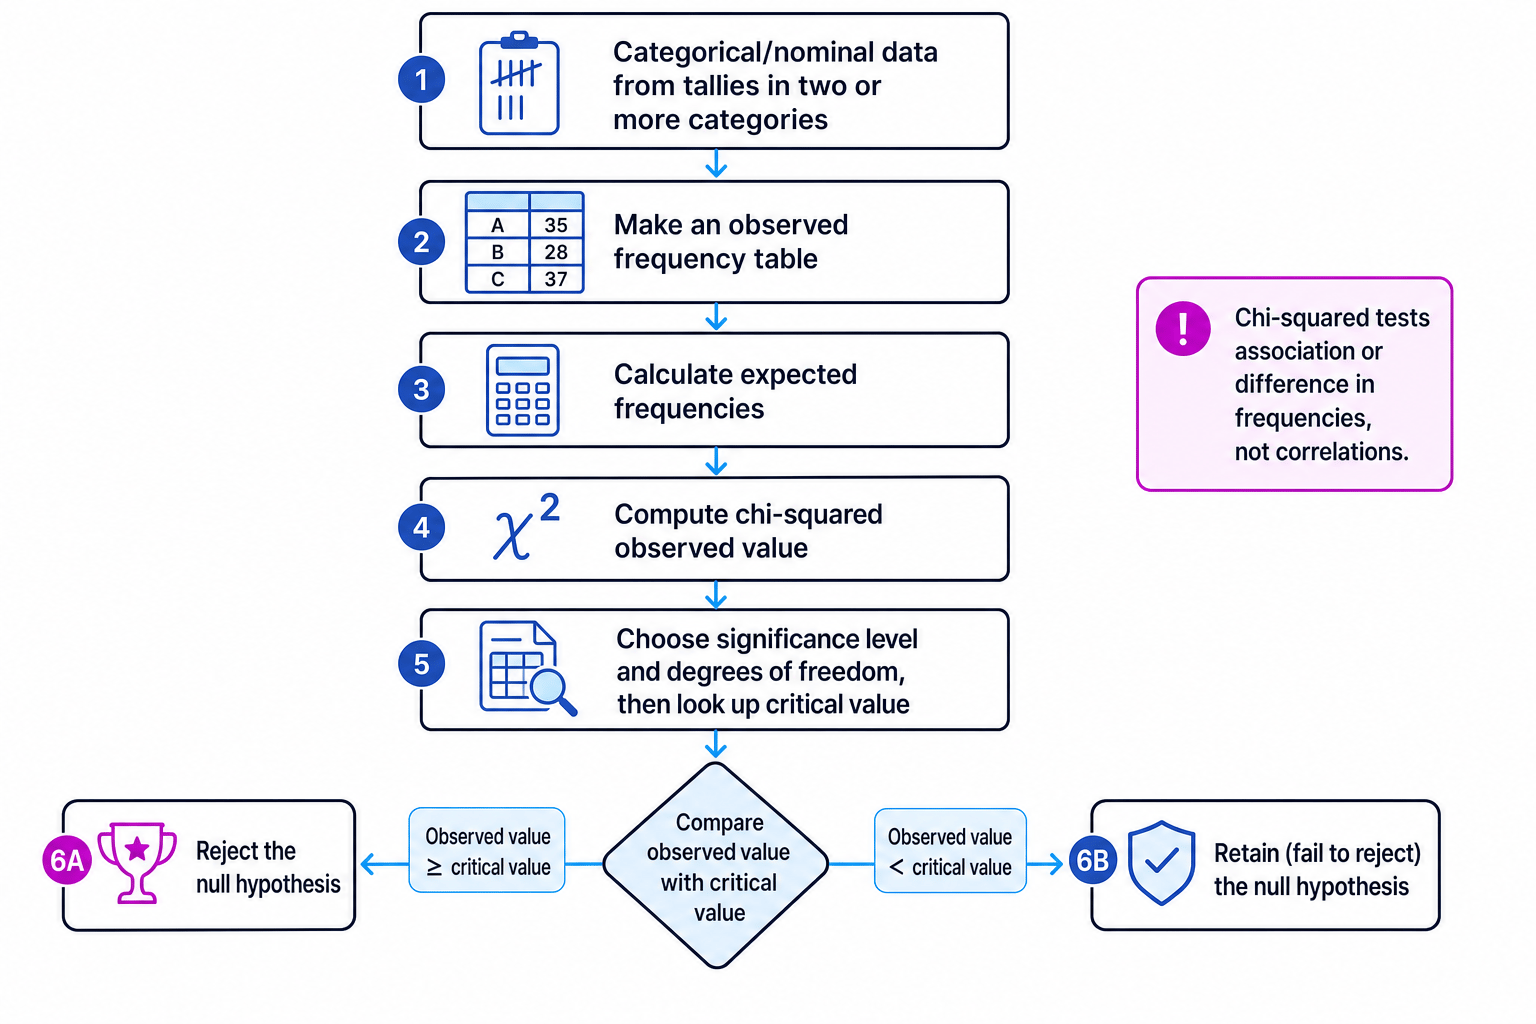
The chi-squared test is used when your data are frequencies in categories. It is useful for your observation practical, such as testing whether sex is associated with helping behaviour.
The formula is:
χ2=∑(O−E)2E\chi^2 = \sum \frac{(O - E)^2}{E}χ2=∑E(O−E)2Here, OOO means observed frequency and EEE means expected frequency.
The usual significance level is p≤.05p \le .05p≤.05. A stricter level is p≤.01p \le .01p≤.01, which reduces the risk of a Type I error: falsely claiming a significant effect. A more lenient level is p≤.10p \le .10p≤.10, which increases Type I risk but reduces the risk of a Type II error: missing a real effect.
Using chi-squared with helping behaviour
- Suppose you observed 30 men and 30 women. The tallies were: men helped 12 times and did not help 18 times; women helped 21 times and did not help 9 times.
- Work out expected frequencies from the row and column totals. There were 33 helping acts out of 60 observations, so the expected helping frequency for each sex is 30×3360=16.530 \times \frac{33}{60} = 16.530×6033=16.5.
- Calculate the four contributions to χ2\chi^2χ2: helped men =(12−16.5)216.5=1.23= \frac{(12 - 16.5)^2}{16.5} = 1.23=16.5(12−16.5)2=1.23; not-helped men =(18−13.5)213.5=1.50= \frac{(18 - 13.5)^2}{13.5} = 1.50=13.5(18−13.5)2=1.50; helped women =1.23= 1.23=1.23; not-helped women =1.50= 1.50=1.50.
- Add them: χ2=1.23+1.50+1.23+1.50=5.46\chi^2 = 1.23 + 1.50 + 1.23 + 1.50 = 5.46χ2=1.23+1.50+1.23+1.50=5.46.
- For a two-by-two table, df=(r−1)(c−1)=1\text{df} = (r - 1)(c - 1) = 1df=(r−1)(c−1)=1. At p≤.05p \le .05p≤.05, the critical value is 3.84. Since 5.46 is greater than 3.84, reject the null hypothesis.
Observed versus critical values
For chi-squared, the observed value must be greater than or equal to the critical value to be significant. Do not assume this rule is the same for every test: Mann-Whitney U and Wilcoxon often use the opposite comparison.
Expected frequencies
Chi-squared becomes unreliable if expected frequencies are too small. As a rule of thumb at A-Level, avoid categories where expected values fall below 5.
One-tailed and two-tailed decisions
A directional hypothesis predicts the direction of a result, such as “women will help more often than men”. This usually leads to a one-tailed test.
A non-directional hypothesis predicts a difference or association without saying which way it will go, such as “sex will be associated with helping behaviour”. This usually leads to a two-tailed test.
For chi-squared, you normally test whether the observed frequencies are far enough from expected frequencies to be significant, using the critical-value table given.
Thematic analysis
Thematic analysis
Thematic analysis is a method for analysing qualitative data by identifying repeated patterns of meaning, called themes.
You might read field notes from an observation, highlight repeated ideas, create codes, group similar codes into themes, and then support each theme with brief examples.
Creating themes from observation notes
- Read the notes and code repeated details, such as “smiled”, “apologised”, “ignored”, “rushed past”, or “made eye contact”.
- Group similar codes into broader themes. For example, “smiled” and “made eye contact” could form a theme called friendly non-verbal communication.
- Check that each theme is supported by several examples, rather than one unusual incident, so the analysis is more credible.
Scientific status of psychology
Psychology aims to be scientific by using empiricism, meaning evidence from observation or measurement. It uses hypothesis testing, where researchers make a clear prediction and test it against evidence.
A study has reliability if it produces consistent results. It has replicability if other researchers can repeat the procedure and check whether similar findings occur.
Internal validity means the study really tests what it claims to test. Ecological validity means the findings apply to real-life settings. Predictive validity means the findings can accurately predict future behaviour.
Falsification means a theory must be testable in a way that could prove it wrong. Controls are features kept constant so that researchers can reduce extraneous variables.
Science in Learning theories
Learning theories often score highly for control and replicability, especially in laboratory research, but may be criticised for reductionism and lower ecological validity.
For AO3, you can compare methods. Bandura et al. (1961) used controlled observation and standardised aggression categories, which improves reliability. However, the artificial Bobo doll setting may reduce ecological validity. Watson and Rayner (1920) showed conditioning in a human infant, but the study raises serious ethical issues around consent, protection from harm and right to withdraw.
Key question: role models, celebrities and anorexia
The specification’s examples are indicative, not exhaustive. One suitable contemporary key question is: Is the influence of role models and celebrities something that causes anorexia?
Learning theories can help explain this. Social learning theory suggests people may imitate rewarded role models, especially if those models are attractive, high-status or similar to the observer. Becker et al. (2002) found changes in eating attitudes among Fijian adolescent girls after television exposure, which can be applied to media influence.
AO3 balance is essential: anorexia is not caused by one factor alone. Biological vulnerability, family environment, personality, peer influence and culture may all contribute. So learning theory may explain part of the issue, but a purely media-based explanation is reductionist.
Practical investigation: your observation
For your practical, you carry out two observations, or one observation if it gathers both qualitative and quantitative data. It should relate to learned behaviour, such as politeness, helping, driving characteristics, age-related behaviour, or behaviour of different sexes.
Your write-up should include:
- aim and hypotheses, including a null hypothesis
- operationalised behavioural categories
- sampling method, such as event sampling or time sampling
- quantitative results using tallies, a frequency table, a bar chart, and chi-squared
- qualitative results using thematic analysis
- strengths, weaknesses and improvements
Use the BPS Code of Ethics and Conduct (2009): consider consent, deception, right to withdraw, protection from harm, confidentiality and debriefing. In public naturalistic observations, avoid recording names, faces or identifying details.
In the exam
- For AO1, define the method or statistic precisely before applying it.
- For AO2, link every point to the scenario: the behaviour observed, the categories used, and the data collected.
- For AO3, evaluate using methodological language: reliability, validity, ethics, controls, replicability and reductionism.
Check yourself
- Why is chi-squared suitable for tally data from an observation?
- How is event sampling different from time sampling?
- What ethical problems might arise in a covert naturalistic observation?