What you'll learn
- How animal and human studies can investigate drugs, and how to evaluate their ethics.
- How cross-cultural research helps with nature-nurture questions about drug misuse.
- How to analyse quantitative and qualitative data in Health Psychology.
- How to choose between chi-square, Spearman’s rho, Mann-Whitney U and Wilcoxon signed-ranks.
The big idea: methods must match the question
In Health Psychology, you often study sensitive behaviours such as smoking, alcohol use, drug misuse and health choices. Your method must be valid — it should measure what it claims to measure — and ethical — it should protect participants or animals from unnecessary harm.
A drug is a substance that changes biological or psychological functioning. In this topic, that might include nicotine, alcohol, caffeine, prescribed medication or illegal substances. Drug misuse means using a substance in a harmful, risky or non-medical way.
Animal laboratory experiments to study drugs
Animal laboratory experiment
An animal laboratory experiment is a controlled study using non-human animals where the researcher manipulates an independent variable, such as exposure to a drug, and measures a dependent variable, such as withdrawal symptoms, brain activity or lever pressing.
Animal studies are used because researchers can control diet, genetics, dose and environment more tightly than in human research. They can also investigate biological processes that would be unethical to manipulate in people.
For example, classic animal work by Olds and Milner (1954) showed that rats would work to stimulate brain reward areas. Later drug studies used similar ideas, such as self-administration, where an animal performs an action, like pressing a lever, to receive a drug dose. This can model reinforcement, dependence, tolerance and withdrawal.
Strengths and weaknesses
Animal experiments can show cause and effect because variables are controlled. They can also help develop treatments before human trials.
However, animals are not humans. Species differences in brain structure, metabolism and social behaviour mean findings may not generalise fully to human drug misuse. Human drug use also involves meanings, peer influence, culture and personal choice.
Animal ethics
Animal research in the UK is guided by legal controls such as the Animals (Scientific Procedures) Act 1986 and the principle of the 3Rs:
- Replacement: use non-animal alternatives where possible.
- Reduction: use the smallest number of animals needed for valid results.
- Refinement: minimise pain, distress and lasting harm.
Applying the 3Rs to a nicotine-dependence study
- Decide whether animals are genuinely needed. If the research question is only about attitudes to smoking, a human questionnaire is more appropriate; if it is about brain withdrawal mechanisms, an animal model may be justified.
- Reduce the number of animals by using a design that gives enough statistical power without unnecessary repetition.
- Refine the procedure by using the lowest effective dose, humane endpoints, careful monitoring and enriched housing.
- Weigh likely benefits against costs. A study aiming to improve treatment for addiction has stronger justification than one with little real-world value.
Human drug studies
Human studies are essential because drug use is affected by beliefs, social norms, culture, stress and access to substances.
Method 1: experiments and trials
A randomised controlled trial, or RCT, randomly allocates participants to conditions, such as a nicotine-replacement treatment or a placebo. A placebo is an inactive treatment used as a comparison. A double-blind study means neither participants nor researchers know who is in each condition during data collection, reducing demand characteristics and researcher bias.
Human trials, such as smoking-cessation research by Jorenby et al. (2006) on varenicline, can test whether an intervention works in real people.
Method 2: questionnaires, interviews and correlations
A questionnaire uses standardised questions to gather data, often as numbers. An interview asks questions face-to-face or online and can produce richer qualitative data. A correlational study measures two co-variables, such as stress score and cigarettes smoked per week, to see whether they are related.
The key weakness is that correlations do not prove causation. If stress and smoking are related, stress might increase smoking, smoking might increase stress, or a third factor, such as poverty, might affect both.
Human ethics
For human drug research, apply the BPS Code of Ethics and Conduct (2009): informed consent, avoidance or clear justification of deception, right to withdraw, protection from harm, confidentiality and debriefing.
Drug studies need extra care. Researchers should not encourage illegal or harmful use, pressure participants to disclose sensitive behaviour, or expose vulnerable people to risk. If deception is used in a placebo design, participants should know they may receive a placebo and be fully debriefed afterwards.
Choosing a method for a smoking study
- If the question is “Does a new cessation app reduce cigarette use?”, choose an experiment or RCT because you need to compare an intervention with a control condition.
- If the question is “Is stress related to nicotine use?”, choose a questionnaire and correlational design because both variables naturally vary.
- If the question is “How do smokers describe relapse?”, choose interviews because open answers can reveal themes such as stress, habit or social pressure.
- Check ethics: keep data anonymous, allow withdrawal, avoid judgemental wording, and provide support information at debrief.
Cross-cultural research and nature-nurture
Cross-cultural research
Cross-cultural research compares behaviour across different cultural groups to see whether patterns are similar or different across societies.
This is useful for nature-nurture debates. Nature refers to biological influences, such as genes or neurochemistry. Nurture refers to environmental influences, such as family, culture, advertising, laws and peer norms.
If drug misuse patterns are similar across many cultures, this may suggest universal biological mechanisms, such as reward pathways. If rates vary greatly, this may suggest nurture factors, such as availability, social approval, religion, law or economic stress.
Cross-cultural differences do not prove culture caused them
A difference between countries may reflect many confounding variables, such as age, wealth, policing, stigma, sampling or honesty in self-report. Cross-cultural research suggests possible nurture effects, but it rarely proves one clear cause.
Quantitative data analysis
Quantitative data are numerical data, such as scores, percentages or frequency counts. Before choosing statistics, identify the level of measurement:
- Nominal data: categories with no order, such as alcohol reference versus nicotine reference.
- Ordinal data: ordered data where gaps may not be equal, such as craving ratings from 1 to 10.
- Interval or ratio data: numerical data with equal intervals, such as number of cigarettes smoked per week.
Descriptive statistics
Measures of central tendency describe the typical score:
- Mean: add all scores and divide by the number of scores.
- Median: the middle score when scores are ordered.
- Mode: the most common score.
Measures of dispersion describe spread:
- Range: highest score minus lowest score.
- Standard deviation: how far scores typically spread around the mean.
A frequency table shows how often each score or category occurs. A bar chart is used for separate categories. A histogram is used for continuous grouped data, with bars touching.
Summarising drug-reference counts
A student counts drug references in six TV episodes: 1, 1, 2, 3, 3, 8.
- Calculate the mean: the total is 18, and there are six episodes, so the mean is 3.
- Find the median: the middle two scores are 2 and 3, so the median is 2.5.
- Find the mode: 1 and 3 both occur twice, so the data are bimodal.
- Calculate the range: highest minus lowest is 8 minus 1, so the range is 7.
- Interpret the pattern: the score of 8 pulls the mean upwards, so the median may better represent a typical episode.
Bar charts and histograms are not interchangeable
Use bar charts for categories such as alcohol versus nicotine. Use histograms for continuous grouped scores such as number of drug references per programme.
Normal and skewed distributions
A normal distribution is symmetrical and bell-shaped; the mean, median and mode are similar. A skewed distribution is lopsided. In a positive skew, a few high scores pull the mean upwards. In a negative skew, a few low scores pull the mean downwards.
Shape affects interpretation
When data are skewed or contain outliers, the mean and standard deviation can be misleading. The median and range may give a clearer summary.
Inferential statistical testing
An inferential statistical test helps you judge whether a pattern in your sample is likely to reflect a real effect or could reasonably be due to chance.
The observed value is the value calculated from your data. The critical value is the threshold found in a critical-value table, based on sample size, significance level and whether the test is one-tailed or two-tailed.
A significance level is the probability of accepting a result as significant when chance might explain it. The default in psychology is usually p≤.05p \le .05p≤.05. Sometimes researchers use p≤.10p \le .10p≤.10 for a more lenient exploratory test, or p≤.01p \le .01p≤.01 for a stricter test.
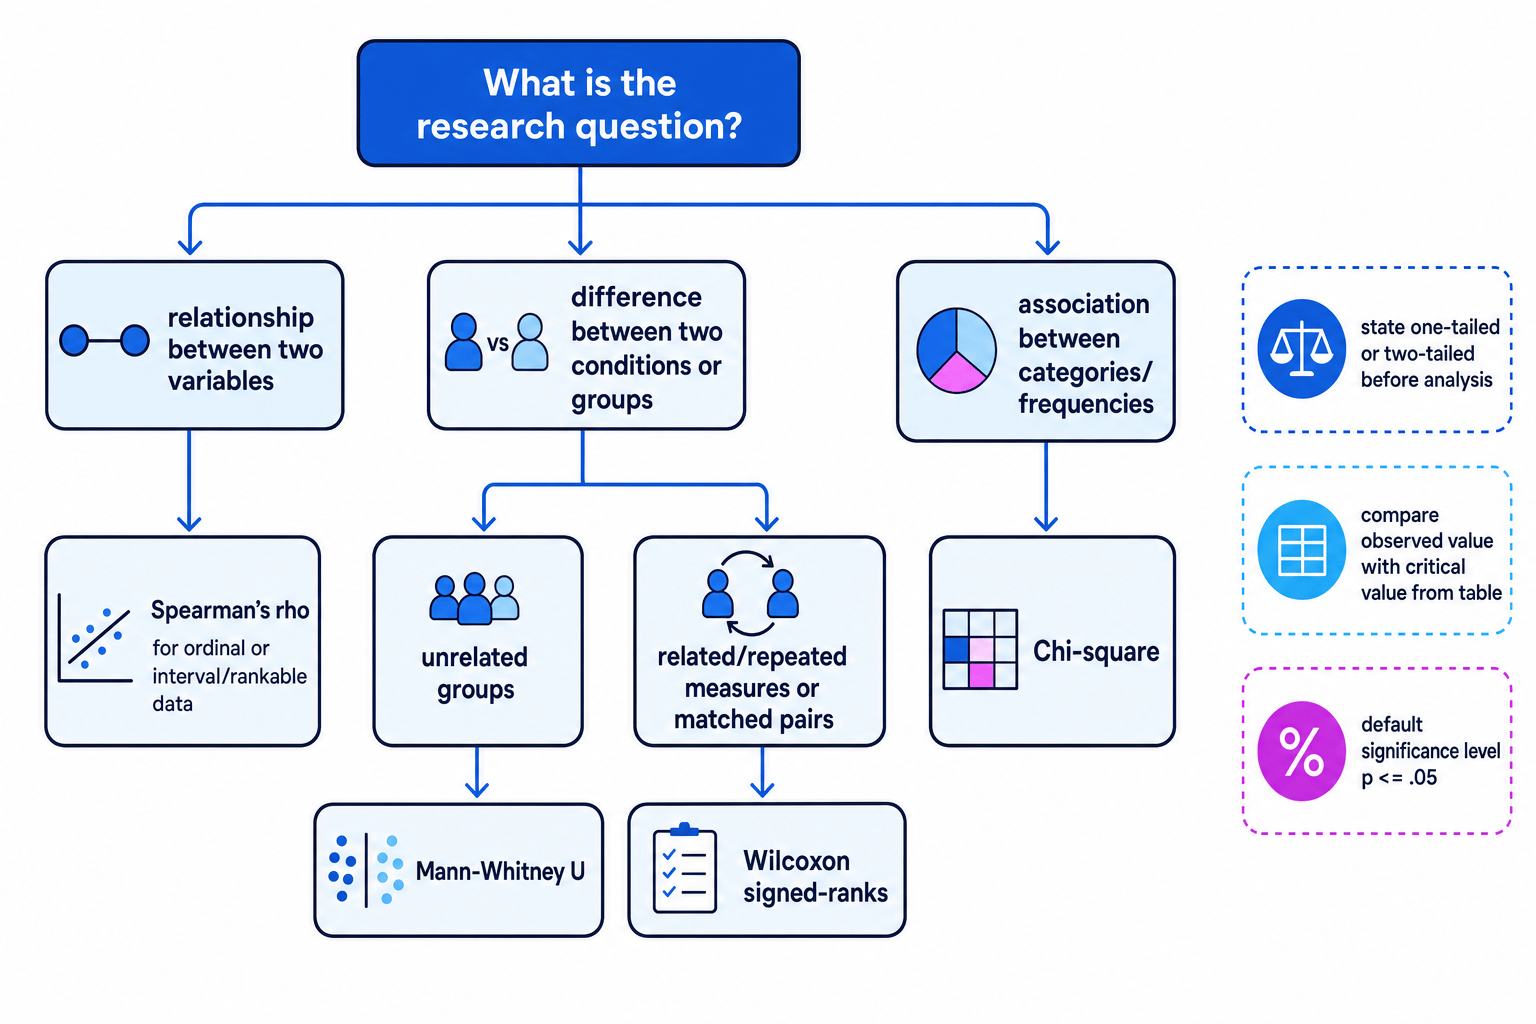
Choosing the right test
Use Spearman’s rho for a correlation between two variables, usually ordinal or ranked data.
Use Mann-Whitney U for a difference between two unrelated groups, such as smokers and non-smokers.
Use Wilcoxon signed-ranks for a difference between two related conditions, such as craving before and after a health message.
Use chi-square, also called chi squared, for an association between categories using frequency data, such as whether alcohol and nicotine references differ in positive versus negative tone.
Observed versus critical values
For Spearman’s rho and chi-square, larger observed values usually need to meet or exceed the critical value. For Mann-Whitney U and Wilcoxon signed-ranks, smaller observed values usually need to be equal to or below the critical value. Always follow the table instructions.
One-tailed and two-tailed decisions
A one-tailed hypothesis predicts the direction of the effect, such as “the campaign will reduce smoking.” A two-tailed hypothesis predicts a difference or correlation but not the direction. Decide this before looking at the results.
A Type I error is a false positive: concluding there is an effect when there is not one. A Type II error is a false negative: failing to find an effect that really exists.
Interpreting a Wilcoxon result
A student measures craving scores in the same participants before and after a mindfulness exercise.
- Choose Wilcoxon signed-ranks because the same participants are measured twice, so the data are related.
- Use a one-tailed test if the hypothesis predicted that mindfulness would reduce craving.
- Compare values: if the observed value is 7 and the critical value is 8, then the result is significant because 7 is below 8 for a standard Wilcoxon table.
- Conclude in context: craving scores were significantly lower after mindfulness at p≤.05p \le .05p≤.05.
Significant does not mean important
A statistically significant result is unlikely to be due to chance at the chosen level, but it may still be small, artificial or not useful in real life.
Qualitative data analysis
Qualitative data are non-numerical data, such as interview answers, article extracts or descriptions.
Thematic analysis involves coding data and grouping codes into themes. A code is a label for a meaningful feature in the data. For example, “stress,” “peer pressure” and “habit” might become themes in interviews about smoking.
Grounded theory builds an explanation from the data rather than starting with a fixed theory. Researchers collect data, code it, compare cases and keep refining the theory until saturation, where new data add little new insight.
Finding themes in smoking interviews
- Read responses and identify meaningful units, such as “I smoke when I’m stressed” or “all my friends vape.”
- Code these as “stress relief” and “peer norms.”
- Group similar codes into broader themes, such as emotional coping and social influence.
- Count themes if needed for quantitative analysis, but keep short quotes to preserve meaning.
Key question: encouraging smoking cessation
A strong key question is: How can society encourage the cessation of smoking?
For AO1, describe relevant concepts: nicotine dependence, reinforcement, withdrawal, social learning, health beliefs and perceived control.
For AO2, apply them. Nicotine-replacement therapy targets biological withdrawal. Public health campaigns can change perceived risk. Smoke-free laws and taxation reduce environmental cues and increase the cost of smoking. Peer-support groups can change social norms.
For AO3, evaluate the balance between effectiveness and freedom of choice. Government intervention can reduce illness and NHS costs, but overly forceful approaches may be seen as paternalistic or may stigmatise smokers. A balanced answer recognises individual responsibility and wider social factors, such as poverty, stress and advertising.
Practical investigation
Content analysis
A content analysis is a systematic method for coding communication, such as newspapers, TV programmes or song lyrics, into categories that can be counted and interpreted.
A suitable Health Psychology practical could be: a content analysis of newspaper articles comparing references to alcohol and nicotine.
Include:
- Research question: Is there an association between substance type and tone of coverage?
- Hypothesis: There will be an association between alcohol or nicotine references and positive or negative tone.
- Method: content analysis of online newspaper articles.
- Sampling: define search terms, date range, newspapers and inclusion criteria.
- Data-collection tool: a coding sheet with operationalised categories.
- Data analysis: frequency table, bar chart and chi-square test.
- Results: state whether the observed chi-square value met the critical value.
- Discussion: explain what the pattern suggests, without claiming media coverage directly causes drug misuse.
- Ethics: use public material respectfully; if using human questionnaires or interviews instead, follow BPS guidance on consent, withdrawal, confidentiality, protection from harm and debriefing.
Strengths include low risk, easy replication and clear quantitative data. Weaknesses include subjective coding, limited samples and possible researcher bias. Improvements could include a larger sample, random date selection, a pilot coding frame and a second coder to check reliability.
In the exam
- Justify the method or test using the design and data type: relationship, difference, association, related groups or unrelated groups.
- For significance, state the level, tail, observed value, critical value and conclusion in the context of the study.
- Always add AO3: ethics, validity, reliability, generalisability, confounding variables and real-world usefulness.
Check yourself
- Which inferential test would you use for a correlation between stress score and cigarettes smoked per week?
- Why might animal drug studies have high control but limited generalisability?
- What ethical issues arise when asking people about illegal or harmful drug use?
