What you'll learn
- How child psychologists use observations, questionnaires and interviews to gather evidence.
- How cross-cultural research and the Strange Situation help test whether attachment is universal.
- How to analyse quantitative and qualitative data, including choosing inferential tests.
- How to apply research methods to your key question and your practical investigation.
The big idea: evidence in child psychology
Child psychology often studies real children, parents, carers and family experiences, so methods must be both scientific and ethical. You need to describe methods for AO1, apply them to child psychology scenarios for AO2, and evaluate strengths, weaknesses and ethics for AO3.
Research method
A research method is the organised way psychologists collect data. In child psychology, common methods include observations of behaviour, questionnaires or interviews with parents/children, and cross-cultural comparisons of attachment.
Quantitative data are numerical data, such as frequency tallies or questionnaire scores. Qualitative data are non-numerical data, such as interview comments or written descriptions of play.
1. Observations in child psychology
An observation is a method where researchers watch and record behaviour. In child psychology, this is useful because young children may not be able to explain their thoughts accurately, but their behaviour can still be recorded.
A researcher might record:
- Quantitative data: tallying how often a child seeks proximity to a caregiver.
- Qualitative data: describing how a child reacts when a parent leaves the room.
Ainsworth and Bell’s (1970) Strange Situation is a classic example: it was a controlled observation of infant-caregiver attachment behaviours during separation and reunion episodes.
Types of observation
A participant observation means the researcher joins the group being studied. A non-participant observation means the researcher watches without joining in.
An overt observation means participants know they are being observed. A covert observation means they do not know. Covert observation can reduce demand characteristics, but it raises serious consent issues, especially with children.
Designing an observation of peer play
- Operationalise “cooperative play” as clear behaviours, such as sharing a toy, taking turns or helping another child, so observers know exactly what to tally.
- Choose a non-participant, overt design in a nursery: the researcher does not join the play, and parents/staff know observation is happening.
- Collect quantitative data by tallying behaviours in fixed time periods, and add brief qualitative notes if context helps explain the behaviour.
Evaluating observations
Observations can have high ecological validity if children are watched in natural settings, such as nurseries or homes. However, observer bias can occur if researchers interpret behaviour according to expectations.
Reliability improves when behaviour categories are clearly operationalised and more than one observer checks the same behaviour. This is called inter-rater reliability.
2. Questionnaires and interviews
A questionnaire is a written set of questions. An interview is a spoken method where questions are asked directly. In child psychology, researchers often question parents, teachers or older children.
Structured, semi-structured and unstructured interviews
A structured interview uses the same fixed questions in the same order. This improves reliability.
A semi-structured interview uses core questions but allows follow-up questions. This balances consistency with depth.
An unstructured interview is more like a conversation. It can produce rich qualitative data but is harder to compare across participants.
Open and closed questions
A closed question gives fixed options, such as “yes/no” or a rating scale. This produces quantitative data.
An open question allows participants to answer in their own words. This produces qualitative data.
Reducing bias in a parent interview
- Use a semi-structured schedule: ask every parent the same core daycare questions, then use neutral follow-ups for detail.
- Combine closed items, such as rating settling-in difficulty, with open items, such as describing one positive daycare experience.
- Phrase questions neutrally to reduce social desirability, for example: “What helped or made settling-in harder?” rather than “Were you a good parent during settling-in?”
Sampling and response issues
A sample is the group of participants studied. The target population is the wider group the researcher wants to generalise to.
Child psychology research often uses opportunity samples, such as parents from one nursery. This is practical but may be unrepresentative.
Social desirability occurs when participants answer in a way that makes them look good. Demand characteristics occur when participants guess the aim and change their responses.
Assuming self-report is automatically truthful
Parents may under-report stress, insecure attachment experiences or daycare concerns because they want to appear caring and competent. Always evaluate questionnaires and interviews for social desirability.
3. Cross-cultural research
Cross-cultural research compares behaviour across different cultures. In child psychology, it is used to test whether attachment patterns are universal or shaped by cultural child-rearing practices.
The Strange Situation has been used across cultures to compare attachment types: secure, insecure-avoidant and insecure-resistant. Van IJzendoorn and Kroonenberg (1988) carried out a major meta-analysis of cross-cultural Strange Situation studies.
Meta-analysis
A meta-analysis is a review that combines data from several studies to look for an overall pattern. It can be powerful because it uses a larger combined sample than one single study.
Van IJzendoorn and Kroonenberg found secure attachment was generally the most common type, which supports some universality. However, variation within cultures was often greater than variation between cultures, so attachment is not simply “the same everywhere”.
Nature, nurture and design issues
The nature-nurture debate asks whether behaviour is mainly influenced by biology or by experience. If attachment types appear similar across cultures, this may support nature-based explanations. If they vary with child-rearing practices, this supports nurture.
A cross-sectional design compares different groups at one point in time. It is quicker but may confuse cultural differences with other factors. A longitudinal design follows the same participants over time. Schaffer and Emerson (1964), for example, used longitudinal methods to study attachment development.
Drawing a cross-cultural conclusion
- If secure attachment is the most common type in many countries, this supports the idea that caregiver attachment may be a universal feature of development.
- If avoidant or resistant attachment rates differ greatly between cultures, this suggests cultural practices influence how attachment behaviours are expressed.
- A balanced conclusion is therefore: “Attachment may be universal, but Strange Situation classifications can be affected by cultural norms.”
4. Ethics when researching children
Ethics are especially important because children are a vulnerable group. The BPS Code of Ethics and Conduct (2009) highlights consent, deception, right to withdraw, protection from harm, confidentiality and debriefing.
The UN Convention on the Rights of the Child (UNCRC, 1989) adds that children have rights to protection, privacy, participation and having their best interests considered.
For children, researchers usually need:
- parental or guardian consent;
- the child’s own assent where possible;
- the right to withdraw without pressure;
- protection from distress;
- confidential handling of data;
- a clear debrief for parents and children.
Thinking parental consent is enough
Parental consent matters, but researchers should still respect the child’s own signs of discomfort or refusal. A child who becomes distressed should not be pushed to continue.
5. Descriptive analysis of quantitative data
Descriptive statistics summarise what your sample did. They do not prove whether findings generalise beyond the sample.
Measures of central tendency
The mean is the arithmetic average. The median is the middle score when data are ordered. The mode is the most common score.
A normal distribution is a symmetrical bell-shaped pattern where mean, median and mode are similar. A skewed distribution has a long tail, so the mean can be pulled by extreme scores. In skewed data, the median may better represent the typical score.
Measures of dispersion
Dispersion means spread. The range is the highest score minus the lowest score. The standard deviation measures how spread out scores are around the mean.
Summarising observed secure-base behaviours
- Suppose five children show these numbers of secure-base behaviours in a five-minute observation: 2, 4, 4, 7, 8. Calculate the mean: xˉ=2+4+4+7+85=5\bar{x} = \frac{2+4+4+7+8}{5}=5xˉ=52+4+4+7+8=5.
- Calculate the range by subtracting the lowest score from the highest score: 8−2=68-2=68−2=6.
- For standard deviation, subtract the mean from each score, square the deviations, and sum them: 24. The sample standard deviation is s=245−1=6≈2.45s=\sqrt{\frac{24}{5-1}}=\sqrt{6}\approx 2.45s=5−124=6≈2.45.
Frequency tables, bar charts and histograms
A frequency table shows how often each category or score occurs. A bar chart is used for separate categories, such as attachment type. A histogram is used for continuous or grouped numerical data, such as hours in daycare.
Bar chart versus histogram
Use a bar chart for categories with gaps between bars. Use a histogram for continuous grouped scores, where the bars touch because the intervals join together.
6. Inferential statistics
Inferential statistics help decide whether a result is likely to be due to chance. You compare an observed value, calculated from your data, with a critical value from a table.
The usual significance level is p≤.05p \le .05p≤.05, meaning there is a 5% or lower probability that the result occurred by chance. A more lenient level is p≤.10p \le .10p≤.10; a stricter level is p≤.01p \le .01p≤.01.
Use this decision tree when choosing a test for your practical investigation.
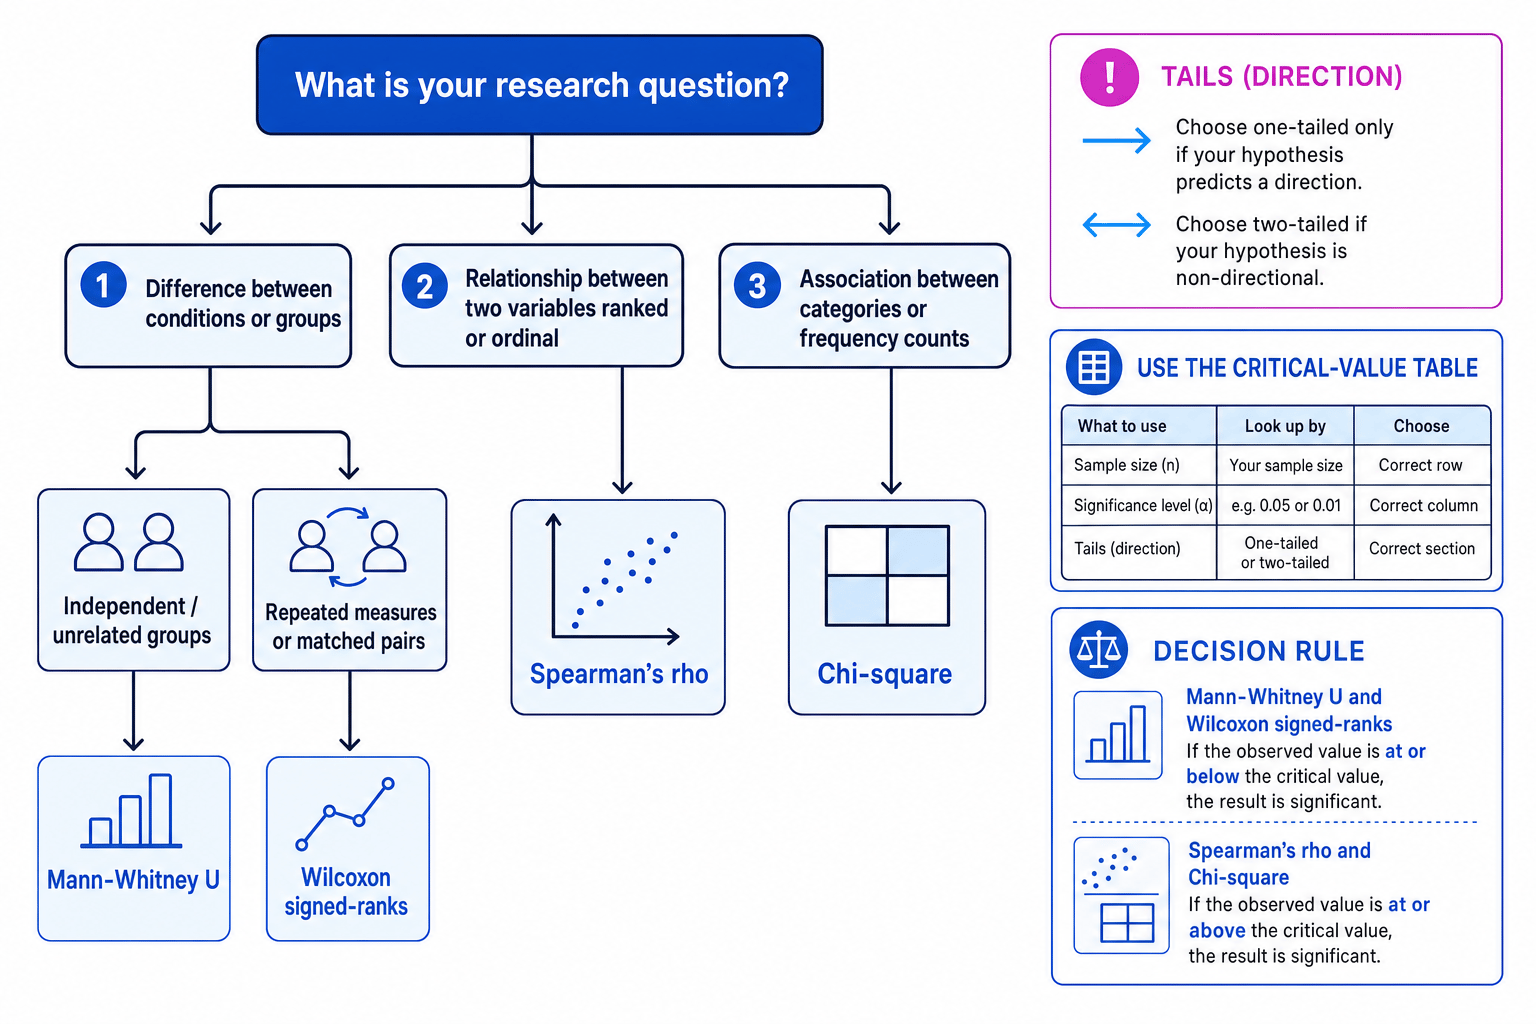
Which test do you use?
- Mann-Whitney U: difference between two independent groups, such as daycare vs home-care children on an independence score.
- Wilcoxon signed-ranks: difference between related conditions, such as the same children before and after starting nursery.
- Spearman’s rho: correlation between two ranked or ordinal variables, such as attachment questionnaire score and adult relationship quality score.
- Chi-square: association between categories or frequencies, such as daycare type and attachment classification.
For Mann-Whitney U and Wilcoxon, the observed value must usually be equal to or less than the critical value. For Spearman’s rho and chi-square, the observed value must usually be equal to or greater than the critical value. For Spearman’s rho, compare the size of the correlation; the sign shows direction.
A one-tailed test is used when the hypothesis predicts a direction. A two-tailed test is used when the hypothesis predicts a difference or relationship but not the direction.
Interpreting a Spearman result
- A researcher predicts that stronger remembered childhood attachment experiences will be positively related to stronger adult relationship quality, so the hypothesis is directional and a one-tailed test is suitable.
- Both variables are questionnaire scores converted into ranks, so Spearman’s rho is appropriate. The observed result is ρobs=.62\rho_{\text{obs}}=.62ρobs=.62, and the critical table gives ρcrit=.50\rho_{\text{crit}}=.50ρcrit=.50 for the chosen sample size and p≤.05p \le .05p≤.05.
- Compare the values: ∣ρobs∣≥ρcrit\left|\rho_{\text{obs}}\right| \ge \rho_{\text{crit}}∣ρobs∣≥ρcrit. Because .62 is greater than .50, reject the null hypothesis and conclude there is a significant positive correlation.
Type I and Type II errors
A Type I error is a false positive: rejecting the null hypothesis when it is actually true. This is more likely if you use a lenient level such as p≤.10p \le .10p≤.10.
A Type II error is a false negative: failing to reject the null hypothesis when there really is an effect. This is more likely with very small samples or very strict levels such as p≤.01p \le .01p≤.01.
Chi-square and small frequencies
Chi-square becomes unreliable if expected frequencies are too low. If many expected values are below 5, you may need a larger sample or more sensible combined categories.
7. Analysing qualitative data
Thematic analysis means identifying patterns or themes in qualitative data. For example, parent interviews about daycare might produce themes such as “separation anxiety”, “key worker support” and “social confidence”.
Grounded theory is an approach where the theory develops from the data rather than being fully decided in advance. Researchers code data, compare examples, refine categories and build an explanation.
You can turn qualitative data into quantitative data by tallying how often themes occur, but keep short quotes too, because they show meaning and context.
8. Your practical investigation
For 7.5.1, you must conduct one ethical practical using a questionnaire, interview or observation. It must include quantitative data for analysis, although you can start with qualitative responses and code them into categories.
A strong practical write-up includes:
- research question and hypothesis;
- method and design;
- sampling method and participants;
- ethical considerations;
- materials, such as interview schedule or observation checklist;
- data analysis and inferential test;
- results;
- discussion, strengths, weaknesses and improvements.
Suitable child psychology examples include interviewing an adult about attachment experiences and adult relationships, or interviewing a parent of a child under 3 about positive daycare experiences.
A practical route that works well
A semi-structured interview can give rich AO2 material, while closed rating questions can produce scores for Spearman’s rho or Mann-Whitney U. This helps you meet both the qualitative and quantitative requirements.
9. Key question application
For the key question, you apply child psychology to a real issue. The examples in the specification are indicative, not exhaustive.
For “What issues should parents take into account when deciding about daycare?”, you could apply attachment research by considering caregiver sensitivity, stability of care, age of the child, hours in daycare, staff-child ratios and the importance of a key worker. Avoid claiming that daycare is automatically harmful: a better answer weighs quality of care and individual differences.
For “Is international adoption good or bad for a child?”, you could apply deprivation and adoption research, such as Rutter et al.’s longitudinal work with Romanian adoptees. A balanced answer would consider early adoption, recovery, later difficulties, and the ethical importance of stable, sensitive caregiving.
In the exam
- Link every method point to child psychology: attachment, daycare, adoption, Strange Situation or children’s rights.
- For statistics, name the test, justify it using design and level of measurement, then state the observed-critical decision rule.
- In evaluation, cover methodology and ethics: sampling, validity, reliability, social desirability, cultural bias, consent and protection from harm.
Check yourself
- Which inferential test would you use for a relationship between two ranked questionnaire scores?
- Why is covert observation especially problematic when researching children?
- How could you turn open interview answers about daycare into quantitative data?
