What you'll learn
- How correlational research works, including co-variables, scatter diagrams and Spearman’s rho.
- How to choose and interpret descriptive and inferential statistics in psychology.
- How CAT, PET and fMRI scans, twin studies and adoption studies are used in biological psychology.
- How to design your own ethical correlational practical on aggression or attitudes to drug use.
Why research methods matter in biological psychology
Biological psychology often investigates links between the body, brain, genes and behaviour. For example, researchers might ask whether brain activity is related to aggression, or whether age is related to attitudes towards drug use.
Because these topics can be socially sensitive, your conclusions must be careful: a statistical relationship is not the same as proof that biology “causes” behaviour.
The big warning
Biological research can show relationships, differences and patterns, but exam answers should avoid deterministic claims such as “genes cause aggression”. Use cautious language: associated with, linked to, may increase risk of.
Correlational research
A correlation is a statistical relationship between two measured variables.
Co-variables
In correlational research, the two measured variables are called co-variables because neither is manipulated by the researcher.
For example, in a biological psychology practical you might measure:
- co-variable 1: height in centimetres
- co-variable 2: self-rated aggressive tendencies
There is no independent variable or dependent variable here because the researcher has not manipulated anything.
IV and DV
In an experiment, the independent variable is manipulated by the researcher and the dependent variable is measured. In a correlation, you should usually write about co-variables, not IVs and DVs.
Positive, negative and zero correlations
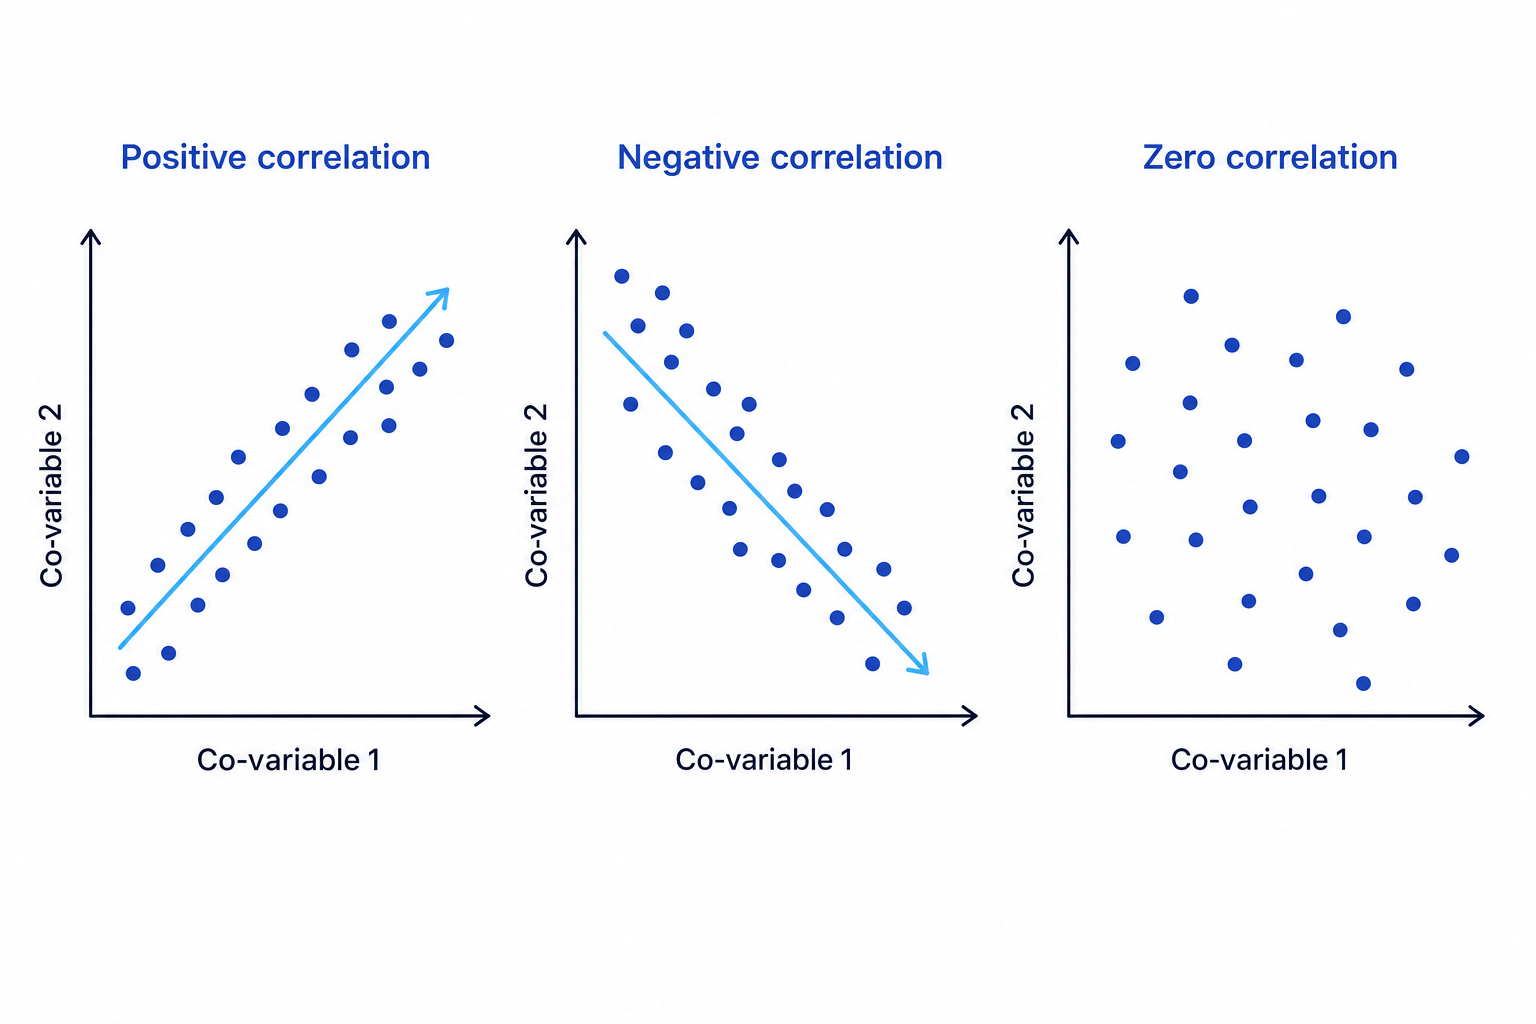
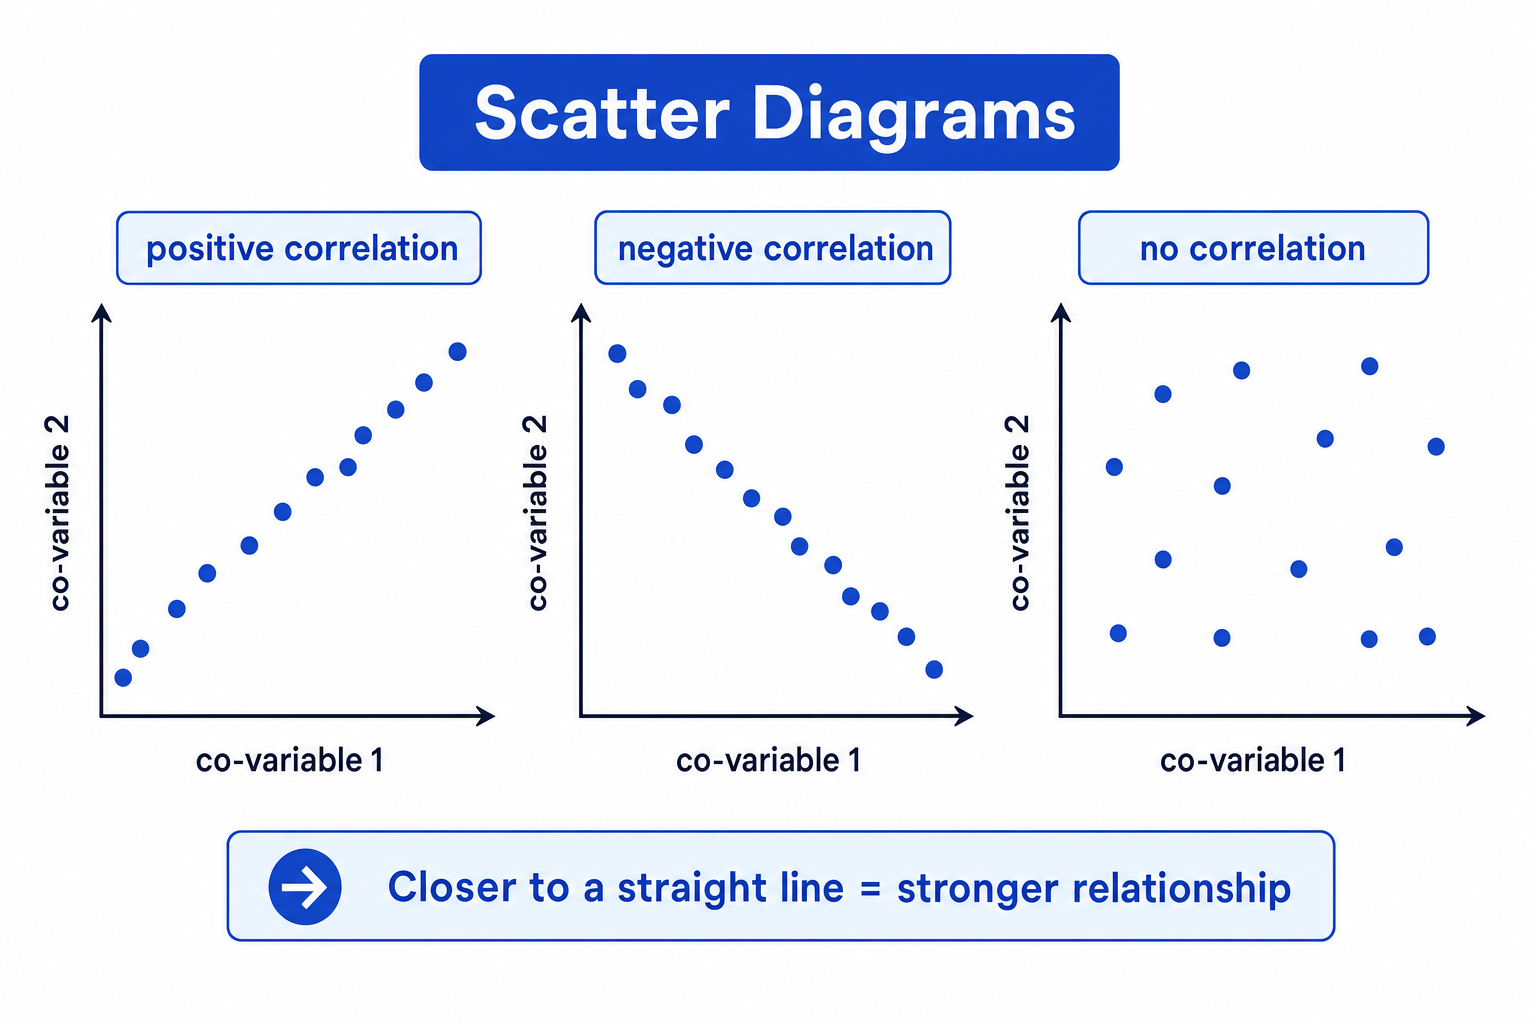
A positive correlation means both co-variables increase together. For example, as age increases, confidence in refusing drugs might increase.
A negative correlation means one co-variable increases as the other decreases. For example, as hours of sleep increase, impulsive aggression scores might decrease.
A zero correlation means there is no clear relationship between the co-variables.
Scatter diagrams help you see the direction and strength of the relationship before doing a statistical test.
Correlation is not causation
If height and aggression scores are correlated, you cannot conclude that height causes aggression. A third variable, such as age, gender, sport participation or social confidence, might explain the relationship.
Hypotheses in correlations and experiments
A hypothesis is a testable prediction.
An alternative hypothesis predicts that there will be a significant relationship or difference. In experiments, this is often called an experimental hypothesis because it predicts the effect of the IV on the DV.
A null hypothesis predicts no significant relationship or difference; any pattern is due to chance.
A directional hypothesis predicts the direction of the result, so it uses a one-tailed test. A non-directional hypothesis predicts a relationship or difference but not the direction, so it uses a two-tailed test.
Writing correlational hypotheses
- Choose the two co-variables: age and attitude-to-drug-use score.
- If previous research suggests older participants will be less approving of drug use, write a directional alternative hypothesis: “There will be a significant negative correlation between age and approval of drug use.”
- Write the matching null hypothesis: “There will be no significant correlation between age and approval of drug use.”
Levels of measurement
Before choosing a statistical test, identify the level of measurement.
- Nominal data: categories, such as smoker/non-smoker or male/female.
- Ordinal data: ordered or ranked data, such as questionnaire ratings from 1 to 10.
- Interval data: numerical data with equal intervals, such as age or reaction time.
Psychology often uses questionnaires, so data are commonly ordinal. That is one reason Spearman’s rho is useful.
Analysing correlational data: Spearman’s rho
Spearman’s rho
Spearman’s rho is an inferential statistical test used to test the strength and direction of a correlation between two co-variables, usually when the data are ordinal or can be ranked.
The symbol for Spearman’s rho is rsr_srs. Values range from -1 to +1:
- close to +1: strong positive correlation
- close to -1: strong negative correlation
- close to 0: weak or no correlation
Spearman’s rho is a non-parametric test, meaning it does not assume the data are normally distributed.
Normal and skewed distributions
A normal distribution is symmetrical around the mean. A skewed distribution is lopsided, often because of extreme scores. Skewed psychological data often make non-parametric tests more appropriate.
Calculating and interpreting Spearman’s rho
- Rank each participant’s score on co-variable 1 and co-variable 2. For each participant, find the difference between ranks, called ddd.
- Square each rank difference and add them. Suppose there are 10 participants and ∑d2=30\sum d^2 = 30∑d2=30.
- Substitute into the formula:
- Compare the observed value, .818, with the critical value from a Spearman’s rho table. If the two-tailed critical value at p≤.05p \le .05p≤.05 is .648, then .818 is larger, so the result is significant.
- Conclude carefully: there is a significant positive correlation between the two co-variables, but this does not prove cause and effect.
Statistical significance and errors
A result is statistically significant if it is unlikely to have occurred by chance. The usual psychology level is p≤.05p \le .05p≤.05, meaning there is a 5% or lower probability that the result is due to chance.
Sometimes researchers use p≤.10p \le .10p≤.10, which is more lenient, or p≤.01p \le .01p≤.01, which is stricter.
Type I and Type II errors
A Type I error is a false positive: the researcher rejects the null hypothesis when it is actually true. A Type II error is a false negative: the researcher accepts the null hypothesis when there really is an effect or relationship.
A stricter level such as p≤.01p \le .01p≤.01 reduces the risk of a Type I error but increases the risk of a Type II error.
Choosing the right inferential test
For Edexcel, you should know when the named tests apply:
- Spearman’s rho: correlation between two co-variables.
- Mann-Whitney U: test of difference using independent groups.
- Wilcoxon signed-ranks: test of difference using repeated measures or matched pairs.
- Chi-square: test of association between nominal categories.
For Spearman’s rho and chi-square, the observed value usually needs to be equal to or greater than the critical value. For Mann-Whitney U and Wilcoxon, the observed value usually needs to be equal to or less than the critical value. Always check the table instructions.
Critical values
In an exam, state the observed value, the critical value, the significance level, whether the test is one-tailed or two-tailed, and whether you reject or retain the null hypothesis.
Descriptive statistics and presenting data
Descriptive statistics summarise data before inferential testing.
Measures of central tendency show the typical score:
- Mean: add scores and divide by the number of scores.
- Median: middle score when ordered.
- Mode: most frequent score.
Measures of dispersion show spread:
- Range: highest score minus lowest score.
- Standard deviation: how far scores tend to spread around the mean.
A frequency table shows how often each score or category occurs. A bar chart is useful for separate categories. A histogram is used for continuous data grouped into intervals, and the bars touch.
If you collect qualitative data, such as short written explanations of attitudes to drug use, you could use thematic analysis. This means reading responses, coding repeated ideas, grouping codes into themes, and checking whether the themes answer the research question.
Other biological research methods: brain scans
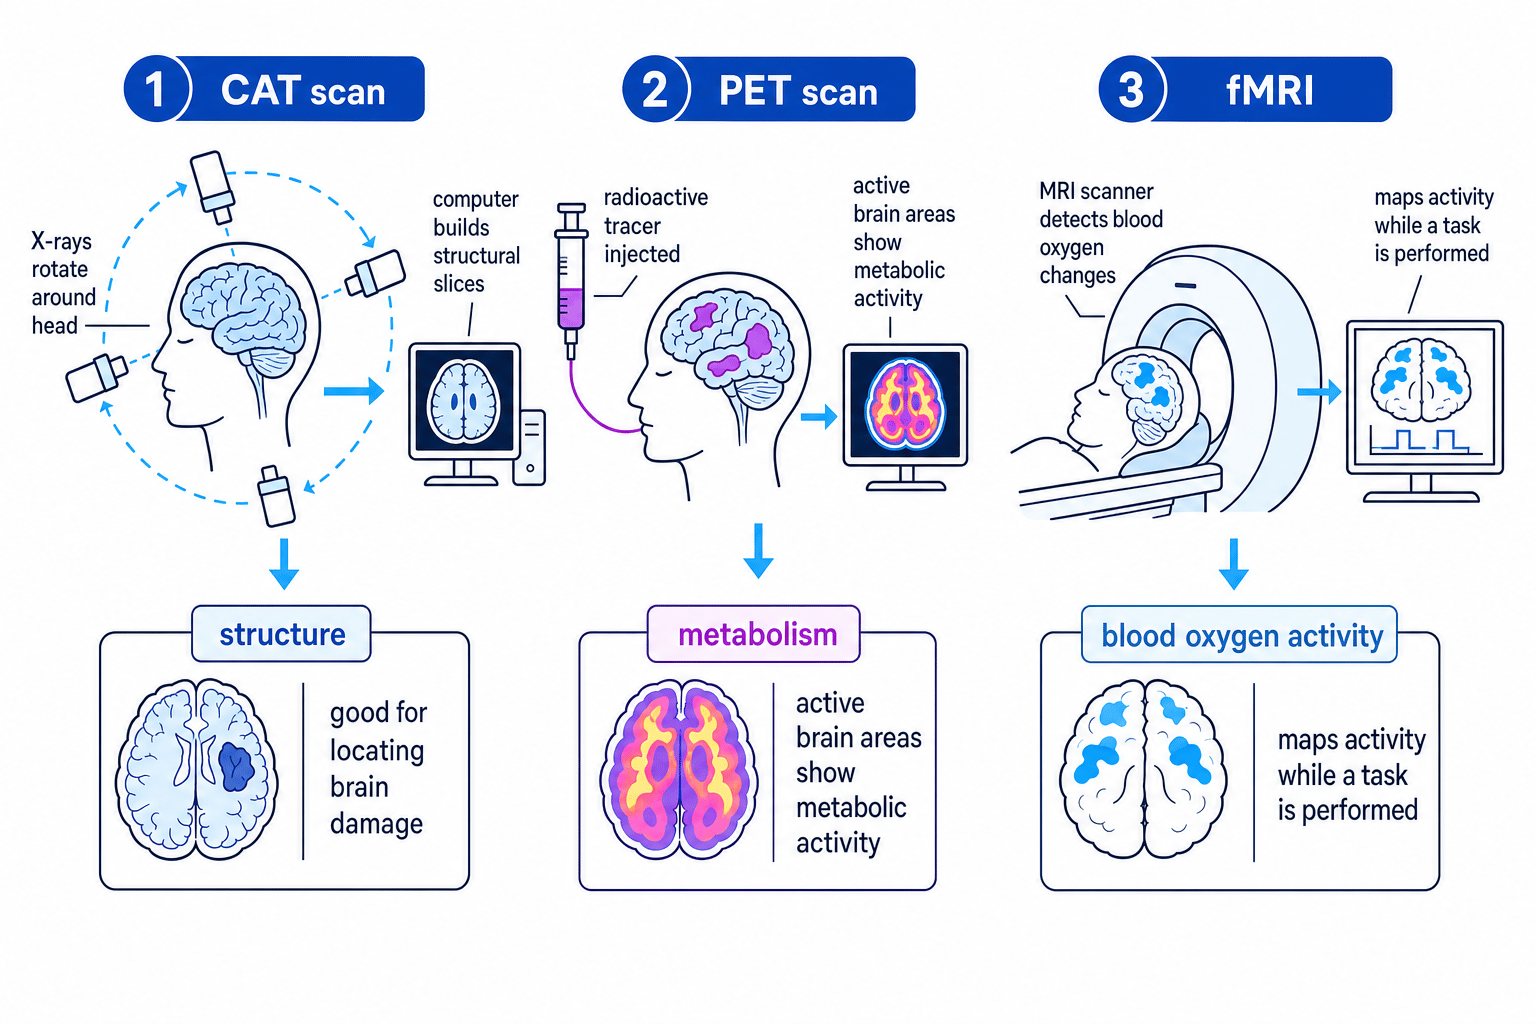
Brain-scanning techniques help psychologists investigate links between brain structure, brain activity and behaviour such as aggression.
CAT scans
A CAT scan uses X-rays to build a structural image of the brain. It is useful for identifying damage, tumours or abnormalities.
PET scans
A PET scan uses a radioactive tracer to show metabolic activity in the brain. More active areas use more energy.
fMRI scans
An fMRI scan detects changes in blood oxygenation while a person performs a task. It gives a dynamic picture of brain activity.
Brain scans can be applied to aggression research. For example, lower activity in areas involved in impulse control might be linked to aggressive behaviour. However, scans do not automatically explain why that pattern exists.
Over-interpreting brain images
Brain scans look objective, but researchers still make decisions about tasks, comparison groups, statistical thresholds and interpretation. A colourful scan is not proof of a simple biological cause.
Ethically, scanning studies must follow the BPS Code of Ethics and Conduct (2009): informed consent, protection from harm, confidentiality, right to withdraw and debriefing. PET scans also raise extra ethical issues because of radioactive tracers.
Twin and adoption studies
A twin study compares monozygotic twins, who share 100% of their genes, with dizygotic twins, who share about 50%. If monozygotic twins are more similar for a behaviour, this suggests genetic influence.
Gottesman and Shields (1966) is a classic example of using twin comparisons to investigate biological contributions to behaviour. Such research is useful because it separates genetic similarity from ordinary sibling similarity, but twins may also share unusually similar environments.
An adoption study compares adopted children with their biological and adoptive relatives. Similarity to biological relatives suggests genetic influence; similarity to adoptive relatives suggests environmental influence.
Ludeke et al. (2013) is a contemporary example of using family/adoption logic to explore inherited influences on social attitudes and behaviour. Adoption designs are valuable, but placement is not always random, and adoptive families may be carefully selected.
Key question: if aggression is nature, not nurture
A suitable key question is: What are the implications for society if aggression is found to be caused by nature rather than nurture?
This matters because biological explanations could influence criminal justice, education, treatment and public attitudes. If aggression is linked to genes, brain functioning or hormones, society might support early screening or medical interventions.
AO3 evaluation is essential here. Biological explanations may reduce blame and increase treatment, but they may also encourage labelling, discrimination and biological determinism. A balanced answer should say that aggression is likely to involve both nature and nurture.
Practical investigation: your correlational study
For this topic, you must be able to design and conduct a correlational study linked to aggression or attitudes to drug use.
A manageable example is: Is there a relationship between age and attitudes towards drug use?
You would need:
- a research question and alternative/null hypotheses
- a sample, such as opportunity sampling from students
- ethical procedures: consent, right to withdraw, confidentiality, protection from harm and debrief
- a data-collection tool, such as a short attitude questionnaire
- descriptive analysis of strength and direction using a scatter diagram
- inferential analysis using Spearman’s rho
- an abstract summarising aim, method, results and conclusion
- a discussion explaining conclusions, strengths, weaknesses and improvements
Practical improvement
If your questionnaire measures aggression or drug attitudes, use clear rating scales and avoid leading questions. This improves validity because the scores are more likely to measure the intended attitude.
In the exam
- Use the correct language: experiments have IVs and DVs; correlations have co-variables.
- When interpreting Spearman’s rho, state direction, strength, significance and the cautious conclusion.
- For AO3, evaluate causation, third variables, sampling, ethics and real-world implications.
Check yourself
- Why can a significant correlation not prove cause and effect?
- When would you use Spearman’s rho rather than Mann-Whitney U?
- What ethical issues might arise in a study about aggression or drug attitudes?