What you'll learn
- How inferential testing helps psychologists decide whether findings are likely due to chance.
- When the sign test is the appropriate statistical test.
- How to calculate the sign test using plus and minus signs.
- How to interpret the result using a critical value and the null hypothesis.
Why do psychologists use inferential tests?
In psychology, researchers usually collect data from a sample — a smaller group of participants — and want to make a judgement about a wider population.
Descriptive statistics, such as means, medians and percentages, summarise what happened in the sample. Inferential statistics go further: they help decide whether the pattern in the sample is strong enough to treat as a real effect, rather than just random chance.
Inferential testing
An inferential test is a statistical procedure used to decide whether an observed effect in sample data is likely to be statistically significant, meaning unlikely to have occurred by chance alone.
The null and alternative hypotheses
Before choosing a statistical test, you need to know what the researcher is testing.
The null hypothesis predicts no real effect or difference. Any pattern in the results is assumed to be due to chance.
The alternative hypothesis predicts that there is a real effect or difference. In AQA Psychology, this can be:
- Directional: predicts the direction of the effect, such as “scores will be higher after therapy”.
- Non-directional: predicts a difference, but not which way it will go, such as “scores will differ before and after therapy”.
Choosing the correct tail
A psychologist predicts that participants will recall more words in silence than while music is playing.
- The prediction gives a clear direction: silence is expected to produce higher recall than music.
- Because the direction is predicted before collecting the data, the researcher should use a one-tailed test.
- If the hypothesis only said “recall will differ between silence and music”, with no direction, the researcher would use a two-tailed test.
Significance levels and critical values
A result is usually treated as statistically significant if the probability of it happening by chance is less than 5%. This is written as p<0.05p < 0.05p<0.05.
The significance level is the cut-off point for deciding whether a result is unlikely enough to be due to chance. In AQA Psychology, the conventional level is 0.05.
A critical value is the value taken from a statistical table. You compare your calculated test statistic with the critical value to decide whether to reject or fail to reject the null hypothesis.
The decision rule
For the sign test, the calculated value must be equal to or less than the critical value for the result to be significant: S≤critical valueS \le \text{critical value}S≤critical value.
What is the sign test?
The sign test is an inferential test used to see whether there is a significant difference between two related sets of data.
It is called the sign test because it ignores the size of the difference and only looks at the direction of difference:
- A plus sign means the score went up.
- A minus sign means the score went down.
- A zero or tie means there was no change.
Sign test
The sign test is a statistical test of difference used with related data, where the data are treated as nominal because each pair of scores is converted into a plus sign, minus sign or tie.
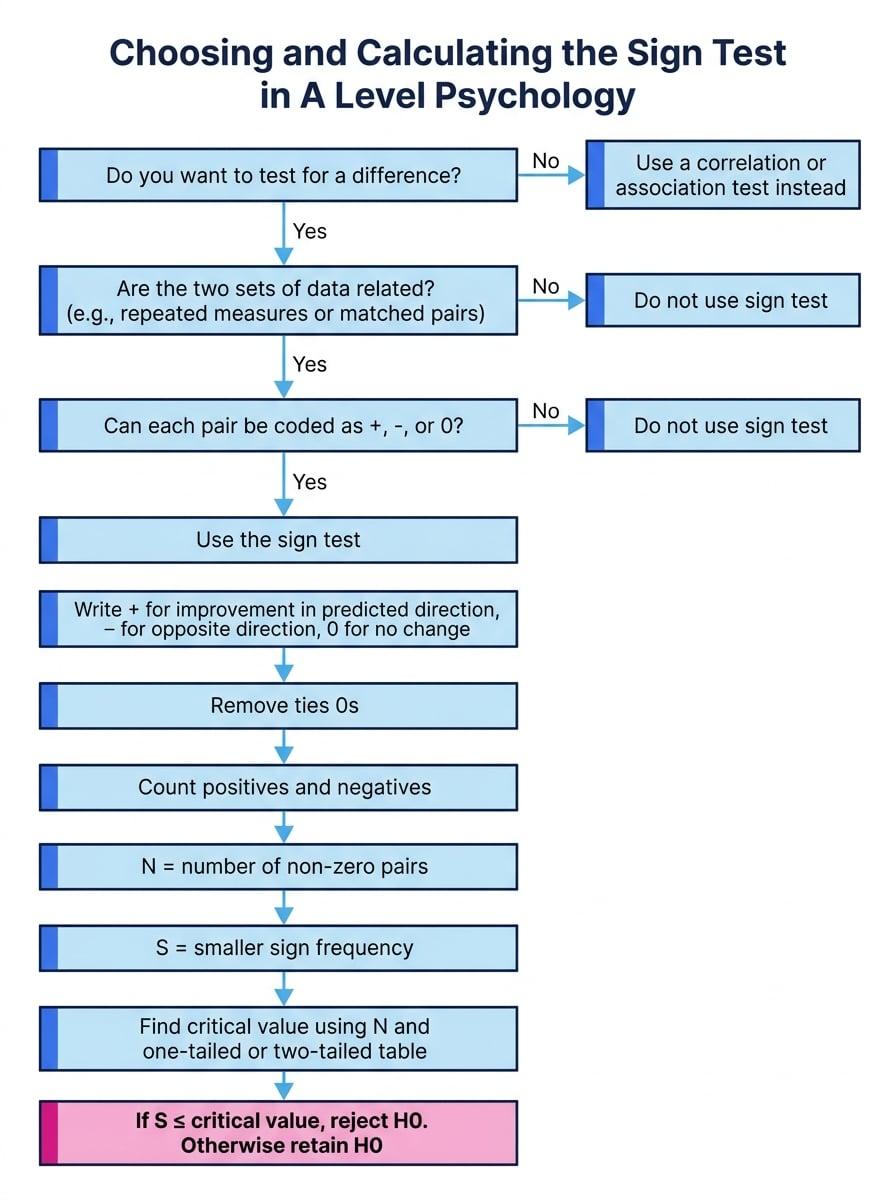
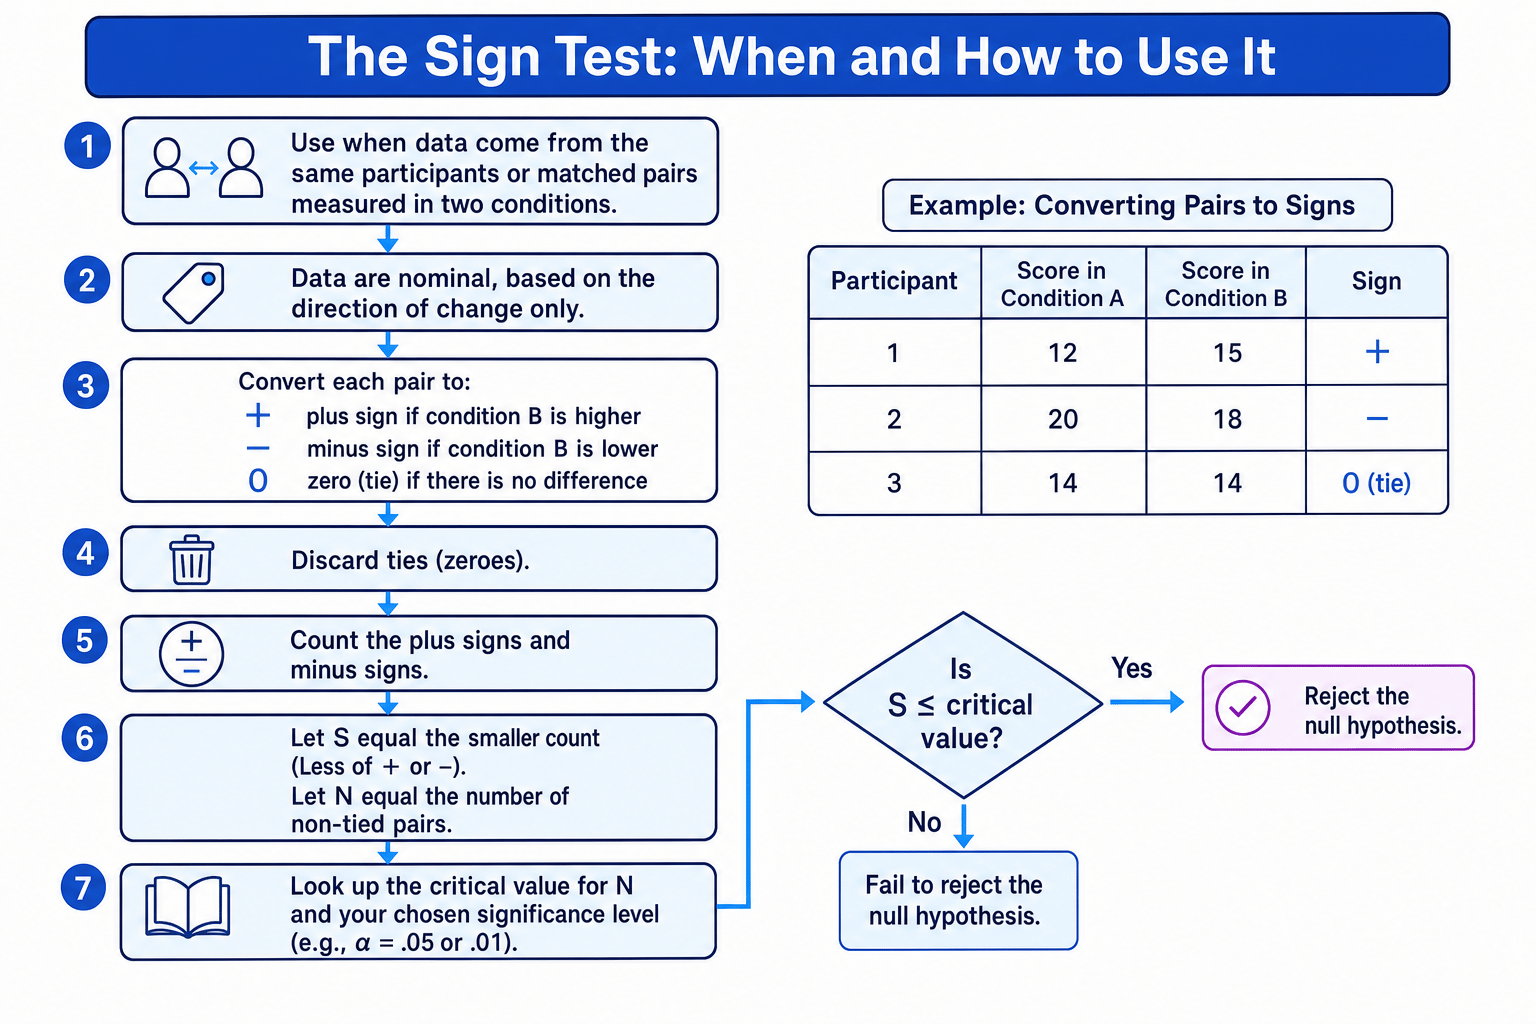
The flowchart below shows the overall logic: paired scores are turned into signs, ties are removed, and the smaller number of signs becomes the calculated value.
When should you use the sign test?
Use the sign test when all of these conditions apply.
1. You are testing for a difference
The sign test is used for a difference, not a correlation or association.
For example, it can test whether anxiety scores differ before and after a relaxation programme. It would not test whether anxiety scores are related to hours of sleep.
2. The design uses related data
The two sets of data must be connected. This usually means:
- Repeated measures design: the same participants are tested in both conditions.
- Matched pairs design: different participants are paired on relevant characteristics, such as age, gender or baseline ability.
3. The data are nominal, or treated as nominal
Nominal data are data in categories. In the sign test, the categories are simply plus, minus and tie.
Even if the original scores are numbers, the sign test reduces them to the direction of change. This makes it simple, but it also means you lose information about the size of each difference.
Choosing the sign test
A researcher tests whether a memory strategy affects recall. The same 12 participants recall words before and after learning the strategy. The researcher records only whether each participant improved, got worse or stayed the same.
- The researcher is testing a difference between before and after the strategy.
- The same participants are used in both conditions, so the data are related.
- The outcome is recorded as improved, worse or unchanged, so the data are nominal.
- The appropriate test is the sign test.
Quick test-choice check
Think: difference + related data + nominal signs = sign test.
How to calculate the sign test
The calculation is quite mechanical once you know the steps.
You compare each participant’s score in condition A with their score in condition B.
- If condition B is higher, record a plus sign.
- If condition B is lower, record a minus sign.
- If the scores are the same, record a zero and remove it from the calculation.
The number of non-tied pairs is called NNN.
The calculated value is called SSS. It is the smaller of the number of plus signs and minus signs.
Calculating the sign test
A psychologist investigates whether a revision technique affects the number of psychology key terms recalled. The same students are tested before and after using the technique. The hypothesis is non-directional: the technique will affect recall. The test is the sign test, the level of measurement is nominal after coding into signs, and the design is repeated measures.
The signs for 13 students are:
plus, plus, plus, plus, plus, plus, plus, plus, plus, plus, minus, minus, tie
- Remove the tie because it shows no difference between the two conditions. This leaves 12 usable signs, so N=12N = 12N=12.
- Count the signs: there are 10 plus signs and two minus signs.
- Identify the smaller number of signs. The smaller count is two, so S=2S = 2S=2.
- Because the hypothesis is non-directional, use a two-tailed sign-test table at the 0.05 significance level.
- Look up the critical value for N=12N = 12N=12 in the two-tailed 0.05 column. The critical value is 2.
- Apply the sign-test decision rule: S≤critical valueS \le \text{critical value}S≤critical value. Here, 2≤22 \le 22≤2, so the result is statistically significant.
- Reject the null hypothesis and conclude that the revision technique had a significant effect on recall.
Interpreting the result
If the result is significant, you reject the null hypothesis. This means the imbalance between plus and minus signs is unlikely to be due to chance at the chosen significance level.
If the result is not significant, you fail to reject the null hypothesis. This does not prove that the null hypothesis is true; it only means the evidence is not strong enough to reject it.
Accepting the null hypothesis
Do not write “accept the null hypothesis”. In A-Level Psychology, the safer wording is fail to reject the null hypothesis, because a non-significant result does not prove there is no effect.
Direction matters in a one-tailed sign test
If the alternative hypothesis is directional, the majority of signs must be in the predicted direction.
For example, if the hypothesis predicts that therapy will reduce anxiety scores, most scores should go down after therapy. If the result is strongly in the opposite direction, you cannot treat it as supporting the directional hypothesis.
Opposite direction
In a one-tailed sign test, a large imbalance in the opposite direction does not support the alternative hypothesis. It fails to support the specific direction that was predicted.
AO3: Strengths and limitations of the sign test
Strength: simple and useful for nominal data
The sign test is easy to calculate because it only uses plus and minus signs. This makes it useful when the data are categories, such as improved or not improved, rather than detailed numerical scores.
Strength: suitable for related designs
It is appropriate when the same participants are compared across two conditions, or when matched pairs are used. This is helpful in psychological research where researchers often want to measure change, such as before and after an intervention.
Limitation: it loses information
The sign test ignores the size of the difference. A participant improving by one point and a participant improving by 20 points are both just counted as plus signs. This can make the test less sensitive than alternatives such as the Wilcoxon signed-ranks test.
Limitation: ties reduce the sample size
Any pair with no difference is removed. If there are many ties, NNN becomes smaller, making it harder to find a significant result.
Limitation: it only tests two related conditions
The sign test is not suitable for independent groups, correlations, associations, or studies with more than two conditions. Choosing it when the design is unrelated is a serious test-selection error.
How to write up a sign-test conclusion
A strong conclusion should include:
- Whether the result is significant.
- The significance level used.
- Whether the null hypothesis is rejected or not.
- A sentence linking the decision back to the psychological context.
For example: “The calculated value of S=2S = 2S=2 was equal to the critical value of 2 at the 0.05 level, so the result was significant. Therefore, the null hypothesis was rejected and the revision technique had a significant effect on recall.”
In the exam
- Check the test conditions first: the sign test is for a difference, using related data, with data treated as nominal signs.
- Remove ties before counting NNN; do not include zero differences in the calculation.
- Remember the unusual decision rule: for the sign test, the result is significant when SSS is equal to or less than the critical value.
Check yourself
- When would the sign test be more appropriate than a correlation test?
- Why are ties removed before calculating SSS?
- What decision would you make if SSS was greater than the critical value?