What you'll learn
- What probability, significance levels, and p-values mean in psychological research.
- How statistical tables and critical values are used to decide whether a result is significant.
- Why one-tailed and two-tailed tests affect the critical region.
- How Type I and Type II errors happen, and why psychologists try to balance them.
The big picture: why probability matters
In A-Level Psychology, you often learn about studies that compare groups, measure relationships, or test whether an intervention works. The problem is that data always contain some random variation. Two groups might look different just because of chance.
Inferential testing is the process of using a statistical test to decide whether a pattern in the data is unlikely to have happened by chance.
Inferential testing
Inferential testing means using sample data to make a judgement about whether a result is likely to reflect a real effect in the wider population, rather than random chance.
The basic question is:
“If there were really no effect, how likely would it be to get a result at least this extreme?”
This is where probability and significance come in.
Hypotheses: what are we actually testing?
Before using a statistical test, a psychologist writes hypotheses.
Null and alternative hypotheses
The null hypothesis states that there is no real effect, difference, or relationship; any pattern in the data is due to chance. The alternative hypothesis states that there is a real effect, difference, or relationship.
For example, in a memory experiment:
- Null hypothesis: there will be no difference in recall scores between students who use a rehearsal strategy and students who use an imagery strategy.
- Alternative hypothesis: there will be a difference in recall scores between students who use a rehearsal strategy and students who use an imagery strategy.
Directional and non-directional hypotheses
A directional hypothesis predicts the direction of the effect, such as “Group A will score higher than Group B”. This usually leads to a one-tailed test.
A non-directional hypothesis predicts that there will be an effect, but not which way it will go. This usually leads to a two-tailed test.
Writing hypotheses for a memory study
A researcher predicts that students who learn words using imagery will recall more words than students who simply repeat the words aloud.
- The prediction is about a difference because there are two groups being compared.
- The prediction is directional because it says imagery will lead to more recall, not just a different amount of recall.
- The alternative hypothesis could be: “Students using imagery will recall more words than students using rehearsal.”
- The null hypothesis could be: “There will be no difference in recall between the imagery and rehearsal groups; any difference will be due to chance.”
One-tailed or two-tailed?
Use a one-tailed test when the hypothesis predicts a clear direction. Use a two-tailed test when it only predicts a difference or relationship, without saying which direction.
Probability and p-values
A p-value tells you the probability of getting your observed result, or a more extreme result, if the null hypothesis is true.
p-value
A p-value is the probability that the observed result would occur by chance if the null hypothesis were true.
So if a result is reported as p<0.05p < 0.05p<0.05, this means there is less than a 5% probability of obtaining that result by chance if the null hypothesis is true.
It does not mean there is a 95% chance that the alternative hypothesis is true. Psychology rarely proves hypotheses with certainty; it deals in probability and evidence.
Significance levels
A significance level is the cut-off point used to decide whether a result is statistically significant.
The most common significance level in A-Level Psychology is p<0.05p < 0.05p<0.05. This means the researcher is willing to accept a 5% risk of saying there is a real effect when actually the result may be due to chance.
The 5% convention
In psychology, p<0.05p < 0.05p<0.05 is usually treated as the standard level for statistical significance. If the result meets this level, the null hypothesis is rejected.
Sometimes researchers use stricter or more lenient levels:
- p<0.01p < 0.01p<0.01 is stricter and reduces the chance of a false positive.
- p<0.10p < 0.10p<0.10 is more lenient and may be used in exploratory research, but it increases the chance of a false positive.
Significant does not mean important
A statistically significant result is not automatically a large, useful, or meaningful result. It only means the result is unlikely enough under the null hypothesis according to the chosen significance level.
Critical regions and tails
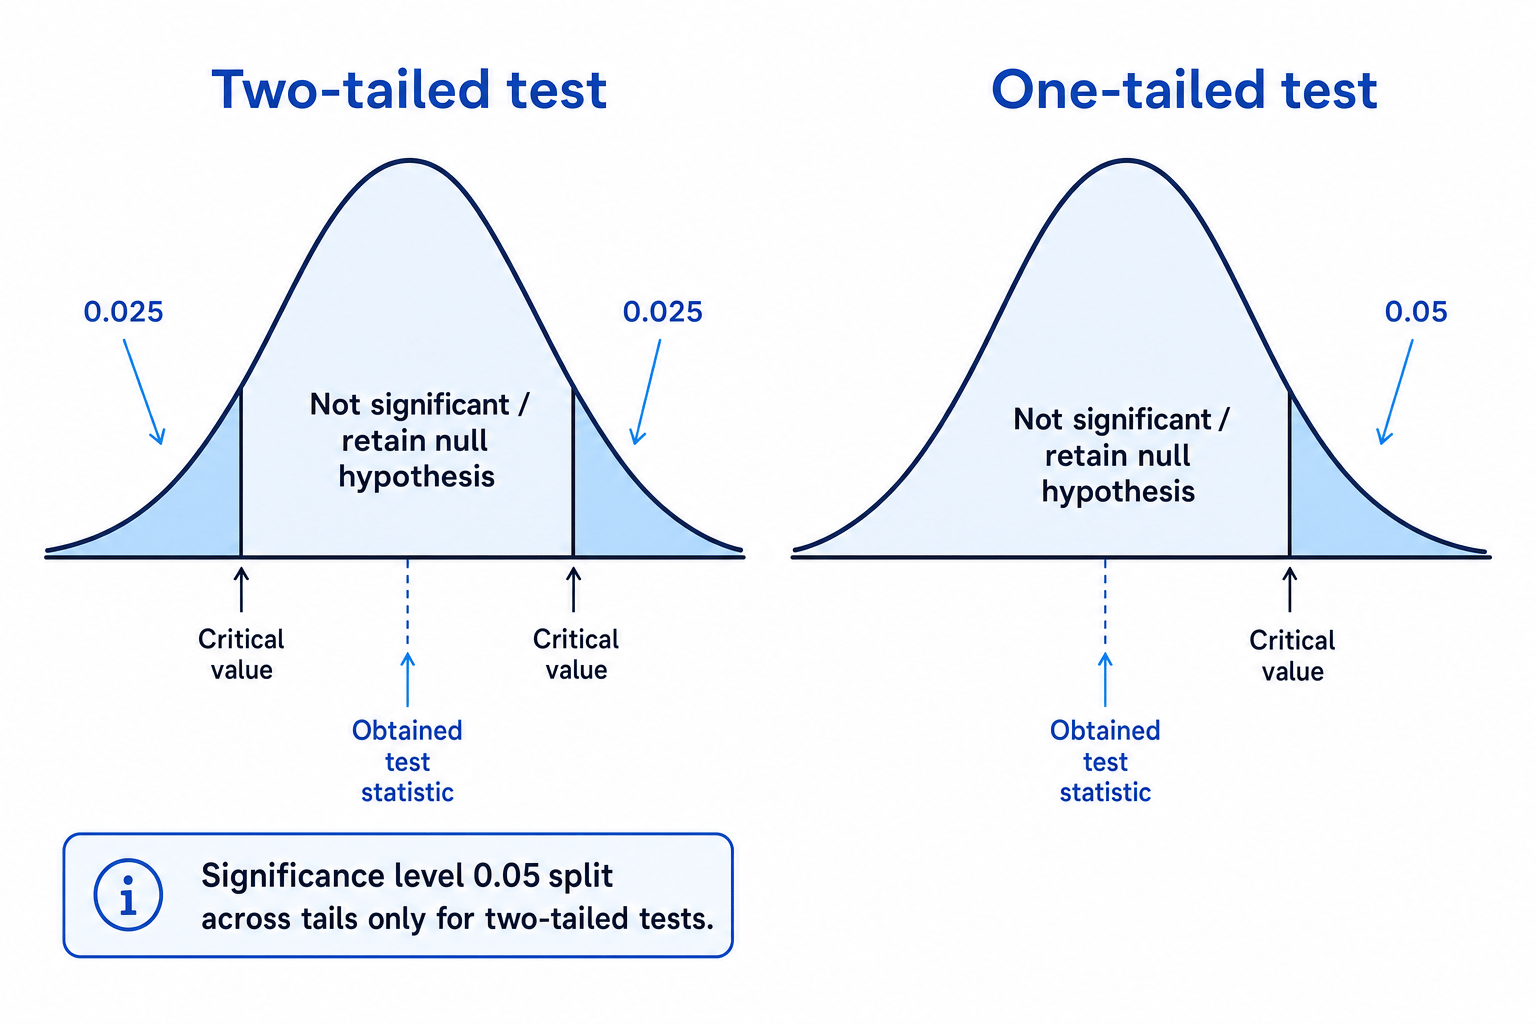
The critical region is the part of the probability distribution where a result is extreme enough to be called significant.
In a two-tailed test, the significance level is split across both ends of the distribution. For p<0.05p < 0.05p<0.05, each tail contains 0.025.
In a one-tailed test, all of the significance level is placed in one tail because the researcher predicted a direction.
Statistical tables and critical values
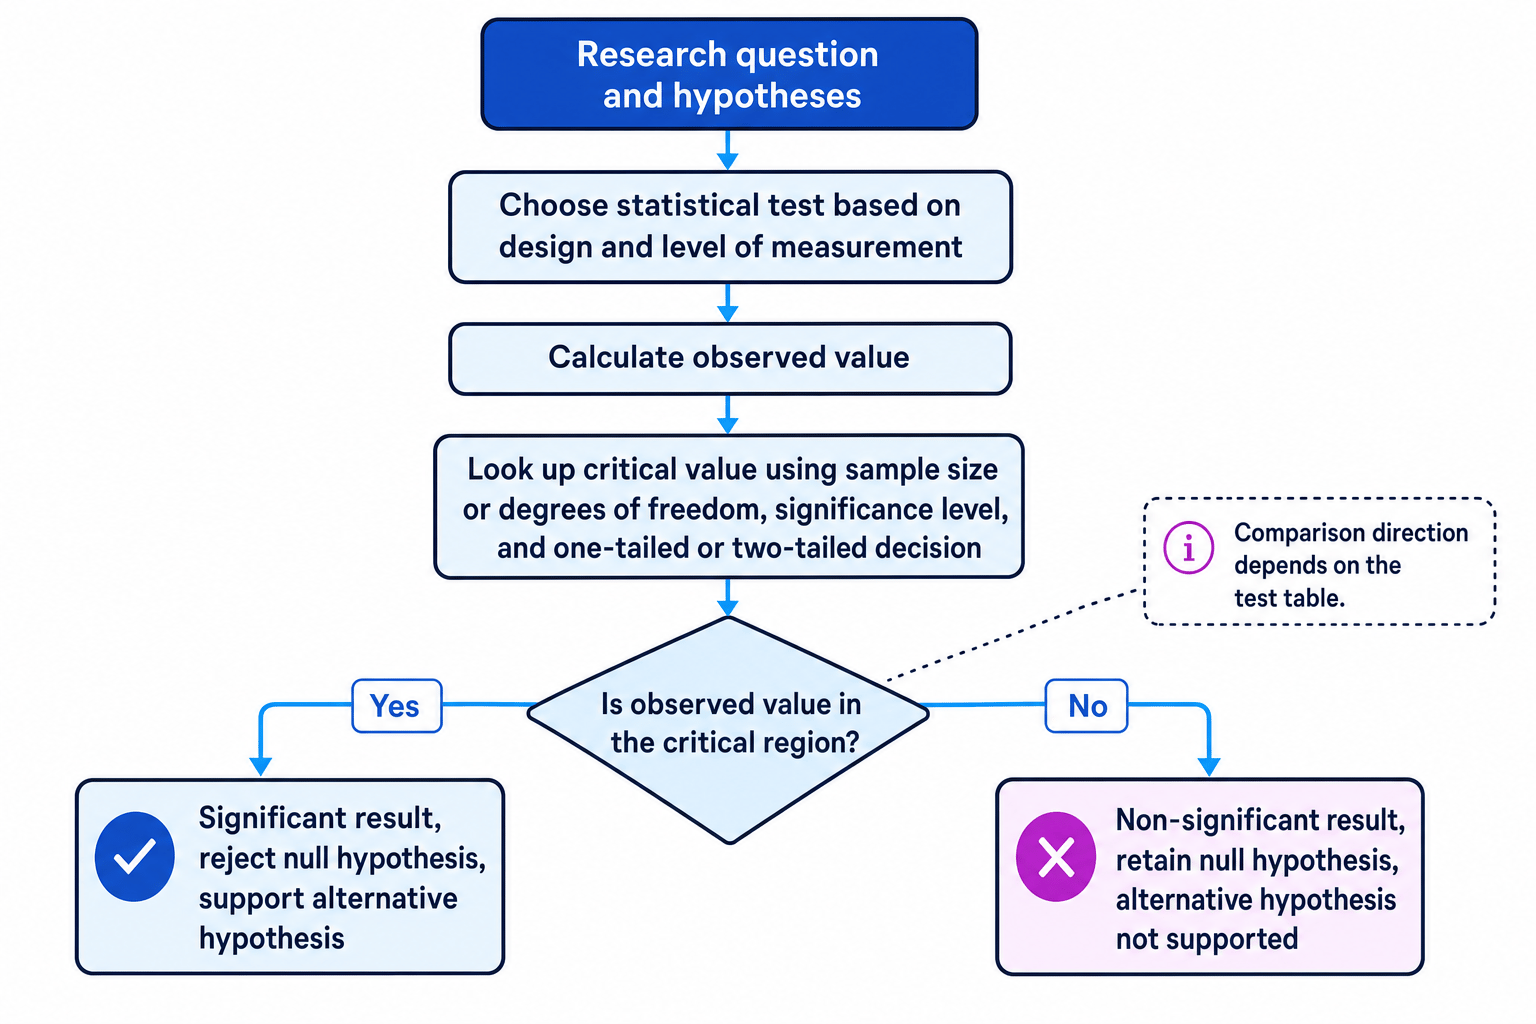
After choosing the correct statistical test, the researcher calculates an observed value. This is the result produced by the statistical test.
The researcher then compares this observed value with a critical value from a statistical table.
Critical value
A critical value is the threshold value from a statistical table that the observed value must reach for the result to be statistically significant.
To find the critical value, you usually need to know:
- the statistical test being used, such as Spearman’s rho, Chi-square, Wilcoxon, Mann-Whitney U, or a t-test
- whether the test is one-tailed or two-tailed
- the chosen significance level, usually p<0.05p < 0.05p<0.05
- the sample size or degrees of freedom
Degrees of freedom are values used in some statistical tests to locate the correct row or column in a statistical table. You do not need to overcomplicate this: in the exam, it usually just helps you find the right critical value.
The comparison rule depends on the test
For some tests, the observed value must be equal to or greater than the critical value to be significant. This applies to tests such as:
- Spearman’s rho
- Pearson’s r
- Chi-square
- related and unrelated t-tests
For other tests, the observed value must be equal to or less than the critical value to be significant. This applies to tests such as:
- Sign test
- Mann-Whitney U
- Wilcoxon signed-ranks test
Using the wrong comparison direction
Do not assume “bigger is always better”. Some statistical tests are significant when the observed value is smaller than or equal to the critical value. Always check the table instructions.
Using a critical value with Wilcoxon
A researcher compares the same 10 participants’ anxiety scores before and after a relaxation programme. The data are ordinal, the design is related, and the researcher predicts anxiety will be lower after the programme. A Wilcoxon signed-ranks test gives an observed value of 8. The relevant table gives a critical value of 10 at p<0.05p < 0.05p<0.05 for a one-tailed test.
- The correct test is Wilcoxon signed-ranks because the design is related and the data are at least ordinal.
- The hypothesis is directional, so the researcher uses a one-tailed test at p<0.05p < 0.05p<0.05.
- For Wilcoxon, the observed value must be equal to or less than the critical value.
- Compare the values: 8 is less than 10, so the result is statistically significant.
- The researcher rejects the null hypothesis and concludes that the relaxation programme significantly reduced anxiety scores.
What a significant result allows you to say
If the result is significant, you reject the null hypothesis. This means the data support the alternative hypothesis.
If the result is not significant, you retain the null hypothesis. At A-Level, you may also see “accept the null hypothesis”, but “retain” is more precise because you have not proved the null hypothesis true; you have simply failed to find enough evidence against it.
Careful wording
A significant result means the alternative hypothesis is supported, not proven. A non-significant result means there is insufficient evidence, not proof that there is no effect.
Type I and Type II errors
Because inferential testing is based on probability, researchers can make errors.
Type I and Type II errors
A Type I error is a false positive: the researcher rejects the null hypothesis even though it is actually true. A Type II error is a false negative: the researcher retains the null hypothesis even though there really is an effect.
You can think of the four possible outcomes like this:
| Researcher’s decision | Reality: no real effect | Reality: real effect exists |
|---|---|---|
| Reject the null hypothesis | Type I error | Correct decision |
| Retain the null hypothesis | Correct decision | Type II error |
Type I error: false positive
A Type I error happens when a researcher concludes that there is a significant effect, difference, or relationship when there is not really one.
This is more likely if the significance level is too lenient, such as p<0.10p < 0.10p<0.10. The researcher is allowing a larger chance of mistakenly rejecting the null hypothesis.
Type II error: false negative
A Type II error happens when a researcher concludes that there is no significant effect, even though a real effect exists.
This is more likely if the significance level is too strict, such as p<0.01p < 0.01p<0.01, or if the study has a small sample, poor controls, unreliable measures, or a weak manipulation.
Identifying error risks
A researcher tests a new therapy for phobias using only eight participants. The result is not significant at p<0.01p < 0.01p<0.01, so the researcher concludes the therapy does not work.
- The researcher has retained the null hypothesis because the result was not statistically significant.
- The significance level is very strict, so it is harder for the result to reach significance.
- The sample size is small, so the study may not have had enough sensitivity to detect a real effect.
- The main risk is a Type II error: wrongly concluding the therapy has no effect when it actually does.
There is a trade-off
Making the significance level stricter reduces the risk of a Type I error, but it increases the risk of a Type II error. Researchers choose a level based on the consequences of each error.
AO3: evaluating significance testing
Strength: it gives an objective decision rule
Statistical significance helps psychologists avoid relying only on personal judgement. Instead of saying “the groups look different”, the researcher uses a recognised test, a table, and a clear decision rule.
This improves scientific credibility because other researchers can check whether the same conclusion should be reached.
Limitation: significance is affected by sample size
A very large sample can make a tiny difference statistically significant, even if it has little real-world value. For example, a memory technique might improve recall by a very small amount but still reach significance in a huge sample.
A very small sample can fail to reach significance even when the effect is meaningful. This increases the risk of a Type II error.
Limitation: the 5% level is conventional
The p<0.05p < 0.05p<0.05 cut-off is widely used, but it is still a convention. There is not a magical difference between a result just below 0.05 and a result just above 0.05.
Good psychologists interpret statistical significance alongside research design, sample size, effect size, reliability, and real-world application.
Ethical and practical implications
Errors can matter in real life. A Type I error might lead psychologists to recommend an intervention that does not actually work. A Type II error might lead them to reject a treatment that could have helped people.
So statistical interpretation is not just a maths skill — it is part of responsible psychological research.
In the exam
- State the significance level, whether the test is one-tailed or two-tailed, and the relevant critical value.
- Say whether the observed value meets the correct decision rule for that test: greater than/equal to, or less than/equal to.
- Link the decision back to the hypotheses: reject or retain the null hypothesis, and say whether the alternative hypothesis is supported.
Check yourself
- What does p<0.05p < 0.05p<0.05 mean in terms of probability and chance?
- Why do some tests require the observed value to be lower than the critical value?
- How are Type I and Type II errors different?
