What you'll learn
- How to choose a statistical test using research aim, level of measurement, and experimental design.
- When to use Spearman’s rho, Pearson’s r, Wilcoxon, Mann-Whitney U, related t-test, unrelated t-test, and Chi-squared.
- How significance level, critical values, and one-/two-tailed hypotheses affect your final decision.
- Common exam traps when applying test choice to research scenarios.
The big idea: the test must fit the data
An inferential statistical test is used to decide whether a pattern in sample data is likely to reflect a real effect in the wider population, rather than just chance variation.
You are usually testing a null hypothesis against an alternative hypothesis.
Null and alternative hypotheses
- The null hypothesis, written as H0H_0H0, predicts no significant difference, relationship, or association.
- The alternative hypothesis, written as H1H_1H1, predicts that a significant difference, relationship, or association will occur.
Most A-Level Psychology questions use a significance level of p<0.05p < 0.05p<0.05. This means the researcher is willing to accept a less than 5% probability that the result occurred by chance if the null hypothesis were true.
Choosing a test is not guesswork
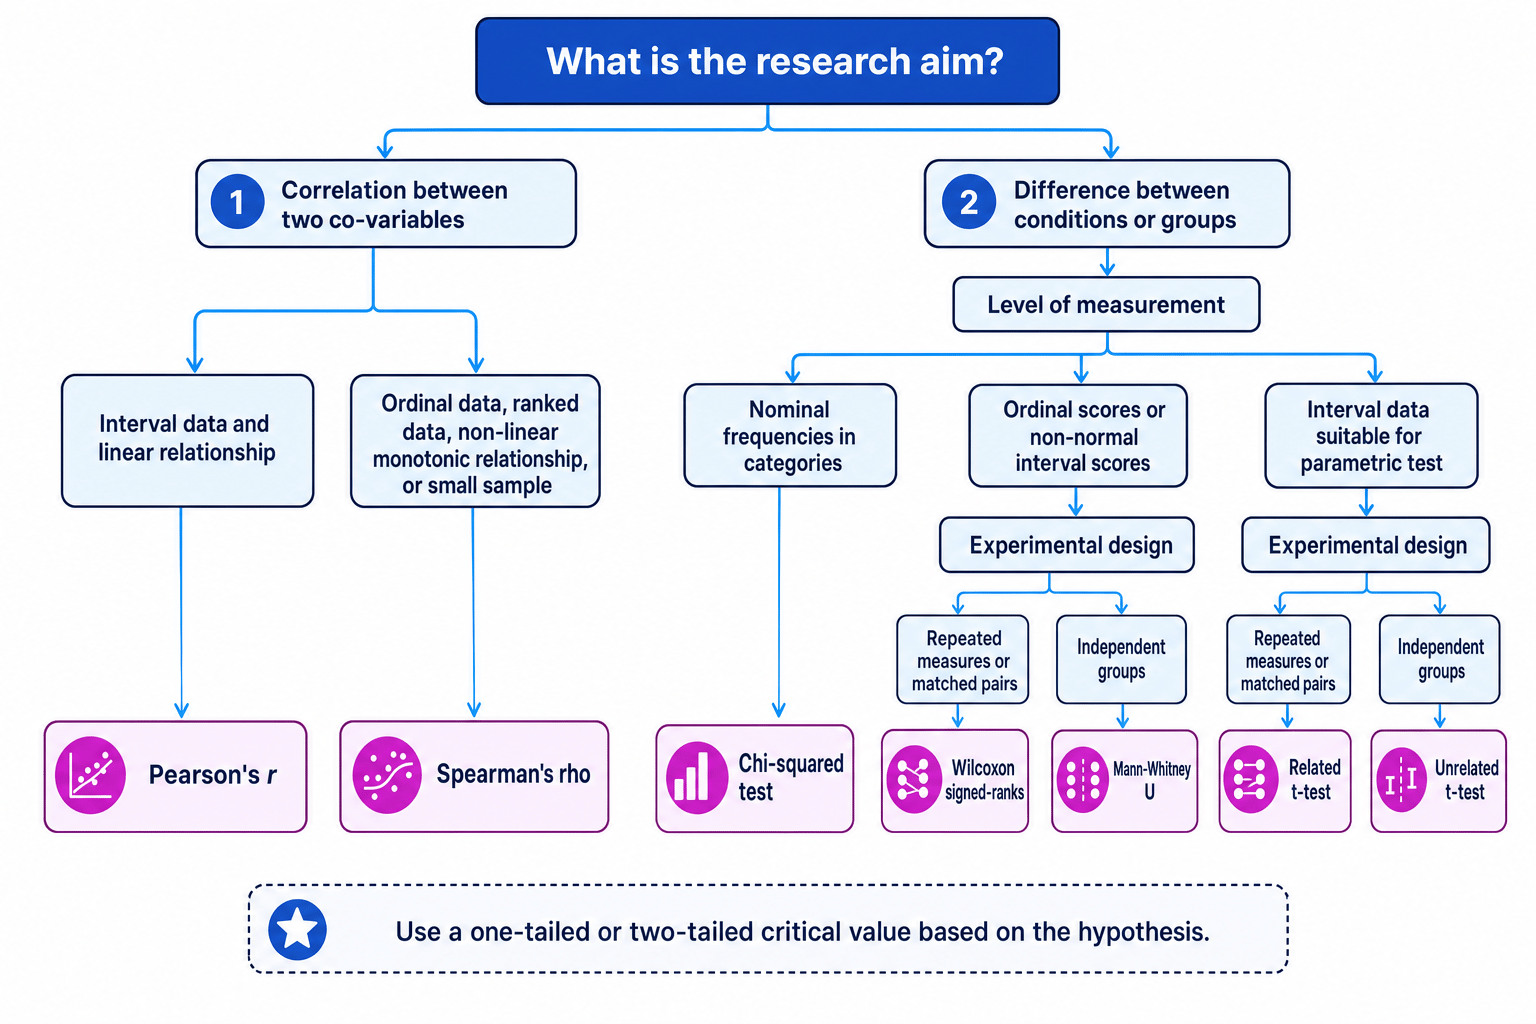
To choose the correct test, ask three questions in order: What is the research aim? What is the level of measurement? What is the experimental design?
Use this decision tree as your overview. You do not need to memorise it as a picture, but you should be able to follow the logic.
Decision 1: What is the research aim?
The first question is whether the researcher is looking for a relationship, a difference, or an association between categories.
Correlation
A correlation investigates whether two co-variables are related. A co-variable is a measured variable in correlational research, such as stress score and sleep quality score.
Use a correlation test when the study asks whether two things go together.
Difference
A test of difference compares scores between conditions or groups. For example, a researcher might compare anxiety scores before and after therapy, or memory scores for two different teaching methods.
Association between categories
Some studies use frequency data, which means counting how many people fall into categories. For example, a researcher might count how many people with different attachment types choose different coping strategies.
Finding the research aim
A researcher measures anxiety before and after a mindfulness programme.
- The measured outcome is anxiety score in two conditions: before and after the programme.
- The aim is to see whether scores change, so this is a test of difference, not correlation.
- Because the same participants are measured twice, the design is related, so the next decision is the level of measurement.
Decision 2: What is the level of measurement?
The level of measurement describes the type of data collected. This matters because some tests need richer, more precise data than others.
Levels of measurement
- Nominal data are categories with no meaningful order, such as attachment type or diagnosis present/absent.
- Ordinal data can be placed in order, but the gaps between values may not be equal, such as ranks or rating-scale positions.
- Interval data use numerical scores where the gaps between values are treated as equal, such as standardised questionnaire scores.
At A-Level, ratio data are usually treated as interval data for test choice, because the key issue is whether the data are numerical with meaningful equal intervals.
Classifying the measurement level
A researcher collects three kinds of data: therapy type chosen, stress ranked from lowest to highest, and a standardised wellbeing score.
- Therapy type chosen is nominal because the categories have no natural order.
- Stress rank is ordinal because the ranks are ordered, but the gap between rank 1 and rank 2 may not equal the gap between rank 9 and rank 10.
- A standardised wellbeing score is treated as interval because the numerical gaps are assumed to be equal.
Do not call all numbers interval data
A rating scale from 1 to 5 is often treated as ordinal unless the question clearly says the scale produces interval-level scores. Numbers alone do not guarantee interval measurement.
Decision 3: What is the experimental design?
The experimental design tells you how participants are arranged across conditions.
Experimental design
- Independent groups: different participants are used in each condition.
- Repeated measures: the same participants take part in every condition.
- Matched pairs: different participants are paired on relevant characteristics, such as age or baseline score. For test choice, matched pairs are treated as a related design.
This is especially important when choosing between Wilcoxon and Mann-Whitney U, or between related and unrelated t-tests.
Parametric and non-parametric tests
A parametric test makes stricter assumptions about the data. In this topic, the main parametric tests are Pearson’s r, the related t-test, and the unrelated t-test. They are usually used with interval data that are suitable for parametric analysis.
A non-parametric test makes fewer assumptions and is often used for ordinal data, ranked data, nominal data, or interval data that do not meet parametric assumptions. These include Spearman’s rho, Wilcoxon signed-ranks, Mann-Whitney U, and Chi-squared.
Parametric tests can be more statistically powerful, meaning they may be better at detecting a real effect. However, if their assumptions are not met, the conclusion may be misleading.
Quick memory hook
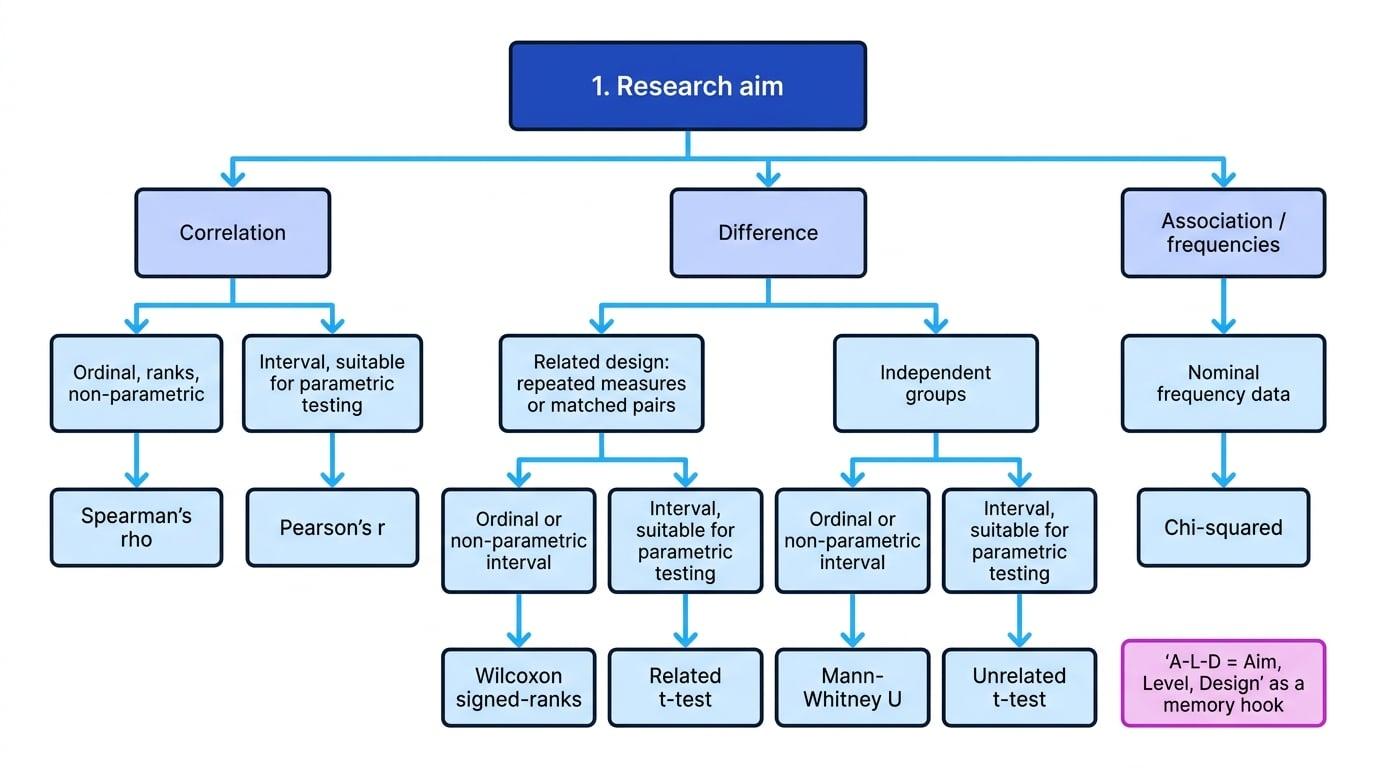
Think A-L-D: Aim, Level, Design. If you can identify those three, the test usually chooses itself.
Which test should you use?
| Test | Use when the aim is... | Level of measurement | Design or data arrangement |
|---|---|---|---|
| Spearman’s rho | Correlation | Ordinal, ranked, or non-parametric data | Paired scores on two co-variables |
| Pearson’s r | Correlation | Interval data suitable for parametric testing | Paired scores on two co-variables |
| Wilcoxon signed-ranks | Difference | Ordinal or non-parametric interval data | Repeated measures or matched pairs |
| Mann-Whitney U | Difference | Ordinal or non-parametric interval data | Independent groups |
| Related t-test | Difference | Interval data suitable for parametric testing | Repeated measures or matched pairs |
| Unrelated t-test | Difference | Interval data suitable for parametric testing | Independent groups |
| Chi-squared test | Association or difference in frequencies | Nominal data | Frequency counts in categories |
The full decision rule
Use Pearson’s r or Spearman’s rho for correlations. Use t-tests, Wilcoxon, or Mann-Whitney U for differences between scores. Use Chi-squared for nominal frequency data.
Interpreting significance after choosing the test
Choosing the test is only part of the job. You also need to know how the researcher decides whether the result is significant.
A critical value is the threshold value from a statistical table. The researcher compares their observed value with the critical value.
Critical value
A critical value is the table value that an observed statistic must reach for the result to be judged significant. The table used depends on sample size or degrees of freedom, the significance level, and whether the hypothesis is one-tailed or two-tailed.
For many tests, such as Pearson’s r, Spearman’s rho, Chi-squared, and t-tests, the observed value usually needs to be equal to or greater than the critical value. For Wilcoxon and Mann-Whitney U, the observed value usually needs to be equal to or less than the critical value.
Always follow the instruction for the specific statistical table you are given.
Choosing and interpreting Spearman’s rho
A researcher investigates whether ranked stress level is related to ranked sleep quality in 12 students. The hypothesis is two-tailed at p<0.05p < 0.05p<0.05. The observed value is rs=0.72r_s = 0.72rs=0.72. Suppose the critical value from the table is 0.59.
- The aim is a correlation because the researcher is testing a relationship between two co-variables.
- The data are ordinal because both variables are ranked, so the correct test is Spearman’s rho, not Pearson’s r.
- The critical value to look up is based on 12 paired scores, a two-tailed hypothesis, and p<0.05p < 0.05p<0.05.
- For Spearman’s rho, the observed value must be equal to or greater than the critical value in magnitude. Here, 0.72≥0.590.72 \ge 0.590.72≥0.59.
- The researcher rejects H0H_0H0 and concludes there is a significant correlation between stress rank and sleep quality rank.
Choosing between Wilcoxon and a related t-test
A researcher compares anxiety scores before and after therapy using the same participants.
- The aim is a difference because the researcher is comparing scores before and after therapy.
- The design is repeated measures because the same participants provide both scores.
- If the anxiety data are ordinal or unsuitable for parametric testing, choose Wilcoxon signed-ranks.
- If the anxiety data are interval and suitable for parametric testing, choose a related t-test.
- For Wilcoxon, the decision rule is usually that the observed value must be equal to or less than the critical value. For a related t-test, the observed t value usually needs to be equal to or greater than the critical value in magnitude.
Special care with Chi-squared
The Chi-squared test is used for nominal data in the form of frequencies. It is not used for mean scores, ranks, or interval data.
For example, if a researcher counts how many participants in different age groups prefer different therapy types, Chi-squared may be appropriate because the data are category counts.
Chi-squared needs frequency data
Use Chi-squared for counts in categories, not percentages or mean scores. The categories should be mutually exclusive, observations should be independent, and expected frequencies should not be very small.
If the same participants are measured before and after using nominal direction data, the Sign test may appear in the wider inferential testing topic. Do not automatically choose Chi-squared just because the data are categorical.
AO3: evaluating test choice
A correct statistical test improves the validity of the conclusion. Validity means the study is measuring or testing what it claims to measure or test.
A poor test choice can increase the risk of a Type I error, where the researcher wrongly rejects the null hypothesis, or a Type II error, where the researcher wrongly accepts the null hypothesis.
There are also limitations to remember:
- Parametric tests can be powerful, but only if their assumptions are reasonable.
- Non-parametric tests are safer for ordinal or skewed data, but may lose information because they often use ranks.
- A significant result at p<0.05p < 0.05p<0.05 does not automatically mean the effect is important in real life.
- Researchers should also consider effect size, which tells us the strength or size of an effect or relationship.
Significant does not mean important
A result can be statistically significant but still have a tiny effect. In evaluation, separate statistical significance from practical significance.
Responsible statistical reporting is also an ethical issue: participants give time and data, so researchers should analyse and report findings honestly rather than choosing tests after the event to chase significance.
In the exam
- Start by stating the aim: correlation, difference, or categorical association/frequencies.
- Identify the level of measurement using the words nominal, ordinal, or interval.
- Identify the design: independent groups, repeated measures, or matched pairs.
- Name the correct test and justify it using all three decisions.
- If interpreting significance, mention the significance level, one-/two-tailed hypothesis, critical value, and correct decision rule.
Check yourself
- A researcher compares ranked aggression scores for two separate groups. Which test should be used?
- Why is Pearson’s r not suitable for ordinal ranked data?
- What three pieces of information help you choose the correct statistical test?