The ppp - VVV diagram (A-level only)
Welcome to the mechanics of gases! When we study engines, refrigerators, or just trapped gases, we care a lot about how their pressure and volume change.
What you'll learn in this topic:
- How to calculate the work done by a gas when it expands at a constant pressure.
- How to interpret pressure-volume (ppp-VVV) diagrams.
- How to estimate work done from a graph by finding the area under the curve.
- Why engines use "cyclic processes" and how to find the net work done per cycle from the area of a loop.
Work done at constant pressure
Imagine a gas trapped in a cylinder with a movable piston. If we heat the gas, it expands and pushes the piston outwards. By pushing the piston, the gas is exerting a force over a distance—which means the gas is doing work.
If the gas expands but the pressure remains completely constant (an isobaric process), we can calculate the work done very simply.
Work done at constant pressure
When a gas changes volume at a constant pressure, the work done WWW is given by:
W=pΔV W = p \Delta V W=pΔVWhere:
- WWW is the work done in joules (J)
- ppp is the constant pressure in pascals (Pa)
- ΔV\Delta VΔV is the change in volume in cubic metres (m3\text{m}^3m3)
If the gas expands (volume increases), ΔV\Delta VΔV is positive, so the gas does work on its surroundings. If the gas is compressed (volume decreases), ΔV\Delta VΔV is negative, meaning work has been done on the gas by the surroundings.
Calculating constant-pressure work
A gas in a cylinder is heated, causing it to expand from a volume of 0.020 m30.020 \text{ m}^30.020 m3 to 0.055 m30.055 \text{ m}^30.055 m3. The pressure remains constant at 1.2×10⁵ Pa1.2 \times 10^5 \text{ Pa}1.2×10⁵ Pa. Calculate the work done by the gas.
- Identify the values given in the question and check their units are standard SI units. Pressure p=1.2×10⁵ Pap = 1.2 \times 10^5 \text{ Pa}p=1.2×10⁵ Pa. Initial volume V1=0.020 m3V_1 = 0.020 \text{ m}^3V1=0.020 m3 and final volume V2=0.055 m3V_2 = 0.055 \text{ m}^3V2=0.055 m3.
- Calculate the change in volume, ΔV\Delta VΔV.
- Apply the work equation W=pΔVW = p \Delta VW=pΔV.
- Calculate the final answer and state the units.
Forgetting to convert units
Volume is often given in litres (L), cm3\text{cm}^3cm3, or dm3\text{dm}^3dm3, and pressure might be in kilopascals (kPa). You must convert them to SI units (m3\text{m}^3m3 and Pa) before multiplying, or your answer will be completely wrong! Remember:
- 1 kPa=1000 Pa1 \text{ kPa} = 1000 \text{ Pa}1 kPa=1000 Pa
- 1 cm3=1×10⁻⁶ m31 \text{ cm}^3 = 1 \times 10^{-6} \text{ m}^31 cm3=1×10⁻⁶ m3
- 1 litre=1 dm3=1×10⁻³ m31 \text{ litre} = 1 \text{ dm}^3 = 1 \times 10^{-3} \text{ m}^31 litre=1 dm3=1×10⁻³ m3
The ppp - VVV diagram
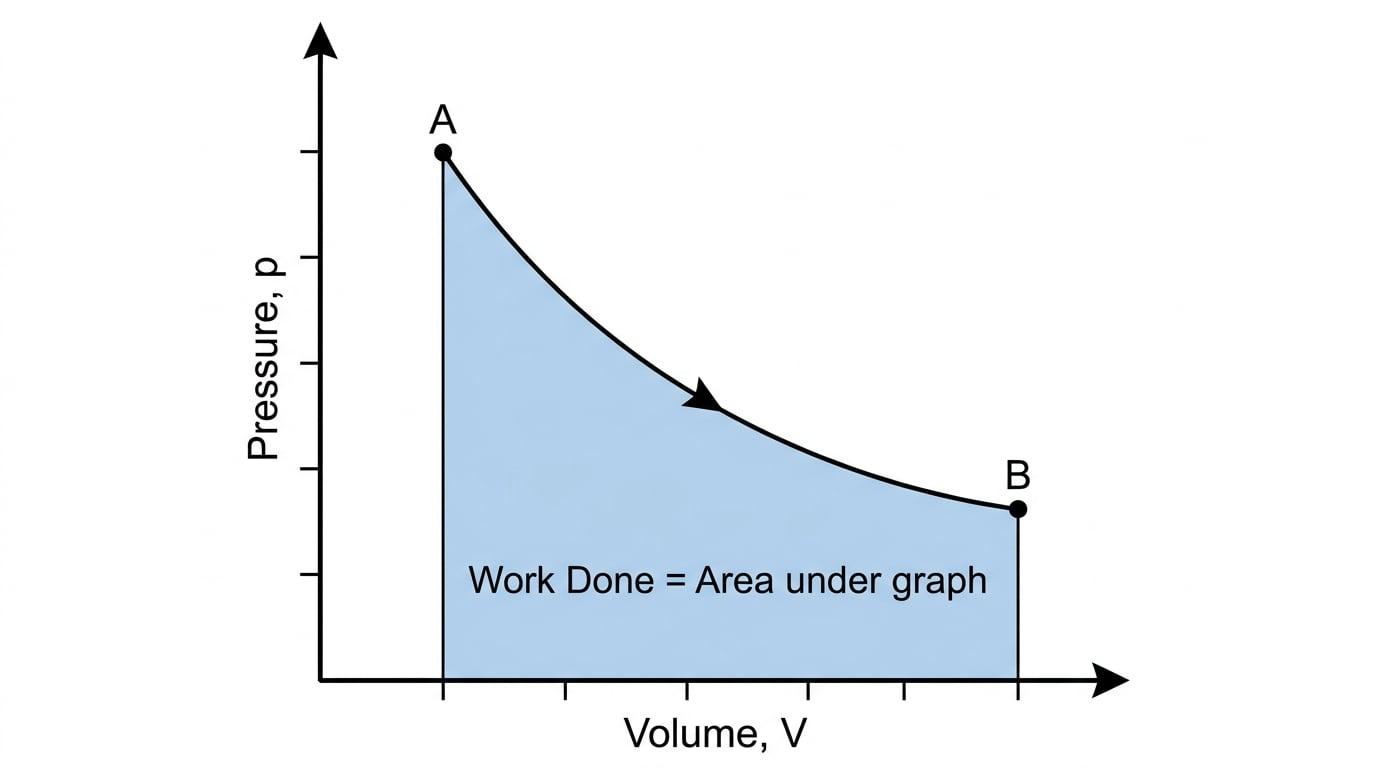
In reality, pressure rarely stays perfectly constant when a gas expands or compresses. To handle changing pressures, we plot a ppp-VVV diagram.
We plot pressure ppp on the y-axis and volume VVV on the x-axis. Any state of the gas is a single point on this graph. As the gas changes state (e.g., expanding as pressure drops), it traces out a line or curve.
Work done is the area under the graph
For any process on a ppp-VVV diagram, the work done by the gas is equal to the area under the line (down to the volume axis).
Why does this work? For a constant pressure, the line is perfectly horizontal, so the area down to the x-axis forms a rectangle. The area of a rectangle is height×width\text{height} \times \text{width}height×width, which is exactly p×ΔVp \times \Delta Vp×ΔV. For a curve, we are essentially adding up millions of tiny rectangular slices.
Because the AQA specification states you don't need complex expressions for curves (like natural logarithms), if you are given a curve, you will have to estimate the work done by counting squares on the graph grid.
How to estimate area by counting squares
To find the area accurately:
- Find the area (and therefore the energy in joules) of one single small square on the grid. Area of 1 square=y-axis width of square×x-axis width of square\text{Area of 1 square} = \text{y-axis width of square} \times \text{x-axis width of square}Area of 1 square=y-axis width of square×x-axis width of square.
- Count the number of full squares completely under the curve.
- Estimate the partial squares (often by counting any square that is more than half-full as 111, and ignoring those less than half-full, or by piecing them together).
- Multiply the total number of squares by the energy of one square.
Estimating work done from a curve
A gas expands, tracing a curve on a ppp-VVV grid. You are asked to estimate the work done. The grid lines have a y-axis spacing of 0.5×10⁵ Pa0.5 \times 10^5 \text{ Pa}0.5×10⁵ Pa and an x-axis spacing of 0.01 m30.01 \text{ m}^30.01 m3. You count approximately 34 squares under the curve.
- Calculate the work equivalent of a single grid square.
- Multiply by your estimated total number of squares.
- State the final estimated work done.
(or 17 kJ17 \text{ kJ}17 kJ).
Cyclic processes
Real engines (like the one in a car) cannot just expand a gas once and stop. They have to run continuously. To do this, the engine must return the gas to its original state so the process can repeat. This forms a cyclic process.
Because the gas returns to its exact starting pressure and volume, a cyclic process forms a closed loop on a ppp-VVV diagram.
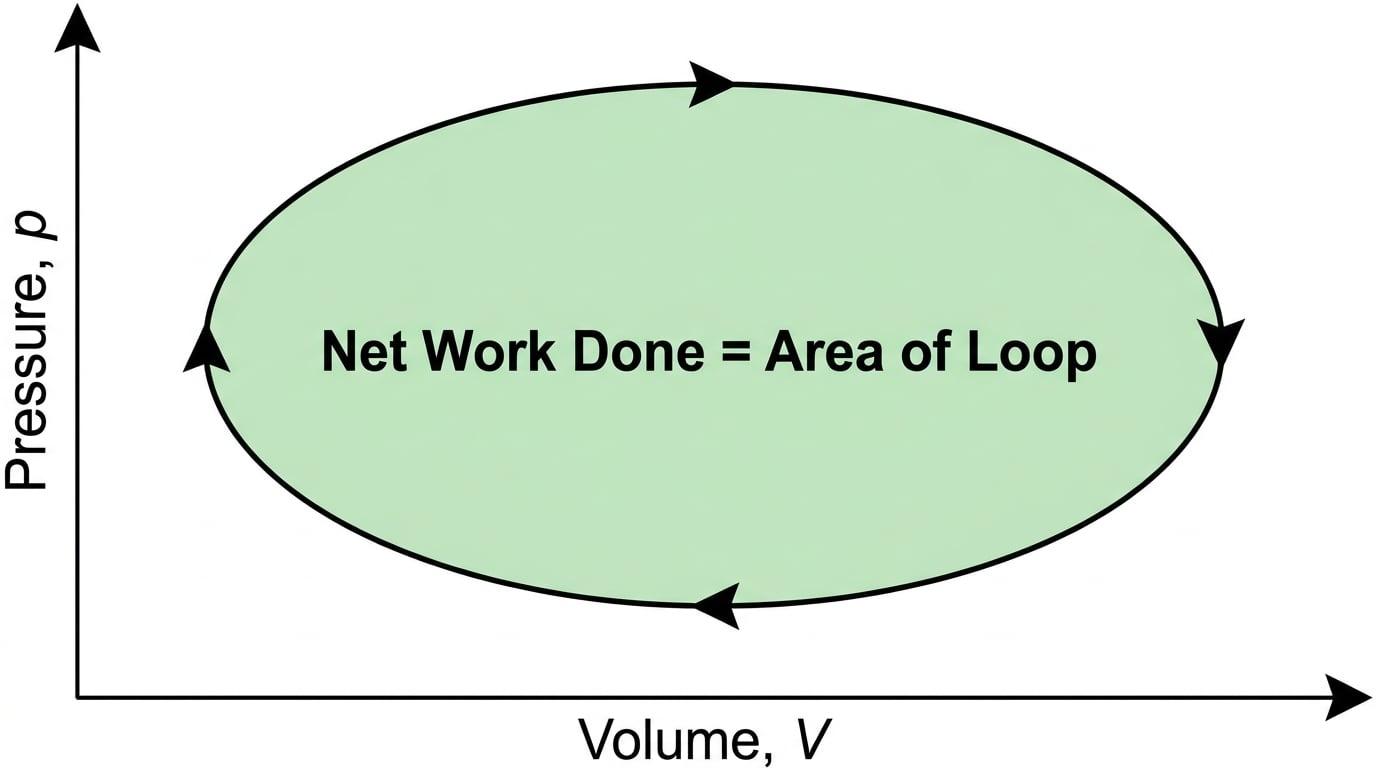
During the cycle, there are two main phases:
- Expansion (moving right): The gas pushes the piston out. The gas does work on the surroundings. (This is the top curve of the loop, which has a large area under it).
- Compression (moving left): The engine pushes the piston back in to reset. The surroundings do work on the gas. (This is the bottom curve of the loop, which has a smaller area under it).
Because the expansion happens at a higher pressure than the compression, the engine outputs more work than it takes to reset it. The difference between the work out and the work in is the net work done per cycle.
Net work from a loop
For a cyclic process, the net work done per cycle is equal to the area inside the closed loop.
If the cycle goes clockwise, the gas does a net amount of work on its surroundings (it's acting as an engine). If the cycle goes anti-clockwise, the surroundings do a net amount of work on the gas (it's acting as a refrigerator or heat pump).
Power of a cyclic engine
An engine undergoes a cyclic process 40 times per second. By counting squares on the ppp-VVV diagram, a student estimates the area of the enclosed loop to be 250 J250 \text{ J}250 J. Calculate the useful output power of the engine.
- Identify the net work done in a single cycle. The area of the loop tells us this directly.
- Identify how many cycles occur in one second. This is the frequency, f=40 Hzf = 40 \text{ Hz}f=40 Hz.
- Calculate the total work done in one second. Since power is work done per second (P=WtP = \frac{W}{t}P=tW), this gives the power directly.
In the exam
- Check the axes carefully: Look at the units on the ppp-VVV diagram. Often, volume is plotted in 10−3 m310^{-3} \text{ m}^310−3 m3 or pressure in MPa (106 Pa10^6 \text{ Pa}106 Pa). You must include these multipliers when finding the area of a square.
- Estimate clearly: If asked to estimate area by counting squares, put a little dot or tick in each square on the exam paper as you count it. The examiner will look for evidence of your counting method.
- Read the direction: Always check the arrows on a loop. Clockwise = engine (work done by gas is positive). Anti-clockwise = refrigerator (work done on gas).
- W=pΔVW = p \Delta VW=pΔV limits: Remember that this formula only applies to straight horizontal lines on the graph (isobaric processes). If the line is sloped or curved, you must use the area under the graph.
Check yourself
- What does the area under a non-cyclic ppp-VVV curve represent?
- Why must an engine process form a closed loop on a ppp-VVV diagram?
- How do you calculate the exact energy value of a single grid square on a ppp-VVV graph?
- If a gas expands at a constant pressure of 200 kPa200 \text{ kPa}200 kPa by a volume of 0.05 m30.05 \text{ m}^30.05 m3, how much work is done?