Engine cycles (A-level only)
Welcome to the physics of internal combustion engines! You've likely heard terms like "four-stroke", "brake horsepower", or "diesel" before. In this topic, we strip away the mechanical jargon to focus purely on the thermodynamics and energy transfers.
What you'll learn:
- How theoretical and real p−Vp-Vp−V diagrams (indicator diagrams) differ for four-stroke petrol and diesel engines.
- How to calculate the power entering an engine from its fuel.
- How to calculate the power developed inside the cylinder (indicated power) and the power delivered at the output shaft (brake power).
- How to calculate thermal, mechanical, and overall engine efficiencies.
1. Theoretical Engine Cycles
Internal combustion engines burn fuel to create high-pressure gas, which pushes a piston to do work. We represent this process using a pressure-volume (p−Vp-Vp−V) diagram, often called an indicator diagram.
To make the complex thermodynamics mathematically manageable, physicists define simplified theoretical cycles (assuming perfect gases, no friction, and instantaneous processes). You need to know the theoretical shapes for two main types:
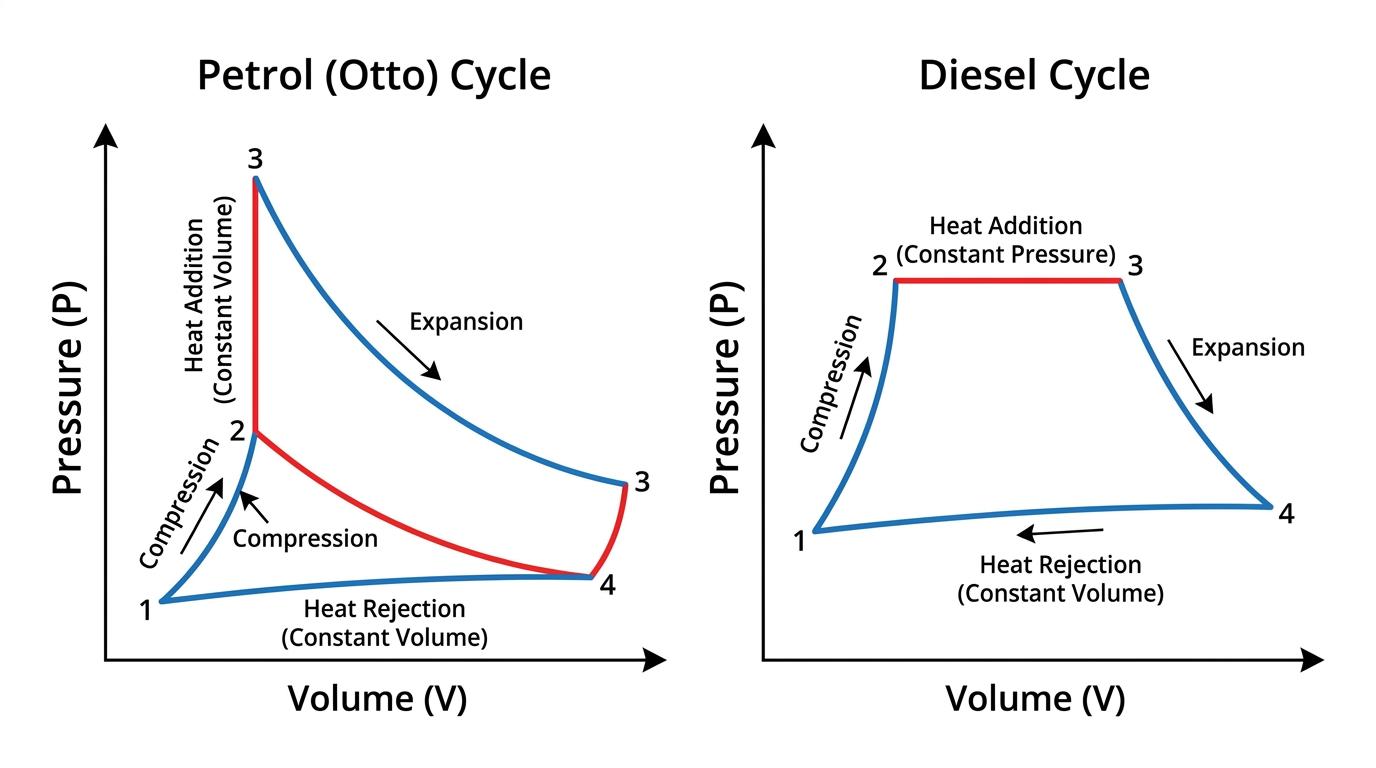
The Petrol Cycle (Otto Cycle)
In a petrol engine, a mixture of air and fuel is drawn into the cylinder, compressed, and then ignited by a spark plug.
- Because the spark ignites the highly flammable mixture almost instantly, combustion happens so quickly that the piston barely has time to move.
- We model this as heating at constant volume. On a p−Vp-Vp−V diagram, this appears as a perfectly vertical line going up.
The Diesel Cycle
In a diesel engine, only air is drawn in and compressed. It is compressed so much that it becomes incredibly hot. Fuel is then injected directly into the hot air, and it spontaneously ignites without a spark plug.
- The fuel burns more slowly as it is injected, continuing to burn as the piston starts moving down.
- We model this as heating at constant pressure. On a p−Vp-Vp−V diagram, this appears as a perfectly horizontal line going right.
2. Real vs Theoretical Indicator Diagrams
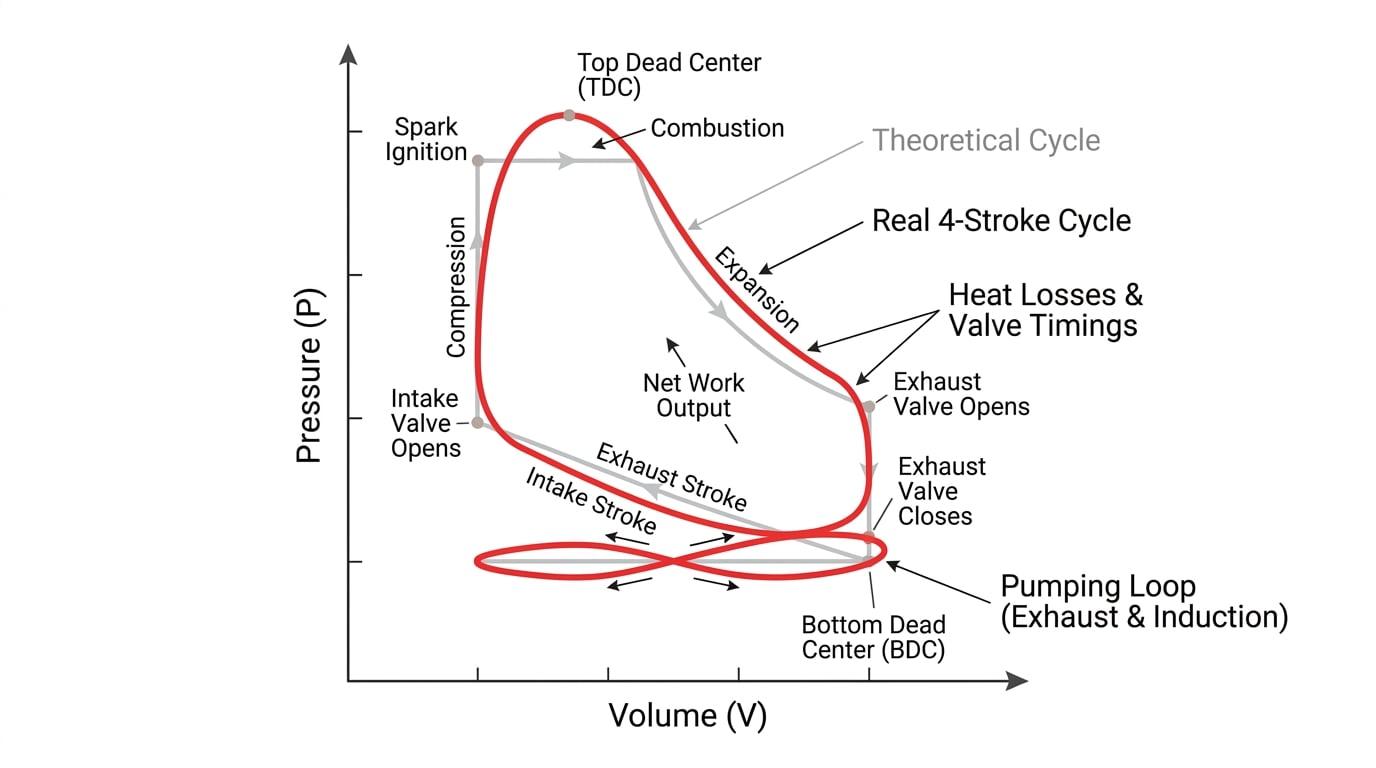
Real engines do not behave perfectly. If you attach a pressure sensor to a running engine, the real indicator diagram looks quite different from the theoretical polygons. You are expected to spot and explain three main differences:
- Rounded corners: Valves take time to open and close, and combustion isn't instantaneous. The sharp corners of the theoretical diagram are smoothed out.
- Lower peak pressure: Heat is lost to the cylinder walls, and combustion is never 100% complete, so the maximum pressure is lower than the theoretical ideal.
- The "Pumping Loop": In theory, drawing in air (induction) and pushing out exhaust happen at exactly atmospheric pressure. In reality, the engine has to do work to suck the air in against friction, and push the exhaust out. This creates a small, negative-work loop at the bottom of the diagram.
3. Power in an Engine
Power is the rate of energy transfer. In an engine, energy flows through three main stages, getting smaller at each stage due to inefficiencies.
Stage 1: Input Power
This is the total chemical energy flowing into the engine per second.
Calorific Value
The calorific value of a fuel is the amount of energy released when a unit mass (or volume) of the fuel is completely burned. It is usually measured in J kg−1\text{J kg}^{-1}J kg−1.
The equation is:
Input power=calorific value×fuel flow rate \text{Input power} = \text{calorific value} \times \text{fuel flow rate} Input power=calorific value×fuel flow rateStage 2: Indicated Power
This is the mechanical power developed inside the cylinders by the expanding gas. It is found directly from the area of the main loop on the indicator (p−Vp-Vp−V) diagram.
The area of one p−Vp-Vp−V loop represents the net work done in one cycle by one cylinder. To find the total power (work per second), we multiply by the number of cycles per second and the number of cylinders:
Indicated power=(area of p−V loop)×(cycles per second)×(number of cylinders) \text{Indicated power} = (\text{area of } p-V \text{ loop}) \times (\text{cycles per second}) \times (\text{number of cylinders}) Indicated power=(area of p−V loop)×(cycles per second)×(number of cylinders)Four-stroke cycles per second
A four-stroke engine takes two full revolutions of the crankshaft to complete one thermodynamic cycle (Induction down, Compression up, Power down, Exhaust up). Therefore:
cycles per second=revolutions per second2 \text{cycles per second} = \frac{\text{revolutions per second}}{2} cycles per second=2revolutions per secondMany students forget to divide by 2!
Stage 3: Brake Power
This is the useful power that actually makes it out of the engine to the drive shaft. It's called "brake" power because it used to be measured by applying a mechanical brake to the engine shaft.
Brake power,P=Tω \text{Brake power}, P = T\omega Brake power,P=TωWhere TTT is the output torque in N m\text{N m}N m, and ω\omegaω is the angular velocity in rad s−1\text{rad s}^{-1}rad s−1.
The Missing Power: Friction
The difference between the power developed in the cylinders (indicated) and the power delivered to the wheels (brake) is lost to internal mechanical friction (e.g., pistons rubbing against cylinder walls, bearings, driving the oil pump).
Friction power=Indicated power−Brake power \text{Friction power} = \text{Indicated power} - \text{Brake power} Friction power=Indicated power−Brake powerCalculating Powers
A 4-cylinder, 4-stroke engine runs at 3000 rev min−13000 \text{ rev min}^{-1}3000 rev min−1. The area of the indicator diagram for one cylinder is 420 J420 \text{ J}420 J. The output torque of the engine is 75.0 N m75.0 \text{ N m}75.0 N m.
Calculate the friction power of the engine.
- Find cycles per second for one cylinder: First, convert revolutions per minute to revolutions per second:
Because it is a 4-stroke engine, there is 1 cycle for every 2 revolutions:
cycles per second=502=25 cycles s−1 \text{cycles per second} = \frac{50}{2} = 25 \text{ cycles s}^{-1} cycles per second=250=25 cycles s−1- Calculate Indicated Power: Use the formula, remembering there are 4 cylinders:
- Calculate Brake Power: First find angular velocity ω\omegaω:
Now calculate P=TωP = T\omegaP=Tω:
Brake power=75.0×314.2=23565 W \text{Brake power} = 75.0 \times 314.2 = 23565 \text{ W} Brake power=75.0×314.2=23565 W- Calculate Friction Power:
4. Efficiencies
Because energy is lost at several stages, we can define three different types of efficiency. Efficiency is always a ratio of "what you get out" to "what you put in".
- Thermal Efficiency: How good the engine is at turning the fuel's chemical energy into mechanical energy in the cylinder. Heat losses to the cooling system reduce this.
- Mechanical Efficiency: How good the engine is at transferring that cylinder energy to the output shaft without losing it to friction.
- Overall Efficiency: The total efficiency of the entire system.
Linking efficiencies
Notice that if you multiply Thermal Efficiency by Mechanical Efficiency, the "indicated power" terms cancel out, leaving you with the Overall Efficiency.
Overall=Thermal×Mechanical \text{Overall} = \text{Thermal} \times \text{Mechanical} Overall=Thermal×MechanicalCalculating Efficiencies
A diesel engine consumes 0.0040 kg s−10.0040 \text{ kg s}^{-1}0.0040 kg s−1 of fuel with a calorific value of 45 MJ kg−145 \text{ MJ kg}^{-1}45 MJ kg−1. The indicated power is 70 kW70 \text{ kW}70 kW and the mechanical efficiency is 85%85\%85%.
Calculate the overall efficiency of the engine.
- Find the input power: Remember to convert MJ to J.
- Find the brake power: Use the mechanical efficiency definition. Since efficiency is 0.850.850.85:
- Calculate overall efficiency:
In the exam
- Watch the units: Calorific values are often given in MJ kg−1\text{MJ kg}^{-1}MJ kg−1 and engine power in kW\text{kW}kW. Convert everything to standard SI units (J\text{J}J, W\text{W}W) before plugging them into formulas.
- Remember the 4-stroke rule: The most common mistake in this topic is using revs per second as cycles per second. For a 4-stroke engine, ALWAYS halve the revolutions per second to get cycles per second.
- Areas by counting squares: If the exam gives you an indicator diagram drawn on a grid, you may have to estimate the area by counting squares. Find the area of one small square in Joules (multiply its ppp width by its VVV height using the axes scales), then multiply by your estimated square count. Don't forget to subtract the area of the negative "pumping loop" if it is large enough to measure!
- Interpretative cycles: The specification notes questions "may be set on other cycles" (like Stirling or Brayton). Don't panic if you see a shape you don't recognise. They will give you all the information you need to find the area (work done) or apply P=TωP=T\omegaP=Tω.
Check yourself
- Can you sketch the theoretical p−Vp-Vp−V diagrams for petrol and diesel cycles, clearly showing constant volume vs constant pressure heating?
- Why is an engine's indicated power always greater than its brake power?
- If an engine runs at 4000 rev min−14000 \text{ rev min}^{-1}4000 rev min−1, how many cycles per second does one cylinder complete?
- What causes the small negative "pumping loop" at the bottom of a real indicator diagram?