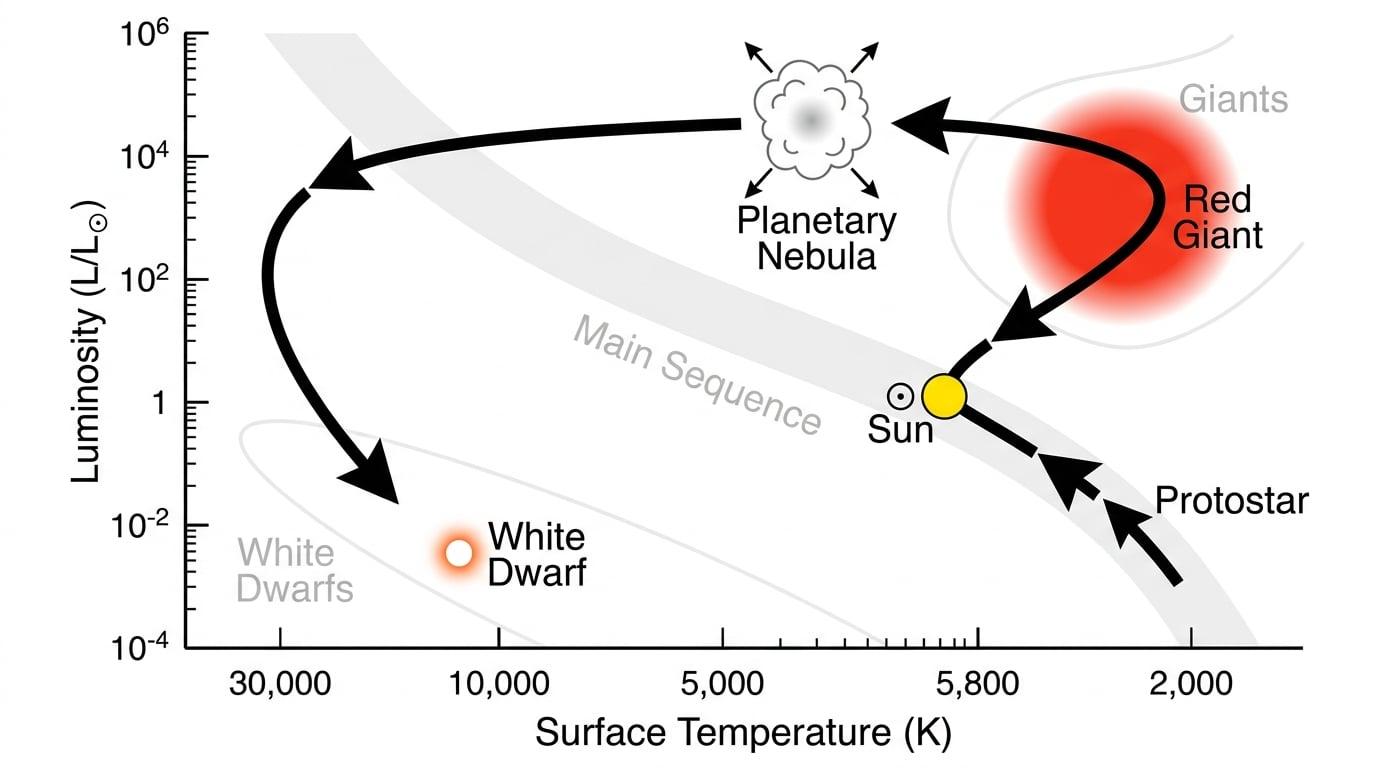
Here is the step-by-step journey:
- Protostar formation A cloud of gas and dust collapses. As it compresses, it heats up. It starts off cool and relatively dim, moving onto the diagram from the right side and settling onto the Main Sequence once hydrogen fusion stabilizes.
- Main Sequence (The long stay) The star spends the vast majority of its life here (for the Sun, about 10 billion years). Its position barely changes because its temperature and power output are stable.
- Red Giant phase When the core runs out of hydrogen, fusion moves to a shell around the core. The outer layers of the star expand massively and cool down, while the overall luminosity increases due to the sheer size of the star. Path on HR diagram: The star moves up and to the right (brighter and cooler).
- Planetary Nebula to White Dwarf Eventually, the core collapses into a dense, incredibly hot sphere, while the outer layers are ejected outwards as a planetary nebula. The exposed core is initially very hot but dim because it is so small. Path on HR diagram: The star swoops quickly to the left (getting very hot) and then down (getting dim), settling in the White Dwarf region. As it slowly cools over billions of years, it gradually moves further down and to the right along the white dwarf track.
Example
Tracing evolutionary paths
The Sun is currently on the main sequence. Describe the changes to the Sun's absolute magnitude and surface temperature as it evolves from the main sequence to become a white dwarf.
- Main Sequence →\to→ Red Giant: As the Sun exhausts its core hydrogen, its outer layers will expand and cool, meaning its surface temperature will decrease. Because of its massive increase in surface area, its overall power output increases, so its absolute magnitude will become more negative (brighter).
- Red Giant →\to→ White Dwarf: After ejecting its outer layers as a planetary nebula, the exposed core remains. This core (white dwarf) has a very high surface temperature (temperature increases dramatically) but a tiny surface area. Because it is so small, its overall power output drops, meaning its absolute magnitude becomes a large positive number (dimmer).
Exam technique
In the exam
- If asked to draw an HR diagram, double-check your axes. Did you put absolute magnitude on the yyy-axis from +15+15+15 (bottom) to −10-10−10 (top)?
- Check your xxx-axis! It must go from 50,000 K50,000 \text{ K}50,000 K on the left to 2,500 K2,500 \text{ K}2,500 K on the right.
- When sketching the regions, make sure your Main Sequence is a smooth diagonal curve spanning from top-left to bottom-right, not just a straight line.
- Mark the Sun near 5800 K5800 \text{ K}5800 K and absolute magnitude +5+5+5. Don't just guess; place it accurately on the scales you have drawn.
- In written answers, explicitly link a star's location on the HR diagram to Stefan's Law if you need to explain its size.
Self review
Check yourself
- What are the units and typical range of the xxx-axis on an AQA HR diagram?
- Why do Red Giants sit in the top-right of the HR diagram despite having low surface temperatures?
- What are the approximate absolute magnitude and temperature of the Sun?
- Describe the direction of the arrow on an HR diagram showing a star transitioning from a Red Giant to a White Dwarf.