What you'll learn:
- How the electrical signals of the heart are detected at the surface of the skin.
- Why skin preparation and a high-gain, differential amplifier are essential for a clear reading.
- The characteristic shape of a normal ECG waveform and what each part (P wave, QRS complex, T wave) represents physically in the heart.
- How to calculate heart rate from an ECG paper trace.
Every time your heart beats, a wave of electrical activity spreads through the heart muscle. This electrical signal triggers the muscle fibres to contract, pumping blood around your body. An electrocardiogram (ECG) is a machine that detects, amplifies, and records these tiny electrical changes at the surface of the skin.
1. Obtaining the ECG Signal
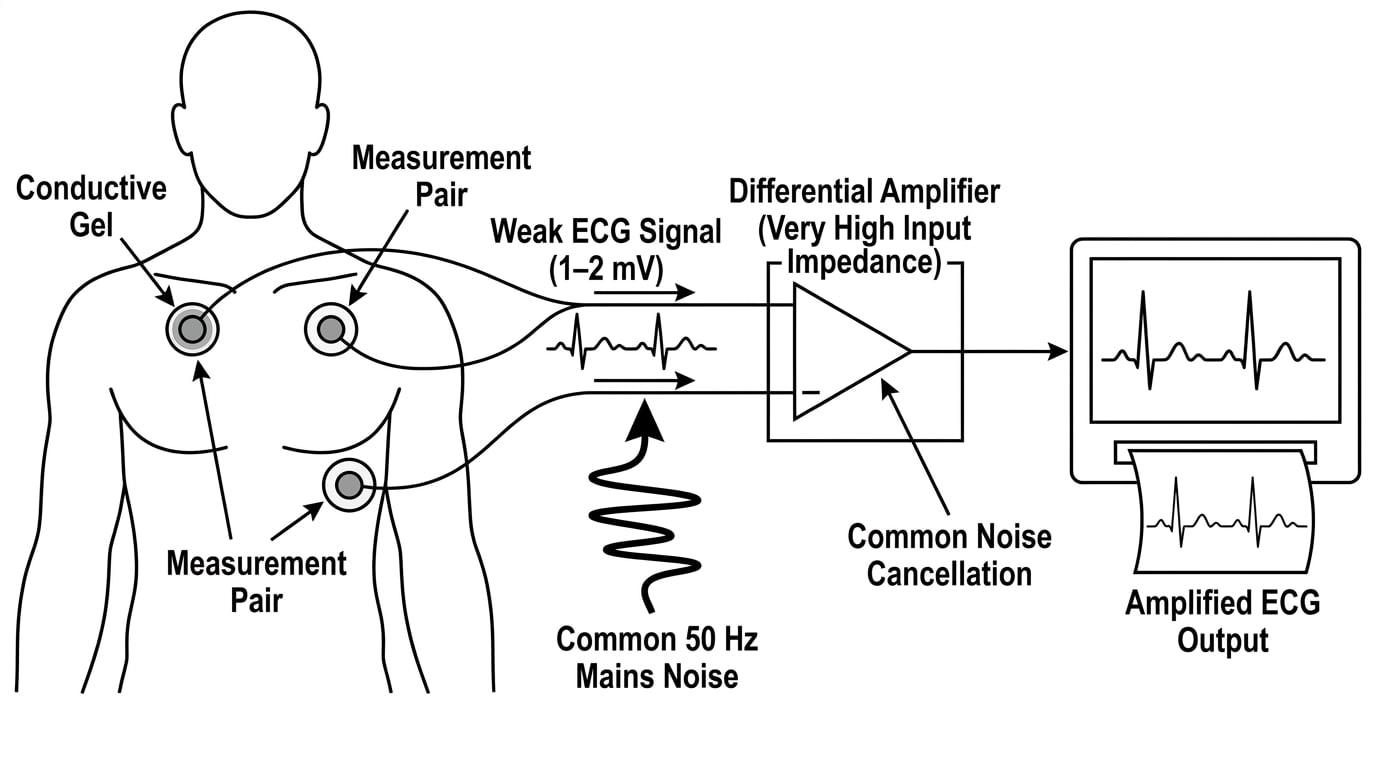
The electrical signal generated by the heart is relatively strong at the heart itself, but by the time it spreads through body tissues to the skin surface, it is incredibly weak—usually peaking at around 1 to 2 millivolts (mV).
To obtain a clear, readable waveform, we have to overcome two major physical challenges: contact resistance and electrical noise.
Overcoming Contact Resistance
The top layer of human skin is made of dead cells and oils, which act as an electrical insulator. If we just placed metal electrodes on dry skin, the resistance would be too high to measure the tiny 1 mV signal accurately.
To get a good reading, the skin is prepared in three steps:
- Shaving hair to ensure the electrode sits flush against the skin.
- Abrading (gently rubbing) the skin with a mild abrasive and wiping with alcohol to remove the insulating layer of dead cells and oils.
- Applying conductive gel between the electrode and the skin. This completely removes any trapped air gaps and creates a low-resistance electrical pathway from the body to the sensor.
Depolarisation and Repolarisation
Depolarisation: The process where heart muscle cells lose their negative resting membrane potential, becoming electrically positive. This electrical change triggers muscle contraction. Repolarisation: The recovery phase where the cells return to their resting (negative) electrical state, causing the muscle to relax.
The Amplifier
Because the body acts like an antenna, it constantly picks up background electromagnetic interference—especially the 50 Hz "mains hum" from nearby electrical wiring. This noise can be much larger than the 1 mV heart signal!
To solve this, ECG machines use a highly specialised amplifier:
- Differential amplifier: The machine uses multiple electrodes. The amplifier measures the signal from two electrodes and subtracts one from the other. Because background 50 Hz noise is picked up roughly equally across the whole body, subtracting the signals cancels out the noise. The heart's signal, however, varies across the chest, so the difference between the two electrodes is amplified.
- High input impedance: The amplifier must have a very high resistance (impedance) at its input. This ensures it draws almost zero current from the patient. If it drew current, there would be a large voltage drop across the skin's resistance, leaving less of the heart's true voltage to be measured by the machine.
- High gain: The tiny millivolt difference is then heavily amplified (often by a factor of 1000 or more) so it can drive a screen display or a moving pen on a paper chart.
Why prep the skin?
AQA frequently asks why skin preparation is necessary. Remember the physical reasoning: the conductive gel and abrasion reduce skin contact resistance. This reduces the fraction of the tiny signal that is "lost" across the skin interface, and it helps reduce interference.
2. The Normal ECG Waveform
Once the signal is cleanly amplified, it is plotted on a graph of Voltage against Time. A single, normal heartbeat produces a very distinctive shape made up of three main features: the P wave, the QRS complex, and the T wave.
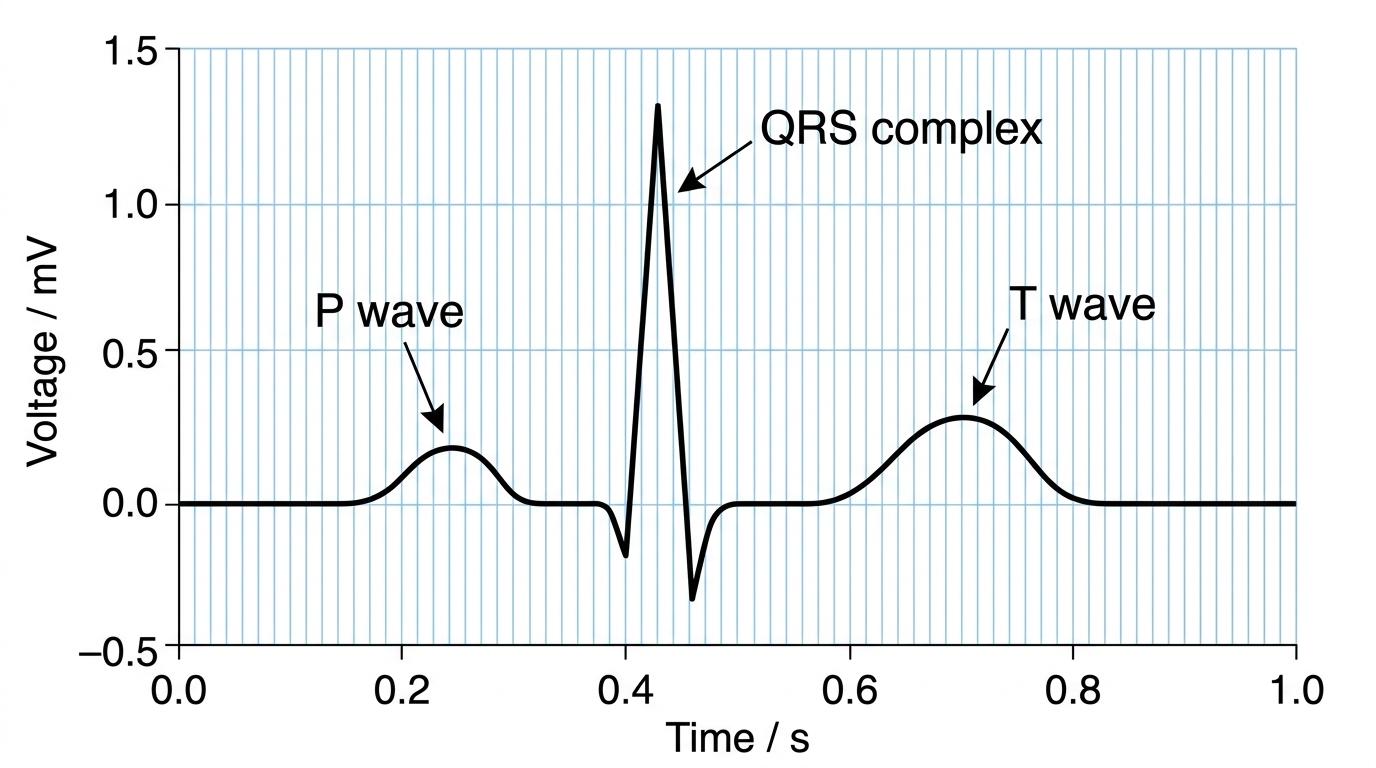
Let's break down exactly what electrical and mechanical events are happening during each part of the trace.
The P Wave
- What it is: A small, rounded upward deflection at the start of the beat.
- Electrical event: Depolarisation of the atria (the top chambers of the heart). The electrical signal originates at the sinoatrial (SA) node and spreads across the atria.
- Mechanical event: This electrical signal causes the atria to contract, pumping blood down into the ventricles.
The QRS Complex
- What it is: A sharp, tall spike. It starts with a small downward dip (Q), a massive upward spike (R), and another downward dip (S).
- Electrical event: Depolarisation of the ventricles (the large, powerful bottom chambers of the heart). The signal shoots down special conducting fibres and spreads rapidly through the thick ventricular muscle.
- Mechanical event: The ventricles contract forcefully, pumping blood out of the heart to the lungs and the rest of the body.
- Note: The repolarisation of the atria also happens during this time, but its small signal is completely hidden by the massive QRS spike.
The T Wave
- What it is: A smaller, wider upward bump following the QRS complex.
- Electrical event: Repolarisation of the ventricles. The ventricular muscle cells are resetting their electrical charges ready for the next beat.
- Mechanical event: The ventricles relax and begin to fill with blood again.
Confusing electrical and mechanical events
The ECG only measures electrical events (depolarisation/repolarisation). The mechanical events (contraction/relaxation) happen a fraction of a second after the electrical wave passes. If an exam asks what the P wave represents, write "Depolarisation of the atria", not just "The atria contract".
3. Calculating Heart Rate from an ECG Trace
ECG machines typically record the waveform onto a strip of graph paper moving at a constant speed—usually 25 mm per second. The graph paper has a grid of small squares, usually 1 mm by 1 mm.
By measuring the distance between two consecutive beats (usually from the tip of one R wave to the tip of the next R wave), you can calculate the time period of one heartbeat, and thus the heart rate.
Calculating heart rate from paper speed
An ECG trace is printed on graph paper moving at a speed of 25 mm s−125 \text{ mm s}^{-1}25 mm s−1. A student measures the distance between two consecutive R wave peaks on the paper and finds it is 20 mm.
Calculate the patient's heart rate in beats per minute (bpm).
- First, find the time taken for one heartbeat (the period, TTT). We know the paper moves 25 mm every 1 second.
- Use the relationship Time=DistanceSpeed\text{Time} = \frac{\text{Distance}}{\text{Speed}}Time=SpeedDistance:
- A period of 0.80 seconds means one beat occurs every 0.80 seconds. To find the frequency in beats per second (Hz):
- Multiply by 60 to find the heart rate in beats per minute:
(Alternatively, simply divide 60 by the period: 600.80=75 bpm\frac{60}{0.80} = 75 \text{ bpm}0.8060=75 bpm).
Quick check for heart rates
A normal resting adult heart rate is usually between 60 and 100 bpm. If your calculation yields 7 bpm or 750 bpm, double-check your unit conversions! Ensure you haven't confused the width of a small 1 mm square with a large 5 mm block.
4. Diagnostics: When the Waveform Changes
Doctors look at the shape, timing, and amplitude of the ECG waves to diagnose heart problems:
- Prolonged PR interval (the time between the P wave and the start of the QRS): Suggests the electrical signal is being delayed as it passes from the atria to the ventricles (heart block).
- Elevated ST segment (the flat line between the S and T waves isn't flat, but sits above the baseline): A strong indicator that the patient is currently having a heart attack (myocardial infarction).
- Irregular R-R intervals: Indicates an irregular heartbeat (arrhythmia), such as atrial fibrillation.
In the exam
When answering questions on simple ECGs, remember these key points:
- Always link the specific wave to the correct chamber and the correct electrical term. P wave = atrial depolarisation. QRS = ventricular depolarisation. T wave = ventricular repolarisation.
- If asked why the QRS complex is so much taller than the P wave, state that the ventricles have much greater muscle mass than the atria, so their depolarisation generates a larger electrical signal.
- Be precise about amplifiers. If asked about their properties, explicitly name "high input impedance" and "differential amplifier", and state that they are used to draw zero current and cancel out common background noise (like mains interference).
- For heart rate calculations, always find the time period TTT first using the paper speed.
Check yourself
- What does the application of conductive gel achieve physically?
- Which part of the ECG trace corresponds to the repolarisation of the ventricles?
- Why is a differential amplifier used instead of a standard voltage amplifier?
- If an ECG paper runs at 25 mm s−125 \text{ mm s}^{-1}25 mm s−1 and the distance between three consecutive R waves (two full cycles) is 40 mm, what is the heart rate?