

3. Exposure to Excessive Noise
The second defect you need to know is caused by exposure to very loud noises. This could be a sudden, explosive sound (like a gunshot), or long-term exposure to loud industrial machinery or concerts.
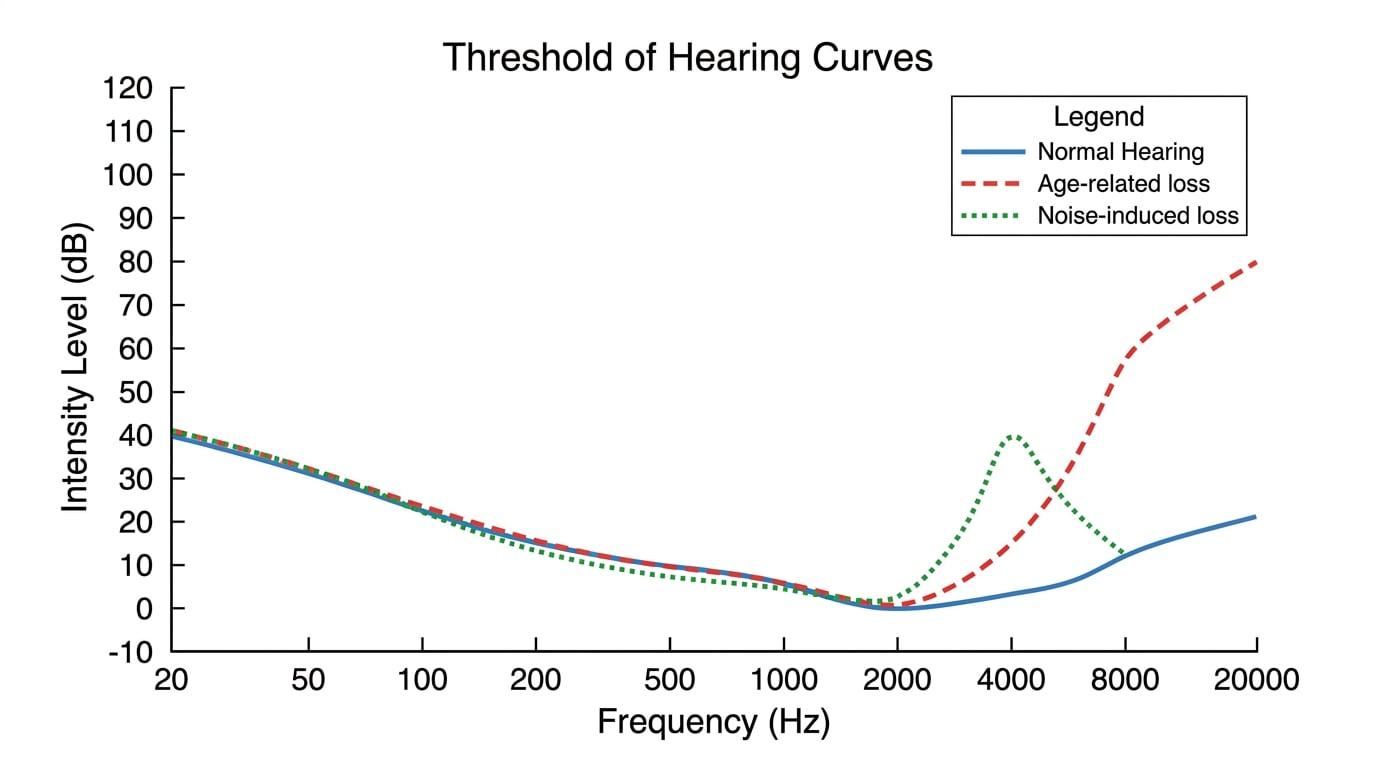
Unlike age-related loss, noise-induced hearing loss produces a very specific, characteristic shape on the threshold of hearing graph: a notch or dip in sensitivity.
Because of the resonant properties of the ear canal (which naturally amplifies frequencies around 3000 Hz3000 \text{ Hz}3000 Hz to 4000 Hz4000 \text{ Hz}4000 Hz), the mechanisms of the ear are most easily damaged in this range. Therefore, noise-induced hearing loss shows up as a sharp upward peak on the threshold curve centered around 4000 Hz4000 \text{ Hz}4000 Hz.
Spotting the difference
If an exam question shows a curve that rises smoothly at the high-frequency end, it is age-related. If the curve has an isolated, sharp upward peak (a "notch" in hearing ability) around 4000 Hz4000 \text{ Hz}4000 Hz and then recovers slightly at higher frequencies, it is noise-induced.
Calculating the new threshold
Examiners love to combine your knowledge of hearing defects with the decibel formula. They might tell you how much hearing a person has "lost" in decibels, and ask you to find their new absolute threshold intensity in W m−2\text{W m}^{-2}W m−2.
Decibel hearing loss
If a question states a person has a hearing loss of 30 dB30 \text{ dB}30 dB at a certain frequency, it means their threshold of hearing is 30 dB30 \text{ dB}30 dB higher than the normal threshold at that frequency.
Calculating intensity from hearing loss
A musician has suffered noise-induced hearing loss. At 4000 Hz4000 \text{ Hz}4000 Hz, their threshold of hearing is 45 dB45 \text{ dB}45 dB higher than the normal threshold of 0 dB0 \text{ dB}0 dB (where I0=1.0×10⁻¹² W m−2I_0 = 1.0 \times 10^{-12} \text{ W m}^{-2}I0=1.0×10⁻¹² W m−2). Calculate the minimum intensity of sound they can hear at 4000 Hz4000 \text{ Hz}4000 Hz.
- First, identify the new threshold intensity level in decibels. The normal threshold is 0 dB0 \text{ dB}0 dB, and the loss is 45 dB45 \text{ dB}45 dB, so the new intensity level is L=45 dBL = 45 \text{ dB}L=45 dB.
- Write down the definition of the decibel scale:
- Substitute the known values into the equation:
- Divide both sides by 101010 to isolate the logarithm:
- Remove the logarithm by raising 101010 to the power of both sides:
- Rearrange to solve for III:
- Calculate the final answer and state the units:
Sanity check your powers of 10
Every 10 dB10 \text{ dB}10 dB of hearing loss means the intensity required increases by a factor of 101010. A 40 dB40 \text{ dB}40 dB loss means 10410^4104 times more intense; a 50 dB50 \text{ dB}50 dB loss means 10510^5105 times more intense. In the example above, a 45 dB45 \text{ dB}45 dB loss should be between 10410^4104 and 10510^5105 times larger than 10−1210^{-12}10−12. Our answer (3.16×10−83.16 \times 10^{-8}3.16×10⁻⁸) is exactly in that range!
4. Overall Effect on Equal Loudness Curves
We have mostly focused on the threshold of hearing (the 0 phon0 \text{ phon}0 phon curve). But what happens to the rest of the equal loudness curves?
When a person suffers from hearing loss, the quietest sounds (lower phon values) are severely affected. The 10 phon10 \text{ phon}10 phon and 20 phon20 \text{ phon}20 phon curves will shift upwards significantly in the damaged frequency ranges.
However, the threshold of feeling/pain (the top curve, around 120 phon120 \text{ phon}120 phon) remains largely unchanged. A sound that is painfully loud to a healthy ear is usually still painfully loud to a damaged ear!
Because the bottom curves shift up but the top curve stays put, the "gap" between the quietest sound a person can hear and the loudest sound they can tolerate gets "squashed" together at the damaged frequencies.
Interpreting a shifted curve
An older person requires an intensity level of 60 dB60 \text{ dB}60 dB to just hear a 10 000 Hz10\,000 \text{ Hz}10000 Hz tone. For a young person with healthy hearing, the threshold at 10 000 Hz10\,000 \text{ Hz}10000 Hz is 20 dB20 \text{ dB}20 dB. Calculate the ratio of the intensity required by the older person to the intensity required by the younger person.
- Find the difference in intensity levels (ΔL\Delta LΔL):
- Use the decibel difference rule. We know that ΔL=10log10(I2I1)\Delta L = 10 \log_{10} \left( \frac{I_2}{I_1} \right)ΔL=10log10(I1I2).
- Substitute the decibel difference:
- Divide by 101010:
- Convert out of the logarithm to find the ratio:
- The older person requires an intensity 10 00010\,00010000 times greater than the younger person to hear the same frequency.
In the exam
- Check the axes: Equal loudness curves plot Intensity Level (dB) upwards. A curve peaking upwards means higher intensity is needed, which indicates hearing loss.
- Identify the shape: If asked to diagnose a graph, look for the 4000 Hz4000 \text{ Hz}4000 Hz peak (excessive noise) versus a rising curve at the high frequencies (age).
- Use the reference intensity: If a question asks you to calculate an absolute intensity (III) from a decibel loss, always use I0=1.0×10⁻¹² W m−2I_0 = 1.0 \times 10^{-12} \text{ W m}^{-2}I0=1.0×10⁻¹² W m−2 unless the question provides a different baseline for that specific frequency.
- No biology needed: If asked to describe the effect of hearing loss, describe the changes to the curves and the frequencies affected. Do not write about damaged hair cells or stiff ossicles.
Check yourself
- Can you sketch the general shape of an equal loudness curve for a person with noise-induced hearing loss?
- At approximately what frequency does noise-induced hearing loss cause the most significant reduction in sensitivity?
- Why do the lower equal loudness curves shift upwards while the threshold of pain remains roughly the same?
- If a person has a 20 dB20 \text{ dB}20 dB hearing loss at a specific frequency, by what factor has their threshold intensity (in W m−2\text{W m}^{-2}W m−2) increased?
