Sensitivity and frequency response (A-level only)
What you'll learn
- How to distinguish between the objective intensity of a sound and its subjective loudness.
- Why we use a logarithmic scale (decibels) to measure sound intensity levels.
- How to read and interpret equal loudness curves (measured in phons).
- The difference between the dB and dBA scales, and why dBA is used in health and safety.
What is Sound Intensity?
To understand how sensitive the human ear is, we first need a physical way to measure the "amount" of sound arriving at it. Sound waves transfer energy.
The physical measure of this energy transfer is called intensity.
Intensity
Intensity (III) is the sound energy transferred per second, per unit area, perpendicular to the direction of the sound wave.
Since energy per second is power, we can write this as:
I=PA I = \frac{P}{A} I=APWhere PPP is power in watts (W\text{W}W) and AAA is area in square metres (m2\text{m}^2m2). The unit of intensity is therefore W m−2\text{W m}^{-2}W m−2.
The human ear is an incredibly sensitive organ. The quietest sound a healthy human ear can detect at 1000 Hz1000 \text{ Hz}1000 Hz has an intensity of 1.0×10⁻¹² W m−21.0 \times 10^{-12} \text{ W m}^{-2}1.0×10⁻¹² W m−2. We call this the threshold of hearing, and it is given the symbol I0I_0I0.
On the other extreme, a sound intensity of around 1 W m−21 \text{ W m}^{-2}1 W m−2 causes physical pain (the threshold of pain).
The Need for a Logarithmic Scale
Notice the gap between the threshold of hearing (10−12 W m−210^{-12} \text{ W m}^{-2}10−12 W m−2) and the threshold of pain (1 W m−21 \text{ W m}^{-2}1 W m−2). The loudest sound we can safely hear is a trillion times more intense than the quietest sound we can detect!
Because this range is so astronomically large, a linear scale for sound intensity is practically useless. If we plotted human hearing on a standard linear graph where 1 mm1 \text{ mm}1 mm represented the quietest sound, the threshold of pain would be 1 billion millimetres1 \text{ billion millimetres}1 billion millimetres (or 1000 km1000 \text{ km}1000 km) away!
Furthermore, human perception of loudness is non-linear. If you double the physical intensity of a sound, it does not sound twice as loud to your ear. To make a sound seem twice as loud, you roughly need to multiply the intensity by 10.
For these two reasons, we use a logarithmic scale to measure sound.
Why a logarithmic scale?
We use a logarithmic scale for sound because:
- It compresses the massive range of human hearing (10−1210^{-12}10−12 to 1 W m−21 \text{ W m}^{-2}1 W m−2) into a manageable scale (000 to 120120120).
- It more accurately reflects how the human brain perceives relative changes in loudness.
Calculating Intensity Level (The Decibel Scale)
To turn absolute intensity into our logarithmic scale, we use the Intensity Level formula. The unit of Intensity Level is the decibel (dB\text{dB}dB).
Intensity level=10log(II0) \text{Intensity level} = 10 \log \left( \frac{I}{I_0} \right) Intensity level=10log(I0I)Where:
- Intensity level\text{Intensity level}Intensity level is measured in decibels (dB\text{dB}dB).
- III is the intensity of the sound you are measuring (in W m−2\text{W m}^{-2}W m−2).
- I0I_0I0 is the threshold of hearing (1.0×10⁻¹² W m−21.0 \times 10^{-12} \text{ W m}^{-2}1.0×10⁻¹² W m−2).
- log\loglog refers to logarithm base 10.
Log vs Ln
In mathematics and physics, you have two main log buttons on your calculator: log (base 10) and ln (base e). The decibel scale always uses base 10. Make sure you are pressing log!
Let's look at how to use this equation to find the intensity level of a sound.
Calculating Intensity Level
A busy street has a sound intensity of 3.5×10⁻⁵ W m−23.5 \times 10^{-5} \text{ W m}^{-2}3.5×10⁻⁵ W m−2. Calculate the intensity level of the street noise.
- State the formula and the given values:
I=3.5×10⁻⁵ W m−2I = 3.5 \times 10^{-5} \text{ W m}^{-2}I=3.5×10⁻⁵ W m−2 I0=1.0×10⁻¹² W m−2I_0 = 1.0 \times 10^{-12} \text{ W m}^{-2}I0=1.0×10⁻¹² W m−2 2. Substitute the values into the bracket:
II0=3.5×10−51.0×10−12=3.5×10⁷ \frac{I}{I_0} = \frac{3.5 \times 10^{-5}}{1.0 \times 10^{-12}} = 3.5 \times 10^{7} I0I=1.0×10−123.5×10−5=3.5×10⁷- Take the log base 10 of this ratio and multiply by 10:
You must also be confident working backwards: if the examiner gives you the intensity level in dB\text{dB}dB, you need to be able to calculate the physical intensity III in W m−2\text{W m}^{-2}W m−2.
Reversing the Formula
A rock concert has an intensity level of 112 dB112 \text{ dB}112 dB. Calculate the absolute sound intensity, III, in W m−2\text{W m}^{-2}W m−2.
- Write out the formula with the known values:
- Divide both sides by 10:
- Remove the log by making both sides a power of 10 (since 10log(x)=x10^{\log(x)} = x10log(x)=x):
- Multiply up to solve for III:
Frequency Response and Equal Loudness Curves
So far, we have looked at the purely physical side of sound. But human hearing is subjective.
Your ear is not equally sensitive to all frequencies. Due to the shape and length of the human ear canal, it acts as a resonating tube. It naturally amplifies frequencies between roughly 2000 Hz2000 \text{ Hz}2000 Hz and 4000 Hz4000 \text{ Hz}4000 Hz, with maximum sensitivity around 3000 Hz3000 \text{ Hz}3000 Hz.
This means a 3000 Hz3000 \text{ Hz}3000 Hz tone will sound much louder to you than a 100 Hz100 \text{ Hz}100 Hz tone, even if they have the exact same physical intensity level in dB.
To map out human perception, audiologists use equal loudness curves (sometimes called Fletcher-Munson curves).
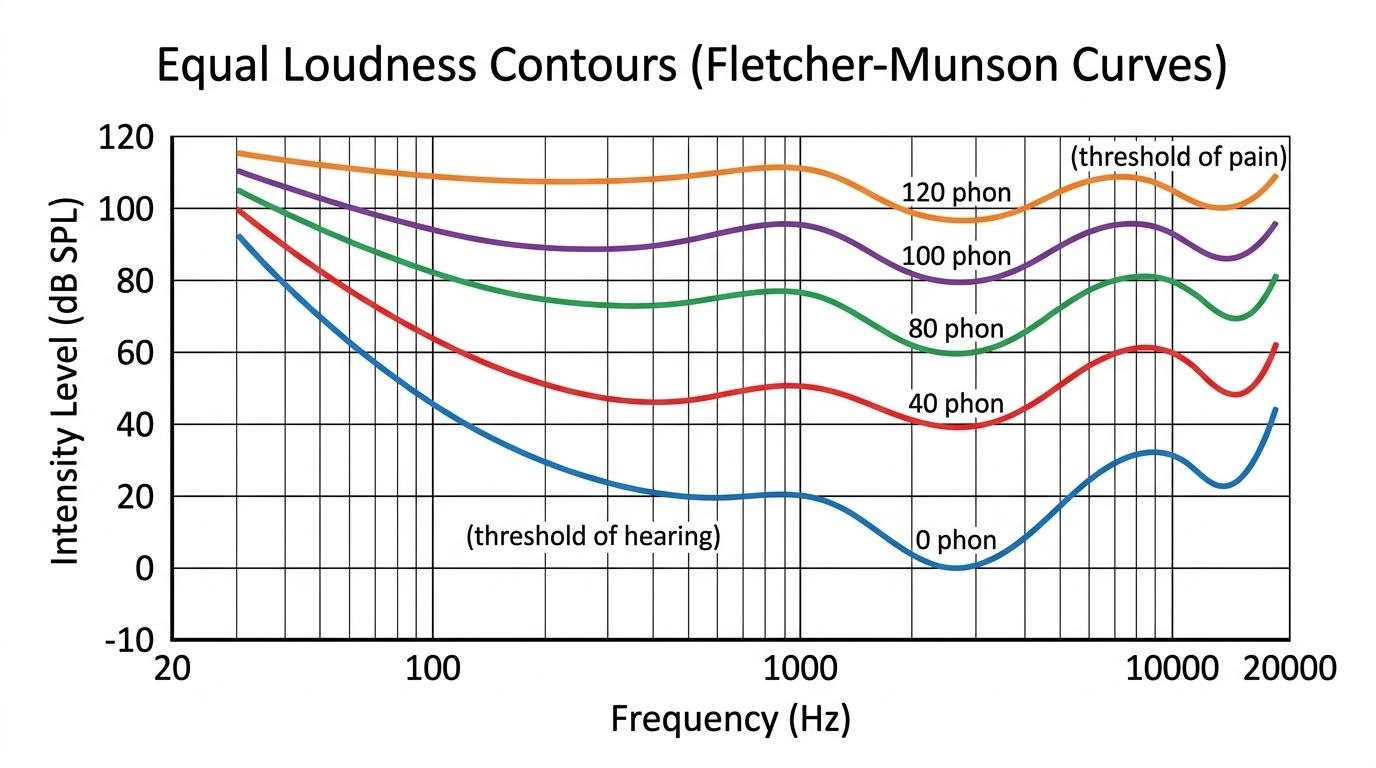
How are these curves produced?
They are produced experimentally using human volunteers.
- A reference tone is played at exactly 1000 Hz1000 \text{ Hz}1000 Hz at a specific intensity level (e.g., 40 dB40 \text{ dB}40 dB).
- A second test tone is played at a different frequency (e.g., 100 Hz100 \text{ Hz}100 Hz).
- The volunteer adjusts the volume of the test tone until they judge it to be exactly as loud as the reference tone.
- The physical intensity level (dB\text{dB}dB) of the matched test tone is recorded, and the process is repeated across the whole frequency range to draw a curve.
The Phon
The phon is a unit of subjective loudness. By definition, the loudness in phons is exactly equal to the intensity level in decibels at a frequency of 1000 Hz1000 \text{ Hz}1000 Hz.
For example, any point on the 40 phon40 \text{ phon}40 phon curve sounds exactly as loud to a human as a 1000 Hz1000 \text{ Hz}1000 Hz tone played at 40 dB40 \text{ dB}40 dB.
Interpreting the Curves
Look closely at the graph above. Notice the pronounced "dip" in the curves between 2000 Hz2000 \text{ Hz}2000 Hz and 4000 Hz4000 \text{ Hz}4000 Hz. Because the ear is most sensitive here, it requires less physical intensity (dB\text{dB}dB) to achieve the same perceived loudness (phons\text{phons}phons).
At low frequencies (e.g. 50 Hz50 \text{ Hz}50 Hz), the curve slopes upwards dramatically. The ear is very insensitive to low bass frequencies, so a massive amount of physical energy is required for them to sound equally loud as a 1000 Hz1000 \text{ Hz}1000 Hz tone.
Reading the graph in an exam
If an exam question asks: "Estimate the intensity level required for a 100 Hz100 \text{ Hz}100 Hz tone to sound as loud as a 60 dB60 \text{ dB}60 dB tone at 1000 Hz1000 \text{ Hz}1000 Hz"... You simply find the 60 phon60 \text{ phon}60 phon curve (which starts at 60 dB60 \text{ dB}60 dB on the 1000 Hz1000 \text{ Hz}1000 Hz line), trace that same curve over to the 100 Hz100 \text{ Hz}100 Hz vertical line, and read the corresponding dB\text{dB}dB value on the y-axis (it will be much higher, around 75 dB75 \text{ dB}75 dB).
Measurement Scales: dB vs dBA
Because human ears don't hear all frequencies equally, a standard microphone measuring purely in dB\text{dB}dB doesn't give us a realistic idea of how loud a noise will seem to a person. A machine might measure an incredibly intense 30 Hz30 \text{ Hz}30 Hz rumble, but a human might barely notice it.
To solve this, sound level meters have an electronic filter built in, called an A-weighting network.
- The dB scale measures unweighted, objective, physical sound intensity levels across all frequencies equally.
- The dBA scale (A-weighted decibels) filters the sound to mimic human hearing. It heavily reduces the measurement of low frequencies, slightly reduces very high frequencies, and lightly boosts the frequencies around 3000 Hz3000 \text{ Hz}3000 Hz.
When to use dBA
The dBA scale is used wherever human perception is the priority. It is the standard scale used for health and safety regulations, noise pollution measurements, and assessing the risk of hearing damage in the workplace.
In the exam
- Be careful with reverse logs: When solving for III from an intensity level, remember to divide by 101010 before taking the anti-log (10x10^x10x). A common error is writing 106010^{60}1060 instead of 10610^6106 for a 60 dB60 \text{ dB}60 dB sound.
- Memorise the 3000 Hz dip: You may be asked to sketch or describe the equal loudness curve. Always ensure your curve dips to its lowest point around 3000 Hz3000 \text{ Hz}3000 Hz to show maximum ear sensitivity.
- Know the definition of the phon: It is heavily tested. Always relate it back to the 1000 Hz1000 \text{ Hz}1000 Hz reference frequency.
- Distinguish dB and dBA: If a 1-mark question asks why dBA is used instead of dB, state clearly: "dBA mimics the frequency response of the human ear" or "dBA accounts for the ear being less sensitive to low and high frequencies".
Check yourself
- What are the two main reasons a logarithmic scale is used to measure sound intensity levels?
- What is the value and unit of the threshold of hearing, I0I_0I0?
- At what frequency is human hearing most sensitive, and why?
- If a sound has a loudness of 50 phons50 \text{ phons}50 phons, what does this mean in terms of a 1000 Hz1000 \text{ Hz}1000 Hz tone?
- Why is the dBA scale used instead of the dB scale for occupational health and safety?