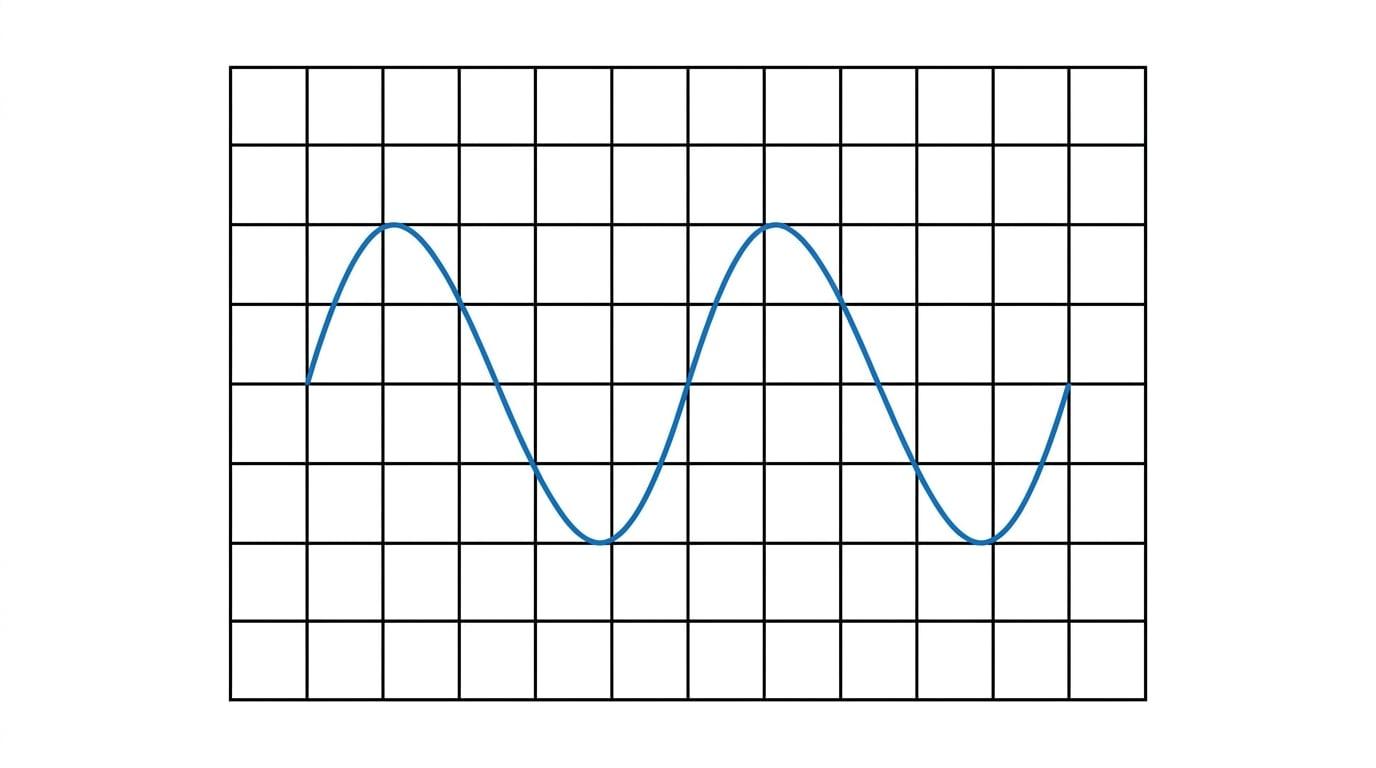
1. The Y-gain (or Y-sensitivity)
This controls the scale of the y-axis. It is measured in volts per division (V div−1\text{V div}^{-1}V div−1). If the Y-gain is set to 2 V div−12\text{ V div}^{-1}2 V div−1, and your wave has a peak that is 3 divisions above the centre line, your peak voltage is:
V0=3 div×2 V div−1=6 V V_0 = 3\text{ div} \times 2\text{ V div}^{-1} = 6\text{ V} V0=3 div×2 V div−1=6 V2. The Timebase
This controls the scale of the x-axis, determining how fast the beam sweeps across the screen. It is measured in seconds per division (often given in ms or μs\mu\text{s}μs per division). If the timebase is set to 5 ms div−15\text{ ms div}^{-1}5 ms div−1, and one full wave cycle stretches across 4 divisions, your time period is:
T=4 div×5 ms div−1=20 ms T = 4\text{ div} \times 5\text{ ms div}^{-1} = 20\text{ ms} T=4 div×5 ms div−1=20 msFrom this, you can immediately find the frequency: f=120×10−3=50 Hzf = \frac{1}{20 \times 10^{-3}} = 50\text{ Hz}f=20×10−31=50 Hz.
Timebase turned off?
If you turn the timebase off, the dot stops sweeping left to right.
- For a DC supply, you will just see a single stationary dot.
- For an AC supply, the dot will move up and down so fast it creates a solid vertical line. The length of this vertical line is the peak-to-peak voltage!
Direct Current on an Oscilloscope
If you connect a DC battery to an oscilloscope (with the timebase switched on), you won't see a wave. You will just see a perfectly flat horizontal line shifted above or below the zero line. The distance of this line from the centre simply tells you the DC voltage.
Reading an oscilloscope trace
An alternating voltage is displayed on an oscilloscope screen. The Y-gain is set to 0.5 V div−10.5\text{ V div}^{-1}0.5 V div−1 and the timebase is set to 2.0 ms div−12.0\text{ ms div}^{-1}2.0 ms div−1. The trace shows a sinusoidal wave where the peak-to-peak height is 6.0 divisions, and one complete cycle takes 5.0 horizontal divisions.
Calculate the rms voltage and the frequency of the supply.
- First, find the peak voltage V0V_0V0. The peak-to-peak height is 6.0 divisions, so the peak height (amplitude) is half of that: 3.0 divisions.
- Multiply by the Y-gain:
- Calculate the rms voltage:
- Next, find the time period TTT. One cycle is 5.0 divisions wide.
- Multiply by the timebase:
Convert to seconds: T=10×10−3 sT = 10 \times 10^{-3}\text{ s}T=10×10−3 s. 6. Calculate the frequency:
f=1T=110×10−3=100 Hz f = \frac{1}{T} = \frac{1}{10 \times 10^{-3}} = 100\text{ Hz} f=T1=10×10−31=100 HzForgetting milli and micro
A classic error is ignoring the prefixes on the timebase setting. Oscilloscopes rarely measure in whole seconds per division! Always check if the dial says ms div−1\text{ms div}^{-1}ms div−1 (10−310^{-3}10−3) or μs div−1\mu\text{s div}^{-1}μs div−1 (10−610^{-6}10−6) before you plug the time period into the frequency equation.
In the exam
- Read the question carefully: Are they asking for peak voltage, peak-to-peak voltage, or rms voltage? They frequently give you one and ask for another to test your reading comprehension.
- Double check your powers of ten: Especially on oscilloscope timebases (ms\text{ms}ms or μs\mu\text{s}μs) and frequencies (kHz\text{kHz}kHz or MHz\text{MHz}MHz).
- Remember the mains standard: UK mains is 230 V rms and 50 Hz. Knowing this by heart acts as a great sanity check if you are calculating values for a standard appliance.
- Drawing traces: If you are asked to sketch a wave on an oscilloscope grid, use a pencil and plot key points first (peaks, troughs, and zero-crossings) to ensure your wave is perfectly symmetrical and fits the correct number of divisions.
Check yourself
- What is the difference between peak voltage and peak-to-peak voltage?
- Why do we use root-mean-square values to calculate AC power instead of the mathematical average?
- If an oscilloscope timebase is set to 10 ms div−110\text{ ms div}^{-1}10 ms div−1 and a full wave takes 2 divisions, what is the frequency of the wave?
- How would the appearance of a 5 V DC signal differ from a 5 V peak AC signal on an oscilloscope screen with the timebase turned on?