Question 2
The weekly call times, in minutes, for 11 students are
17,23,35,36,51,53,54,55,60,77,11017,23,35,36,51,53,54,55,60,77,11017,23,35,36,51,53,54,55,60,77,110.
a.[3]
Find the median and quartiles.
b.[2]
Using the 1.5×IQR1.5\times\mathrm{IQR}1.5×IQR rule, show that 110 is the only outlier.
c.[3]
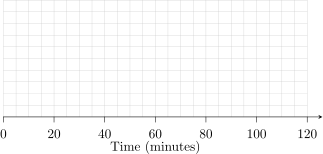
Draw a box plot, showing the outlier clearly.
2.2.1 Types of data and standard diagrams Questions
8 exam-style questions on OCR (MEI) A Level Maths 2.2.1 Types of data and standard diagrams. Each one has a worked solution and a mark scheme showing where the marks go.