Question 1
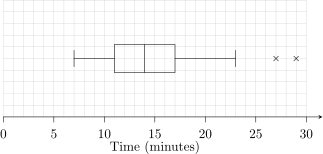
Children from school A completed a puzzle. Their times are summarised by the box plot.
a.[1]
State the time by which 75% had completed the puzzle.
b.[2]
Explain what the two crosses represent in context.
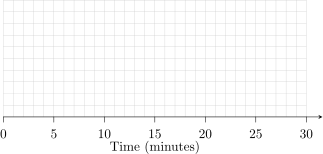
For school B, the minimum is 6 minutes, the quartiles are 12, 15 and 17 minutes, and the maximum is 22 minutes.
c.[3]
Determine whether school B has any outliers.
d.[3]
Draw the box plot for school B.
e.[3]
Compare the two distributions.
2.2.1 Types of data and standard diagrams Questions
8 exam-style questions on OCR (MEI) A Level Maths 2.2.1 Types of data and standard diagrams. Each one has a worked solution and a mark scheme showing where the marks go.