Question 9
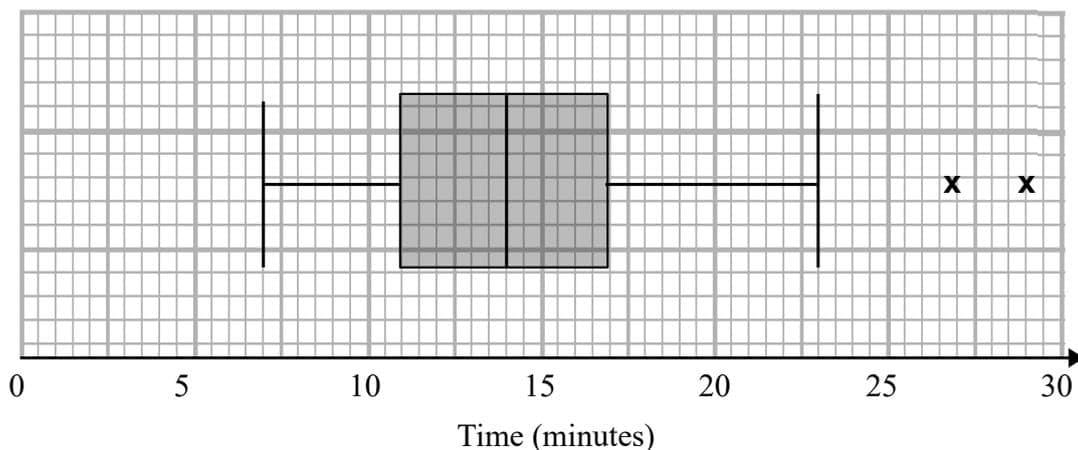
Children from two schools A and B took part in a competition to complete a puzzle. The distribution of times taken, to the nearest minute, by children in school A are shown in the box plot below.
a.[1]
Write down the time by which 75% of the children in school A had completed the puzzle.
b.[2]
State what the two crosses (x) represent on the box plot above. Interpret these in context.
c.[4]
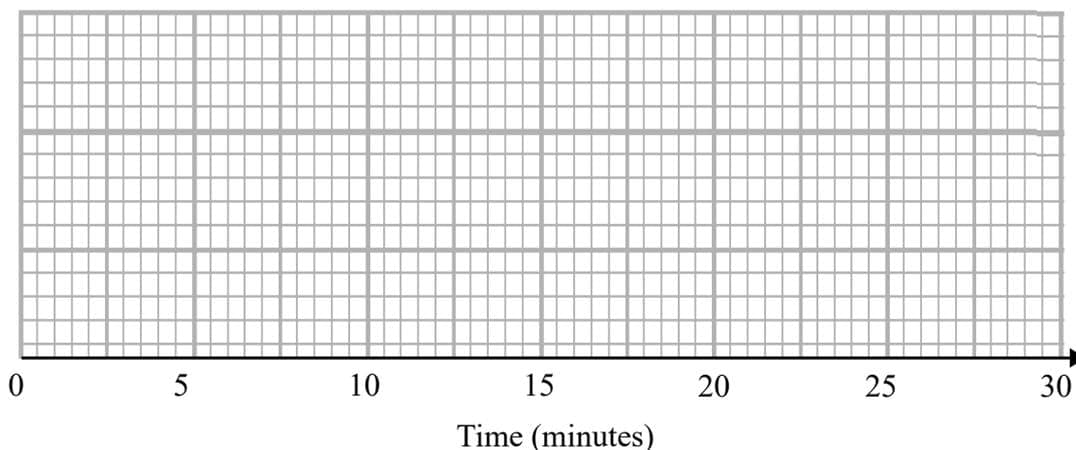
For school B the shortest time taken was 6 minutes, the longest time taken was 22 minutes and the quartiles were 12, 15 and 17 minutes respectively. A value that is greater than Q3+1.5×(Q3−Q1)Q_3 + 1.5 \times (Q_3 - Q_1)Q3+1.5×(Q3−Q1) or smaller than Q1−1.5×(Q3−Q1)Q_1 - 1.5 \times (Q_3 - Q_1)Q1−1.5×(Q3−Q1) is defined as an outlier. Determine if there are any outliers.
d.[3]
Draw a box plot for this information.
e.[3]
Compare the two distributions.
2.2 Data Presentation and Interpretation Questions
121 exam-style questions on OCR (MEI) A Level Maths 2.2 Data Presentation and Interpretation, covering 2.2.1 Types of data and standard diagrams, 2.2.2 Area in a histogram is proportional to frequency, 2.2.3 Cumulative frequency diagram, 2.2.4 Describe frequency distributions, 2.2.5 Samples and theoretical distributions, 2.2.6 Interpret a scatter diagram, 2.2.7 Distinct sections and outliers in scatter diagrams, 2.2.8 Correlation and causation, 2.2.9 Select or critique data presentation techniques, 2.2.10 Measures of central tendency, 2.2.11 Simple measures of spread, 2.2.12 Variance and standard deviation, 2.2.13 Outliers, 2.2.14 Cleaning data, and 2.2 Data Presentation and Interpretation. Each one has a worked solution and a mark scheme showing where the marks go.