Question 2
64%The partially completed histogram and the partially completed table show the times taken, to the nearest second, for a group of people to complete a puzzle.
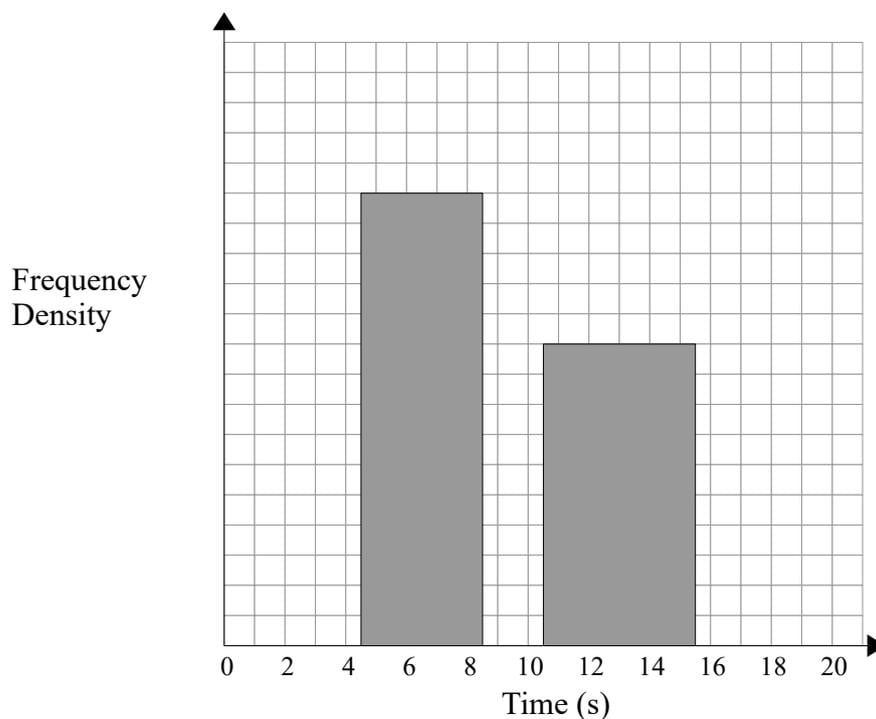
| Time (seconds) | Frequency |
|---|---|
| 1 – 4 | 2 |
| 5 – 8 | 12 |
| 9 – 10 | 8 |
| 11 – 15 | |
| 16 – 20 | 3 |
a.[2]
Complete the table.
b.[2]
Complete the histogram
c.[2]
One of the participants is selected at random. Estimate the probability that this participant completed the puzzle in under 10 seconds.
2.2 Data Presentation and Interpretation Questions
121 exam-style questions on OCR A Level Maths 2.2 Data Presentation and Interpretation, covering 2.2.1 Tables and diagrams for single variable data, 2.2.2 Area in a histogram, 2.2.3 Scatter diagrams and regression lines, 2.2.4 Informal interpretation of correlation, 2.2.5 Correlation and causation, 2.2.6 Measures of average and spread, 2.2.7 Calculations of mean and standard deviation, 2.2.8 Outliers, 2.2.9 Selecting or critiquing data presentation, and 2.2.10 Cleaning data. Each one has a worked solution and a mark scheme showing where the marks go.