Question 14
The partially completed histogram and the partially completed table show the times taken, to the nearest second, for a group of people to complete a puzzle.
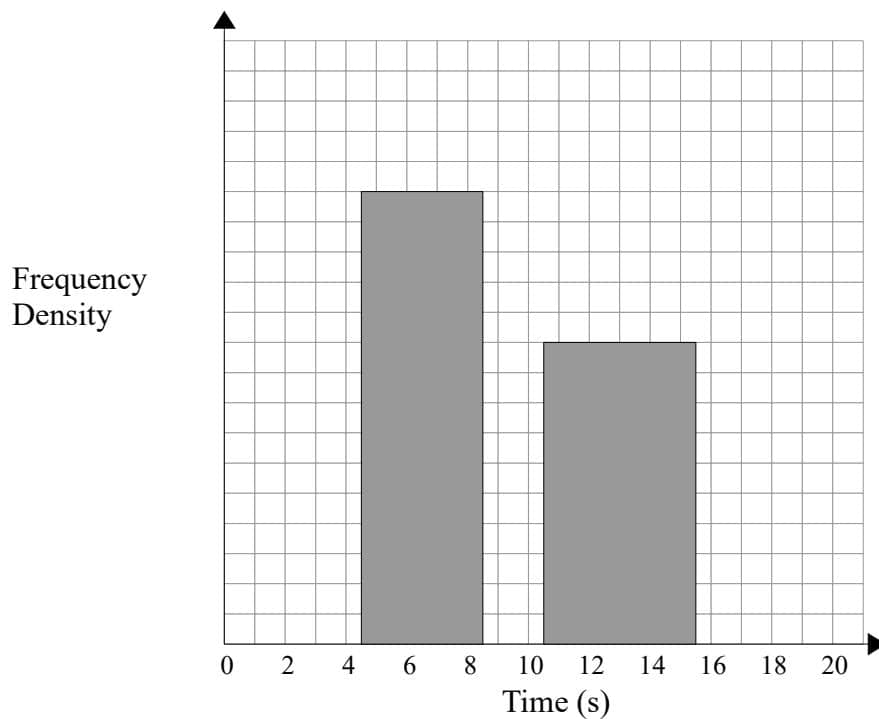
| Time (seconds) | Frequency |
|---|---|
| 1–4 | 4 |
| 5–8 | 12 |
| 9–10 | 8 |
| 11–15 | |
| 16–20 | 6 |
a.[1]
Complete the table.
b.[2]
Complete the histogram.
c.[2]
One of the participants is selected at random.
Estimate the probability that this participant completed the puzzle in under 10 seconds.
Representations of Data Questions
160 exam-style questions on Edexcel A Level Maths Representations of Data, covering 3.1 Outliers, 3.2 Box Plots, 3.3 Cumulative Frequency, 3.4 Histograms, and 3.5 Comparing Data. Each one has a worked solution and a mark scheme showing where the marks go.