Functions and Graphs
123456789101112131415161718192021222324252627282930313233343536373839404142434445464748495051525354555657585960616263646566676869707172737475767778798081828384858687888990919293949596979899100101102103104105106107108109110111112113114115116117118119120121122123124125126127128129130131132133134135136137138139140141142143144145146147148149150151152153154155156157158159160161162163164165166167168169170171172173174175176177178179180181182183184185186187188189190
Question 21
The graph shows a sketch of y=∣x+1∣−2y = |x + 1| - 2y=∣x+1∣−2
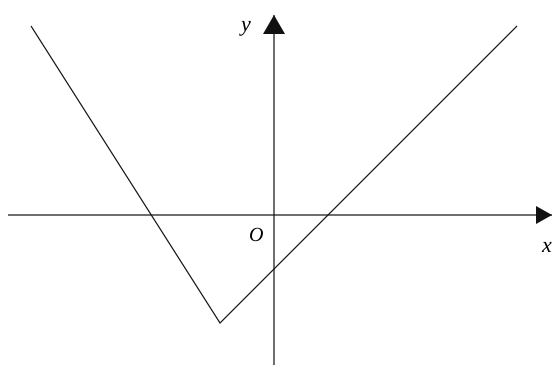
Find the set of values for which ∣x+1∣<2|x + 1| < 2∣x+1∣<2
Functions and Graphs Questions
471 exam-style questions on Edexcel A Level Maths Functions and Graphs, covering 2.1 The Modulus Function, 2.2 Functions and Mappings, 2.3 Composite Functions, 2.4 Inverse Functions, 2.5 y=|f(x)| and y=f(|x|), 2.6 Combining Transformations, and 2.7 Solving Modulus Problems. Each one has a worked solution and a mark scheme showing where the marks go.