2.5 Data presentation and interpretation
123456789101112131415161718192021222324252627282930313233343536373839404142434445464748495051525354555657585960616263646566676869707172737475767778798081828384858687888990919293949596979899100101102103104105106107108109110111112113114115116117118119120121122123124125126127128129130131132133134135136137138139140141142143144145146
Question 114
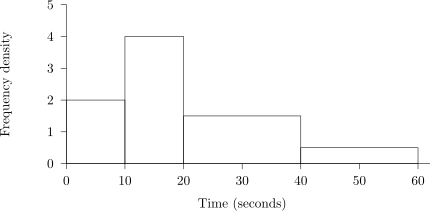
The histogram shows the times taken by 100 people to complete a task.
a.[2]
Show that the total frequency is 100.
b.[2]
Estimate the number who took less than 25 seconds.
c.[1]
Estimate the probability that a randomly selected person took less than 25 seconds.
2.5 Data presentation and interpretation Questions
278 exam-style questions on CCEA A Level Maths 2.5 Data presentation and interpretation, covering 2.5.1 Data presentation and interpretation, 2.5.2 Data presentation and interpretation, 2.5.3 Data presentation and interpretation, 2.5.4 Data presentation and interpretation, 2.5.5 Data presentation and interpretation, 2.5.6 Data presentation and interpretation, 2.5.7 Data presentation and interpretation, 2.5.8 Data presentation and interpretation, 2.5.9 Data presentation and interpretation, and 2.5 Data presentation and interpretation. Each one has a worked solution and a mark scheme showing where the marks go.