Question 35
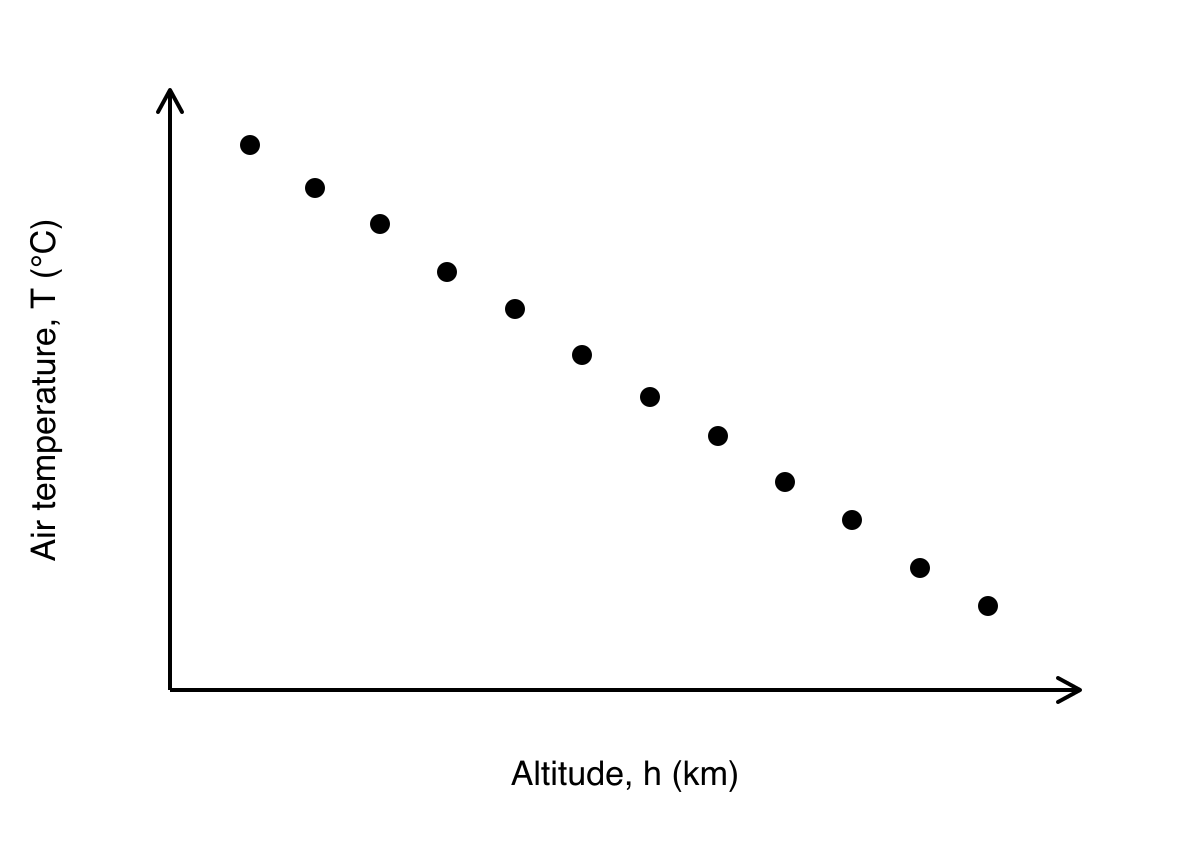
An atmospheric scientist records the relationship between the altitude hhh (in km) and the air temperature TTT (in ∘C{}^\circ\text{C}∘C) above a fixed ground location. The resulting scatter graph shows that as altitude increases, the temperature decreases consistently. The data points are positioned extremely close to a straight line of best fit, with almost no visible deviation from the linear path.
Which of the options below best describes the correlation between hhh and TTT?
-
moderate positive
-
strong positive
-
moderate negative
-
strong negative
2.2 L: Data presentation and interpretation Questions
244 exam-style questions on AQA A Level Maths 2.2 L: Data presentation and interpretation, covering 2.2.1 Single-variable data diagrams, 2.2.2 Scatter diagrams and correlation, 2.2.3 Central tendency, variation and standard deviation, 2.2.4 Outliers and cleaning data, and 2.2 L: Data presentation and interpretation. Each one has a worked solution and a mark scheme showing where the marks go.