

What you'll learn
- How to read macroeconomic indicators without being misled by one data point.
- The key trends in UK economic performance over roughly the last two decades.
- How to compare the UK with other developed, emerging and developing economies.
- How to build an evaluative judgement for OCR H460 macro essays.
1. What is a macroeconomic indicator?
A macroeconomic indicator is a statistic used to judge the performance of the whole economy. In this topic, you are not just memorising figures: you are learning how to interpret the story behind them.
Macroeconomic indicator
A macroeconomic indicator is a measurable variable that helps assess the performance of an economy, such as real GDP growth, inflation, unemployment, productivity or the current account balance.
The main indicators you should be comfortable using are:
| Indicator | What it measures | Why it matters |
|---|---|---|
| Real GDP growth | Growth in national output after adjusting for inflation | Shows whether the economy is expanding or contracting |
| CPI inflation | Annual percentage change in the Consumer Prices Index | Shows the rate at which the general price level is rising |
| Unemployment rate | The share of the labour force without work but actively seeking it | Shows spare labour capacity and living-standard pressures |
| Current account balance | Trade in goods and services plus net income and transfers with the rest of the world | Shows external performance and reliance on foreign finance |
| Productivity | Output per worker or per hour worked | Drives long-run living standards and competitiveness |
| Real GDP per head | Inflation-adjusted output per person | A better guide to average living standards than total GDP |
One indicator is never enough
Good macroeconomic judgement comes from using several indicators together. For example, fast GDP growth looks less impressive if inflation is high, real wages are falling, or growth is driven by unsustainable borrowing.
2. Reading trends: levels, growth rates and real values
Before analysing the UK, you need three basic distinctions.
A level is the size of a variable at a point in time, such as GDP of £2.3 trillion. A growth rate is the percentage change in that variable over time. Nominal values are measured in current prices, while real values are adjusted for inflation.
Real value
A real value has been adjusted for inflation, so it shows changes in purchasing power or actual output rather than changes caused simply by rising prices.
For trend questions, real data are usually more useful than nominal data. If nominal GDP rises by 6% but prices rise by 5%, real output has only risen by about 1%.
Comparing GDP and GDP per head
Suppose UK real GDP rises from £2,200 billion to £2,244 billion, while the population rises from 67.0 million to 67.7 million.
-
Calculate headline real GDP growth using g=new−oldold×100g = \frac{\text{new} - \text{old}}{\text{old}} \times 100g=oldnew−old×100:
g=2,244−2,2002,200×100=2.0%g = \frac{2{,}244 - 2{,}200}{2{,}200} \times 100 = 2.0\%g=2,2002,244−2,200×100=2.0%. -
Convert real GDP into output per person: £2,200 billion divided by 67.0 million is about £32,836 per person; £2,244 billion divided by 67.7 million is about £33,146 per person.
-
Calculate real GDP per head growth:
33,146−32,83633,146×100≈0.9%\frac{33{,}146 - 32{,}836}{33{,}146} \times 100 \approx 0.9\%33,14633,146−32,836×100≈0.9%.
So average living standards rose much more slowly than headline GDP.
Confusing GDP growth with living standards
Do not assume that total GDP growth automatically means people are better off. If population growth is strong, GDP per head may grow only slowly or even fall.
3. Trend growth and the economic cycle
Economies rarely grow smoothly. They move through the economic cycle, meaning short-run fluctuations in real GDP around the economy’s long-run productive capacity.
Economic cycle
The economic cycle refers to fluctuations in actual real GDP around trend output, including periods of recovery, boom, slowdown and recession.
A trend-and-cycle diagram helps you separate long-run capacity from short-run demand conditions.
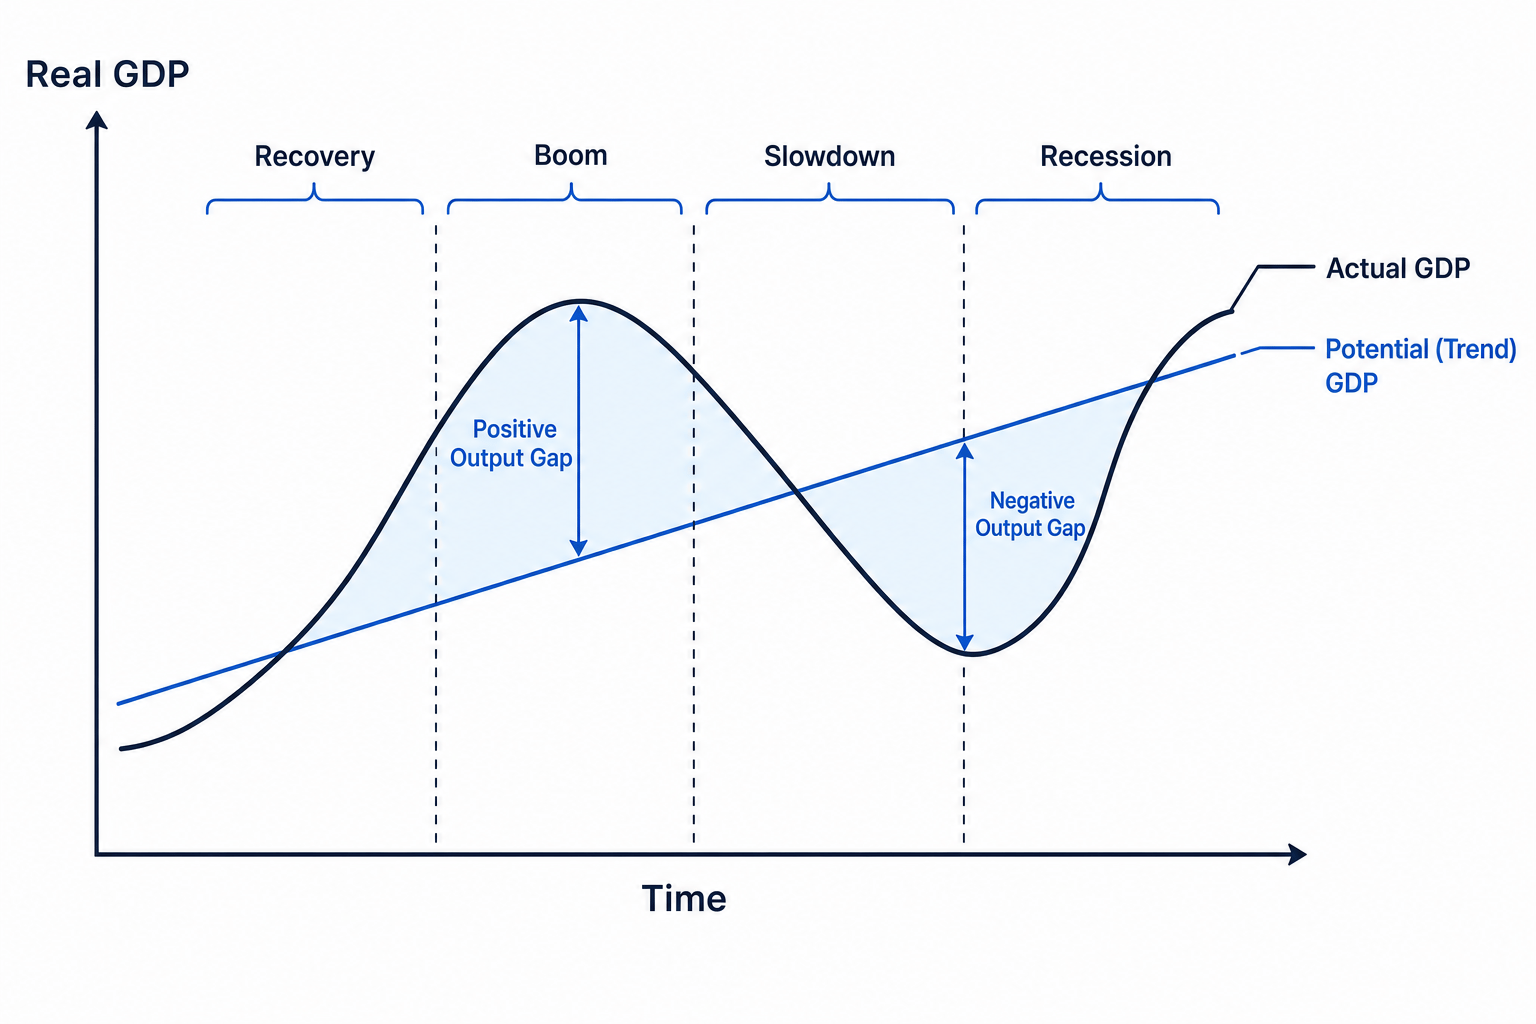
When actual GDP is above trend GDP, there is a positive output gap. Firms may face capacity pressures, labour shortages and rising costs, so inflationary pressure can build. When actual GDP is below trend GDP, there is a negative output gap, meaning spare capacity and usually weaker inflationary pressure.
Trend versus cycle
The cycle tells you about short-run demand pressure. The trend tells you about long-run productive potential, which depends on productivity, investment, labour supply, skills and technology.
4. Key UK macroeconomic trends over the last two decades
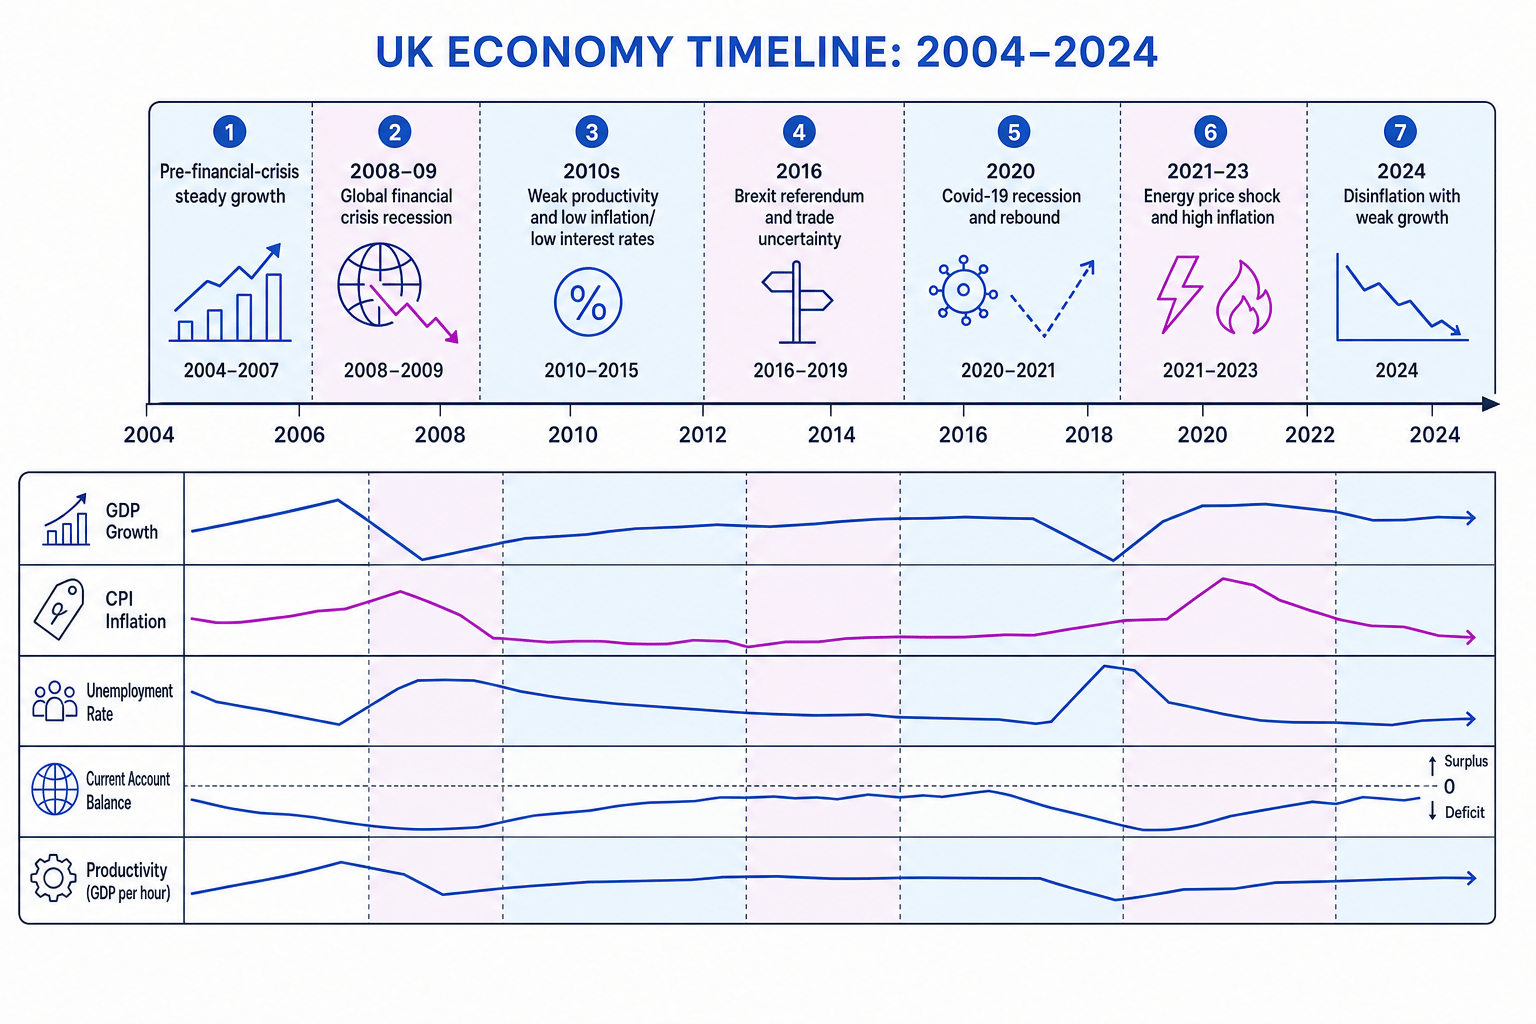
The broad UK story is one of repeated shocks: the global financial crisis, austerity and weak productivity, Brexit uncertainty, Covid-19, then the energy-price and cost-of-living shock.
2004–2007: relatively stable growth
Before the global financial crisis, the UK had steady growth, low and stable inflation, and relatively low unemployment. This period was sometimes associated with confidence in inflation targeting and financial-sector growth, especially in London.
However, the economy also became exposed to weaknesses in banking and household debt. A stable-looking indicator can hide underlying financial fragility.
2008–2009: global financial crisis and recession
The 2008–09 financial crisis caused a deep recession. Real GDP fell sharply, banks reduced lending, business confidence collapsed, and unemployment rose.
The Bank of England cut interest rates dramatically and used quantitative easing, which means creating central bank money to buy financial assets and lower longer-term borrowing costs.
The key macro lesson is that a demand shock can quickly damage output, employment, government borrowing and financial stability at the same time.
2010s: weak productivity and slow living-standard growth
The UK recovered, but the recovery was not especially strong by historical standards. The major long-run issue was weak productivity growth, often called the UK’s productivity puzzle.
Productivity puzzle
The productivity puzzle refers to the unusually weak growth of UK output per worker or per hour after the 2008 financial crisis, despite employment recovering.
Unemployment fell to historically low levels by the late 2010s, which looked positive. But real wage growth and GDP per head were weaker, suggesting that many new jobs were relatively low-productivity or that business investment was insufficient.
Brexit added uncertainty after the 2016 referendum. Sterling depreciation raised import prices, pushing up inflation for a period, while trade frictions and uncertainty may have reduced investment and damaged potential growth.
2020–2021: Covid-19 recession and rebound
Covid-19 caused an exceptional fall in GDP because lockdowns restricted production and spending. The furlough scheme helped prevent unemployment from rising as much as it otherwise would have.
This is a useful evaluation point: unemployment data alone understated the scale of spare capacity because many workers were temporarily supported by government.
2021–2024: inflation shock, interest rates and weak growth
After the pandemic, demand recovered quickly, but supply chains were disrupted. Then Russia’s invasion of Ukraine contributed to a major energy-price shock. UK CPI inflation peaked at over 11% in 2022, far above the Bank of England’s 2% target.
The Bank of England raised interest rates sharply from the very low levels of the 2010s. Higher interest rates reduced borrowing and spending, especially for mortgage holders and firms needing finance. Inflation later fell closer to target, but growth remained weak and living standards were squeezed.
Anchor your essays in shocks
For UK trend questions, organise your analysis around shocks: 2008 financial crisis, 2016 Brexit uncertainty, 2020 Covid-19, and 2021–23 energy and inflation shock.
5. Comparing the UK with other economies
OCR also expects you to evaluate the UK’s current performance against other developed, emerging and developing economies.
Developed, emerging and developing economies
A developed economy has high income per head, advanced institutions and diversified production. An emerging economy is growing rapidly and becoming more integrated into global markets. A developing economy usually has lower income per head, weaker infrastructure and greater vulnerability to shocks.
Compared with other developed economies
The UK’s recent performance is mixed.
Compared with the United States, the UK has generally had weaker productivity growth, weaker investment and slower growth in real GDP per head. The US has benefited from a larger technology sector, deeper capital markets and stronger post-pandemic demand.
Compared with parts of Europe, the judgement is less one-sided. Germany has faced industrial weakness and energy-price pressures. Some eurozone economies have had higher unemployment than the UK. The UK labour market has often looked relatively strong, but this has been partly offset by high inactivity, NHS waiting lists affecting labour supply, and weak productivity.
So, against developed economies, the UK is not simply “the worst” or “doing well”. A balanced judgement would be: employment performance has often been resilient, but growth in productivity, real wages and GDP per head has been disappointing.
Compared with emerging and developing economies
Emerging economies such as India, Vietnam or Indonesia often grow faster than the UK. This is partly due to catch-up growth, where poorer economies can grow rapidly by adopting existing technology, urbanising, improving infrastructure and moving workers into higher-productivity sectors.
Growth rates need context
A developing economy growing at 6% may still have much lower GDP per head than the UK. A developed economy growing at 1% may still provide higher average living standards, stronger institutions and more stable public services.
The UK looks stronger on financial stability, rule of law, public services, higher GDP per head and access to global capital markets. But it looks weaker on headline growth, infrastructure momentum, demographics and sometimes business investment.
Ranking countries using one statistic
Do not say one economy is “better” just because its GDP growth is higher. Compare growth, inflation, unemployment, GDP per head, productivity, inequality and stability.
6. Building an evaluative judgement
A strong evaluation weighs up the indicator, time period and comparison group.
If the comparison is with other developed economies, the UK’s main weakness is structural: low productivity and weak investment reduce long-run trend growth. Its relative strength is a flexible labour market and a large services sector, especially finance, professional services and higher education.
If the comparison is with emerging economies, the UK’s main weakness is low headline growth. But this is partly expected because rich economies have less room for catch-up growth. The UK’s strength is a much higher starting level of income per head and stronger institutions.
Making a balanced comparison
Suppose the UK has GDP growth of 0.8%, inflation of 2.5% and unemployment of 4.5%, while an emerging economy has GDP growth of 6.5%, inflation of 6% and unemployment of 7%.
-
Compare headline growth first: the emerging economy is growing much faster, suggesting stronger expansion in output and possibly faster catch-up in living standards.
-
Add stability indicators: the UK has lower inflation and unemployment, so households and firms may face less macroeconomic volatility.
-
Make a judgement using context: the emerging economy may be improving faster, but the UK may still have higher GDP per head, stronger institutions and lower risk. The “better” performer depends on whether the question prioritises growth, stability or living standards.
Current data move quickly
For “current performance” essays, update your examples using recent ONS, Bank of England, OECD or IMF data. The structure of your evaluation matters more than memorising one exact figure.
Overall judgement
The UK’s macroeconomic performance over the last two decades has been shaped by major shocks and weak long-run productivity growth. Inflation and unemployment have moved with the cycle, but productivity and GDP per head reveal deeper structural problems.
Compared with other developed economies, the UK’s recent performance is best described as mediocre and uneven: relatively resilient employment, but weak productivity, investment and real living-standard growth. Compared with emerging and developing economies, the UK grows more slowly, but remains far richer and more stable on many broader measures.
In the exam
-
Start by identifying the indicator: real GDP growth, inflation, unemployment, current account, productivity or GDP per head.
-
Add context from the last two decades: financial crisis, Brexit, Covid-19, energy shock, Bank of England rate rises, and weak productivity.
-
Evaluate using a comparison: short run versus long run, total GDP versus GDP per head, developed versus emerging economies, and growth versus stability.
Check yourself
- Why might GDP growth give a misleading picture of living standards?
- Which UK macroeconomic indicators have looked relatively strong, and which have looked weak?
- Why do emerging economies often grow faster than developed economies like the UK?
