Income distribution and welfare
What you'll learn
- How income, wealth, poverty and inequality are different but connected.
- How economists measure inequality using quantiles, Gini coefficients and the Lorenz curve.
- Why governments may aim for a more even distribution of income.
- How to evaluate the causes and consequences of poverty and inequality.
Why distribution matters for welfare
In macroeconomics, governments do not only care about how much an economy produces. They also care about who receives the benefits of that production.
Economic welfare
Economic welfare means the wellbeing or standard of living people gain from economic activity. It includes income and consumption, but also wider factors such as health, education, security and opportunity.
A country can have rising GDP per head while many households still struggle with rent, food, energy bills or transport costs. This is why distribution matters: two economies with the same national income may produce very different living standards depending on how income is shared.
A key idea is the diminishing marginal utility of income: an extra £1 usually gives more additional welfare to a low-income household than to a very high-income household. This gives an economic reason for redistribution, not just a moral one.
Income, wealth, distribution and inequality
Income and wealth
Income is a flow of money received over a period of time, such as wages, salaries, rent, dividends, interest and benefits. Wealth is a stock of assets owned at a point in time, such as property, savings, shares and pensions, minus debts.
So, income is measured “per week” or “per year”, while wealth is measured “at a date”. A household may have low income but high wealth, for example a retired homeowner. Another may have high income but low wealth, for example a graduate with a good salary but large debts and no property.
Distribution and inequality
Distribution means how income or wealth is shared between people or households. Inequality means the extent to which income or wealth is unevenly distributed.
Income inequality and wealth inequality are related, but wealth is usually more unequal. This is because wealth can be accumulated over time, inherited, and boosted by rising asset prices such as house prices.
Do not mix up income and wealth
A high-income person is not automatically wealthy, and a wealthy person may not currently have a high income. In essays, state clearly whether you are discussing income inequality or wealth inequality.
The objective of a more even distribution of income
A government may aim for a more even distribution of income as part of its wider economic policy objectives. This means reducing excessive income gaps and improving living standards for lower-income households.
This does not usually mean making everyone’s income exactly equal. Some income differences may reflect skills, training, responsibility, risk-taking or hours worked. The objective is usually to reduce unfair or harmful inequality, not remove all incentives.
Governments may try to achieve this through:
- Progressive taxation, where higher-income households pay a higher proportion of income in tax.
- Welfare benefits, such as Universal Credit, child benefit or housing support.
- Minimum wage policies, such as the National Living Wage.
- Education and training, which can improve earning potential.
- Public services, such as the NHS and state education, which improve living standards without directly increasing money income.
Equity versus efficiency
Redistribution can improve equity and welfare, especially if it supports poorer households. But if taxes or benefits are poorly designed, they may weaken incentives to work, save, invest or start a business.
Absolute and relative poverty
Absolute poverty
Absolute poverty means being unable to afford basic necessities needed for survival or a minimum acceptable standard of living, such as food, shelter, heating and clothing.
Absolute poverty is often measured against a fixed real-terms standard. Globally, the World Bank uses international poverty lines, but in the UK exam context you should focus on whether households can meet basic needs after allowing for prices.
Relative poverty
Relative poverty means having income significantly below the typical income in society, often measured as below 60% of median household income.
Relative poverty is about exclusion from normal living standards in that society. For example, a household may be able to buy food and shelter but still be unable to afford internet access, school trips, transport to work, or adequate heating.
Classifying poverty
Suppose median equivalised disposable household income is £30,000 per year. A household has disposable income of £16,500 per year.
- Calculate the relative poverty line as 60% of median income: 0.60×£30,000=£18,0000.60 \times \pounds 30{,}000 = \pounds 18{,}0000.60×£30,000=£18,000.
- Compare the household’s income with the poverty line: £16,500 is below £18,000.
- Conclude that the household is in relative poverty on this measure, because its income is below 60% of the median.
Be precise with poverty data
If you use poverty statistics, say whether the measure is before or after housing costs, and whether income is household, individual, or equivalised for household size.
Inequality data: quantiles and ratios
Economists use data to compare inequality across countries, over time, or before and after government intervention.
Quantiles
Quantiles divide a distribution into equal-sized groups. Common examples are quartiles into 4 groups, quintiles into 5 groups, deciles into 10 groups, and percentiles into 100 groups.
For example, the top decile is the highest-income 10% of households. The bottom quintile is the lowest-income 20%. Quantiles help economists see whether income growth is concentrated at the top, middle or bottom of the distribution.
Useful inequality measures include:
- 90:10 ratio: income at the 90th percentile divided by income at the 10th percentile.
- 80:20 ratio: income share of the top 20% divided by income share of the bottom 20%.
- Top 1% share: the proportion of total income received by the richest 1%.
- Median income: the income of the middle household, less distorted by extreme incomes than the mean.
Using a 90:10 income ratio
Suppose the household at the 90th percentile earns £60,000 per year, while the household at the 10th percentile earns £15,000 per year.
- Use the ratio formula: 90:10 ratio=income at 90th percentileincome at 10th percentile\text{90:10 ratio} = \frac{\text{income at 90th percentile}}{\text{income at 10th percentile}}90:10 ratio=income at 10th percentileincome at 90th percentile.
- Substitute the data: £60,000£15,000=4\frac{\pounds 60{,}000}{\pounds 15{,}000} = 4£15,000£60,000=4.
- Interpret the result: the 90th-percentile household earns 4 times as much as the 10th-percentile household.
The Gini coefficient
Gini coefficient
The Gini coefficient is a measure of inequality between 0 and 1. A value of 0 means perfect equality; a value of 1 means perfect inequality.
A higher Gini coefficient means a more unequal distribution. For example, a country with a Gini coefficient of 0.35 is more unequal than one with a Gini coefficient of 0.25.
However, always check what is being measured. A Gini coefficient can refer to income before taxes and benefits, income after taxes and benefits, or wealth. These may give very different results.
The Lorenz curve
The Lorenz curve is a diagram showing the distribution of income. It plots the cumulative percentage of households on the horizontal axis against the cumulative percentage of income on the vertical axis.
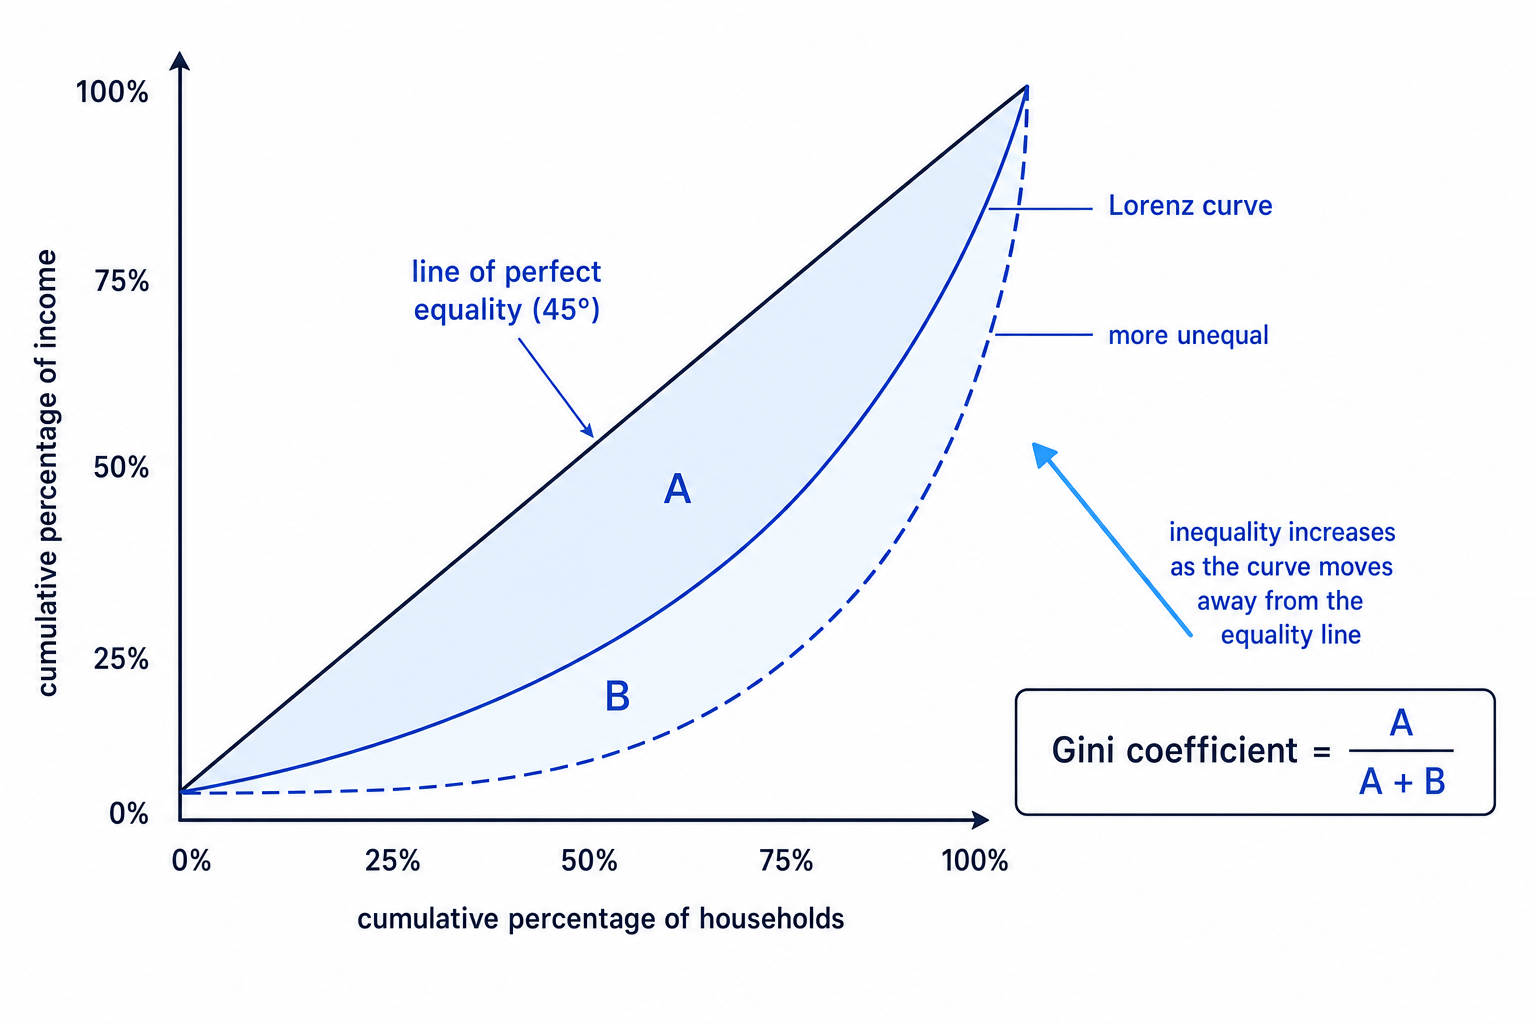
The 45-degree line shows perfect equality. For example, the bottom 20% of households would receive 20% of total income, the bottom 50% would receive 50%, and so on.
The Lorenz curve lies below the line of equality because income is unequally distributed. The further the curve bends away from the equality line, the greater the inequality.
The Gini coefficient is based on the areas in the diagram:
G=AA+BG = \frac{A}{A + B}G=A+BAwhere area A is between the line of equality and the Lorenz curve, and area B is below the Lorenz curve.
Reading a Lorenz curve
Suppose a Lorenz curve shows that the bottom 40% of households receive 15% of total income.
- Compare this with perfect equality: under perfect equality, the bottom 40% would receive 40% of total income.
- Measure the gap: the bottom 40% receive 25 percentage points less than under perfect equality.
- Interpret the curve: income is unequal, and the larger the gap between the Lorenz curve and the equality line, the higher the Gini coefficient.
Causes of poverty and inequality
Poverty and inequality rarely have one single cause. In strong essays, link causes together rather than listing them separately.
Labour market causes
Differences in wages are a major source of income inequality. Higher-skilled workers often earn more because their labour is more productive or in shorter supply. Technological change can increase demand for skilled workers while reducing demand for routine jobs.
Globalisation can also widen wage gaps. Some UK workers face competition from lower-cost overseas labour, while highly skilled professionals may benefit from larger global markets.
Unemployment, underemployment and insecure work can cause poverty because households receive less earned income and may rely on benefits.
Education, health and opportunity
Low educational attainment can reduce access to high-paid work. Poor health can limit working hours or productivity. Poverty can also reduce educational outcomes, creating a cycle where disadvantage is passed between generations.
This links to Amartya Sen’s idea of capabilities: poverty is not only low income, but a lack of real freedom to achieve valued outcomes, such as being healthy, educated and able to participate in society.
Wealth, inheritance and asset prices
Wealth inequality can drive income inequality. People with property, shares or pensions may receive rent, dividends or capital gains. Inheritance can allow some households to buy homes or avoid debt, while others face high rents and limited savings.
In the UK, rising house prices have often benefited existing homeowners while making it harder for younger or lower-income households to build wealth.
Tax and benefit systems
Government policy can either reduce or increase inequality. Progressive taxes and benefits usually reduce disposable income inequality. However, cuts to benefits, frozen thresholds, weak enforcement of labour standards or regressive indirect taxes can increase pressure on low-income households.
Structural causes matter
Poverty is not only caused by individual choices. Labour markets, education, health, housing costs, discrimination and inherited wealth can all shape people’s opportunities.
Consequences of poverty and inequality
Effects on individuals and families
Poverty can reduce living standards directly. Households may face food insecurity, fuel poverty, overcrowded housing, debt, stress and worse health outcomes. Children in poverty may have fewer educational resources, which can reduce future earnings.
Inequality can also reduce welfare through relative deprivation. People may feel excluded if they cannot participate in normal social and economic life.
Effects on the economy
High poverty can reduce labour productivity if workers suffer poor health, poor nutrition or low skills. It can also increase government spending on healthcare, housing support and welfare benefits.
High inequality may reduce aggregate demand if more income goes to richer households with a lower marginal propensity to consume. Redistributing income towards poorer households may therefore increase consumption in the short run.
However, some inequality can support economic efficiency. Higher rewards may encourage education, effort, enterprise and innovation. For example, entrepreneurs may take risks because successful businesses can generate high returns.
Effects on society and politics
Severe inequality may weaken social cohesion, increase crime, reduce trust in institutions and create political instability. It may also reduce equality of opportunity if richer households can buy better education, housing and networks.
Assuming all inequality is bad
A-level evaluation should recognise that some inequality may create incentives. The stronger argument is usually that excessive inequality and poverty damage welfare, opportunity and long-run growth.
Evaluation: how serious are poverty and inequality?
The impact depends on the type, size and persistence of inequality.
Income inequality may be less damaging if there is high social mobility, meaning people can move up the income distribution through education, work and enterprise. But if inequality is caused by inherited wealth, discrimination or poor access to education, it may become entrenched and harder to justify.
The short-run and long-run effects can also differ. In the short run, redistribution may boost welfare and consumption. In the long run, education, health and housing policies may be more effective because they tackle the causes of low earnings rather than only topping up incomes.
A balanced judgement is that governments should usually aim to reduce poverty as a priority, because poverty directly damages living standards and economic welfare. Reducing inequality is also important where it limits opportunity or harms social cohesion, but policy needs to preserve incentives and avoid government failure.
In the exam
- Define the measure you use: income or wealth, absolute or relative poverty, pre-tax or post-tax income.
- For Lorenz curve questions, label both axes, the 45-degree equality line, the Lorenz curve, and explain that a curve further from equality means higher inequality.
- Evaluate by weighing equity against efficiency: explain how reducing inequality may improve welfare, but also consider incentives, costs and long-run effects.
Check yourself
- Why can a household have high wealth but low income?
- How does the Lorenz curve show a more unequal distribution of income?
- What are two causes and two consequences of relative poverty in the UK?
