Consumer and producer surplus
What you'll learn
- How to define and draw consumer surplus and producer surplus.
- How to calculate surplus areas from demand and supply diagrams.
- How price rises and falls affect surplus for consumers and producers.
- How to evaluate who really gains or loses when prices change.
The prerequisite: demand and supply curves contain welfare information
Before surplus makes sense, you need to read demand and supply curves as more than “lines on a graph”.
A demand curve shows the quantity consumers are willing and able to buy at each price. It can also be read as marginal benefit: the extra benefit from consuming one more unit, measured by the maximum price consumers are willing to pay for that unit.
A supply curve shows the quantity producers are willing and able to sell at each price. It can also be read as marginal cost: the extra cost of producing one more unit, measured by the minimum price producers need to receive.
An equilibrium is the price and quantity where quantity demanded equals quantity supplied. On a diagram, this is where demand and supply intersect.
Willingness to pay and minimum acceptable price
Willingness to pay is the maximum price a consumer would pay for a unit of a good. Minimum acceptable price is the lowest price a producer would accept to supply a unit, usually linked to the marginal cost of producing it.
Consumer surplus
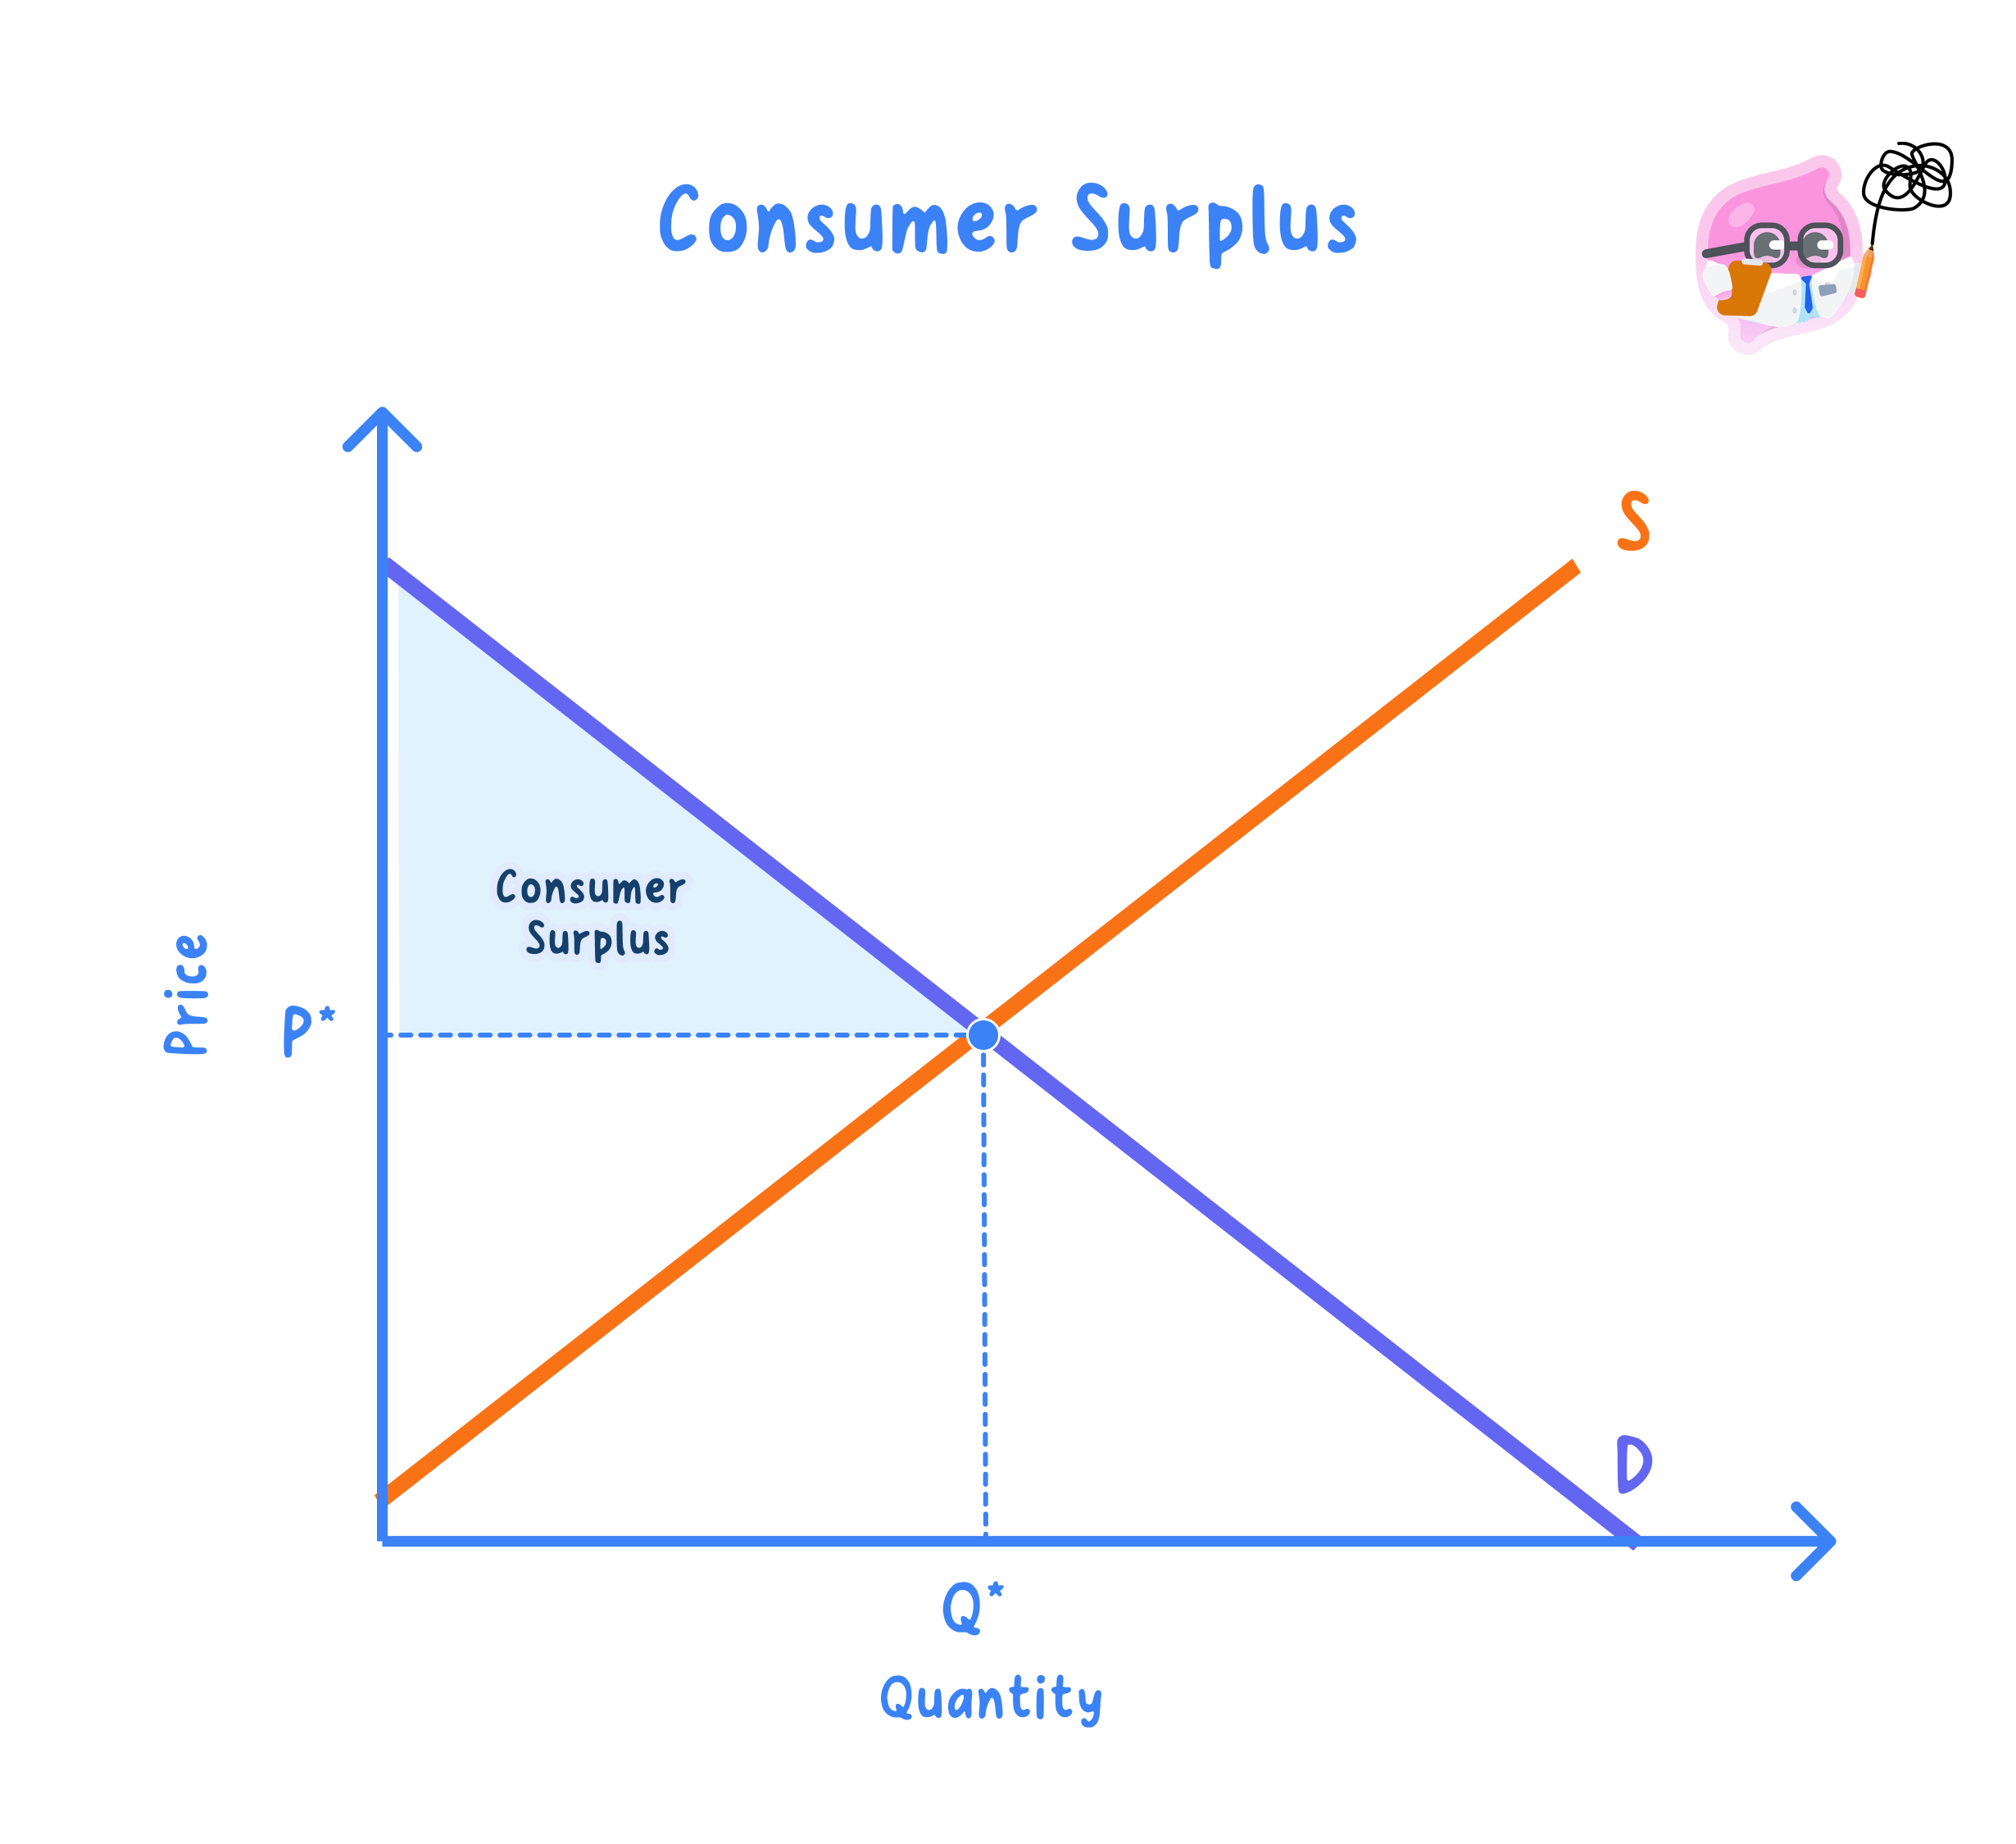
Consumer surplus measures the extra benefit consumers get when they pay less than they were willing to pay.
For example, if you would have paid £12 for a concert ticket but only pay £8, your individual consumer surplus is £4.
For a whole market, consumer surplus is the total of these gains across all consumers:
CS=∑(willingness to pay−P)\text{CS} = \sum(\text{willingness to pay} - P)CS=∑(willingness to pay−P)On a standard demand and supply diagram, consumer surplus is the area below the demand curve and above the market price, up to the quantity bought.
Consumer surplus
Consumer surplus is the difference between the price consumers are willing to pay and the price they actually pay, summed across all units purchased.
Producer surplus
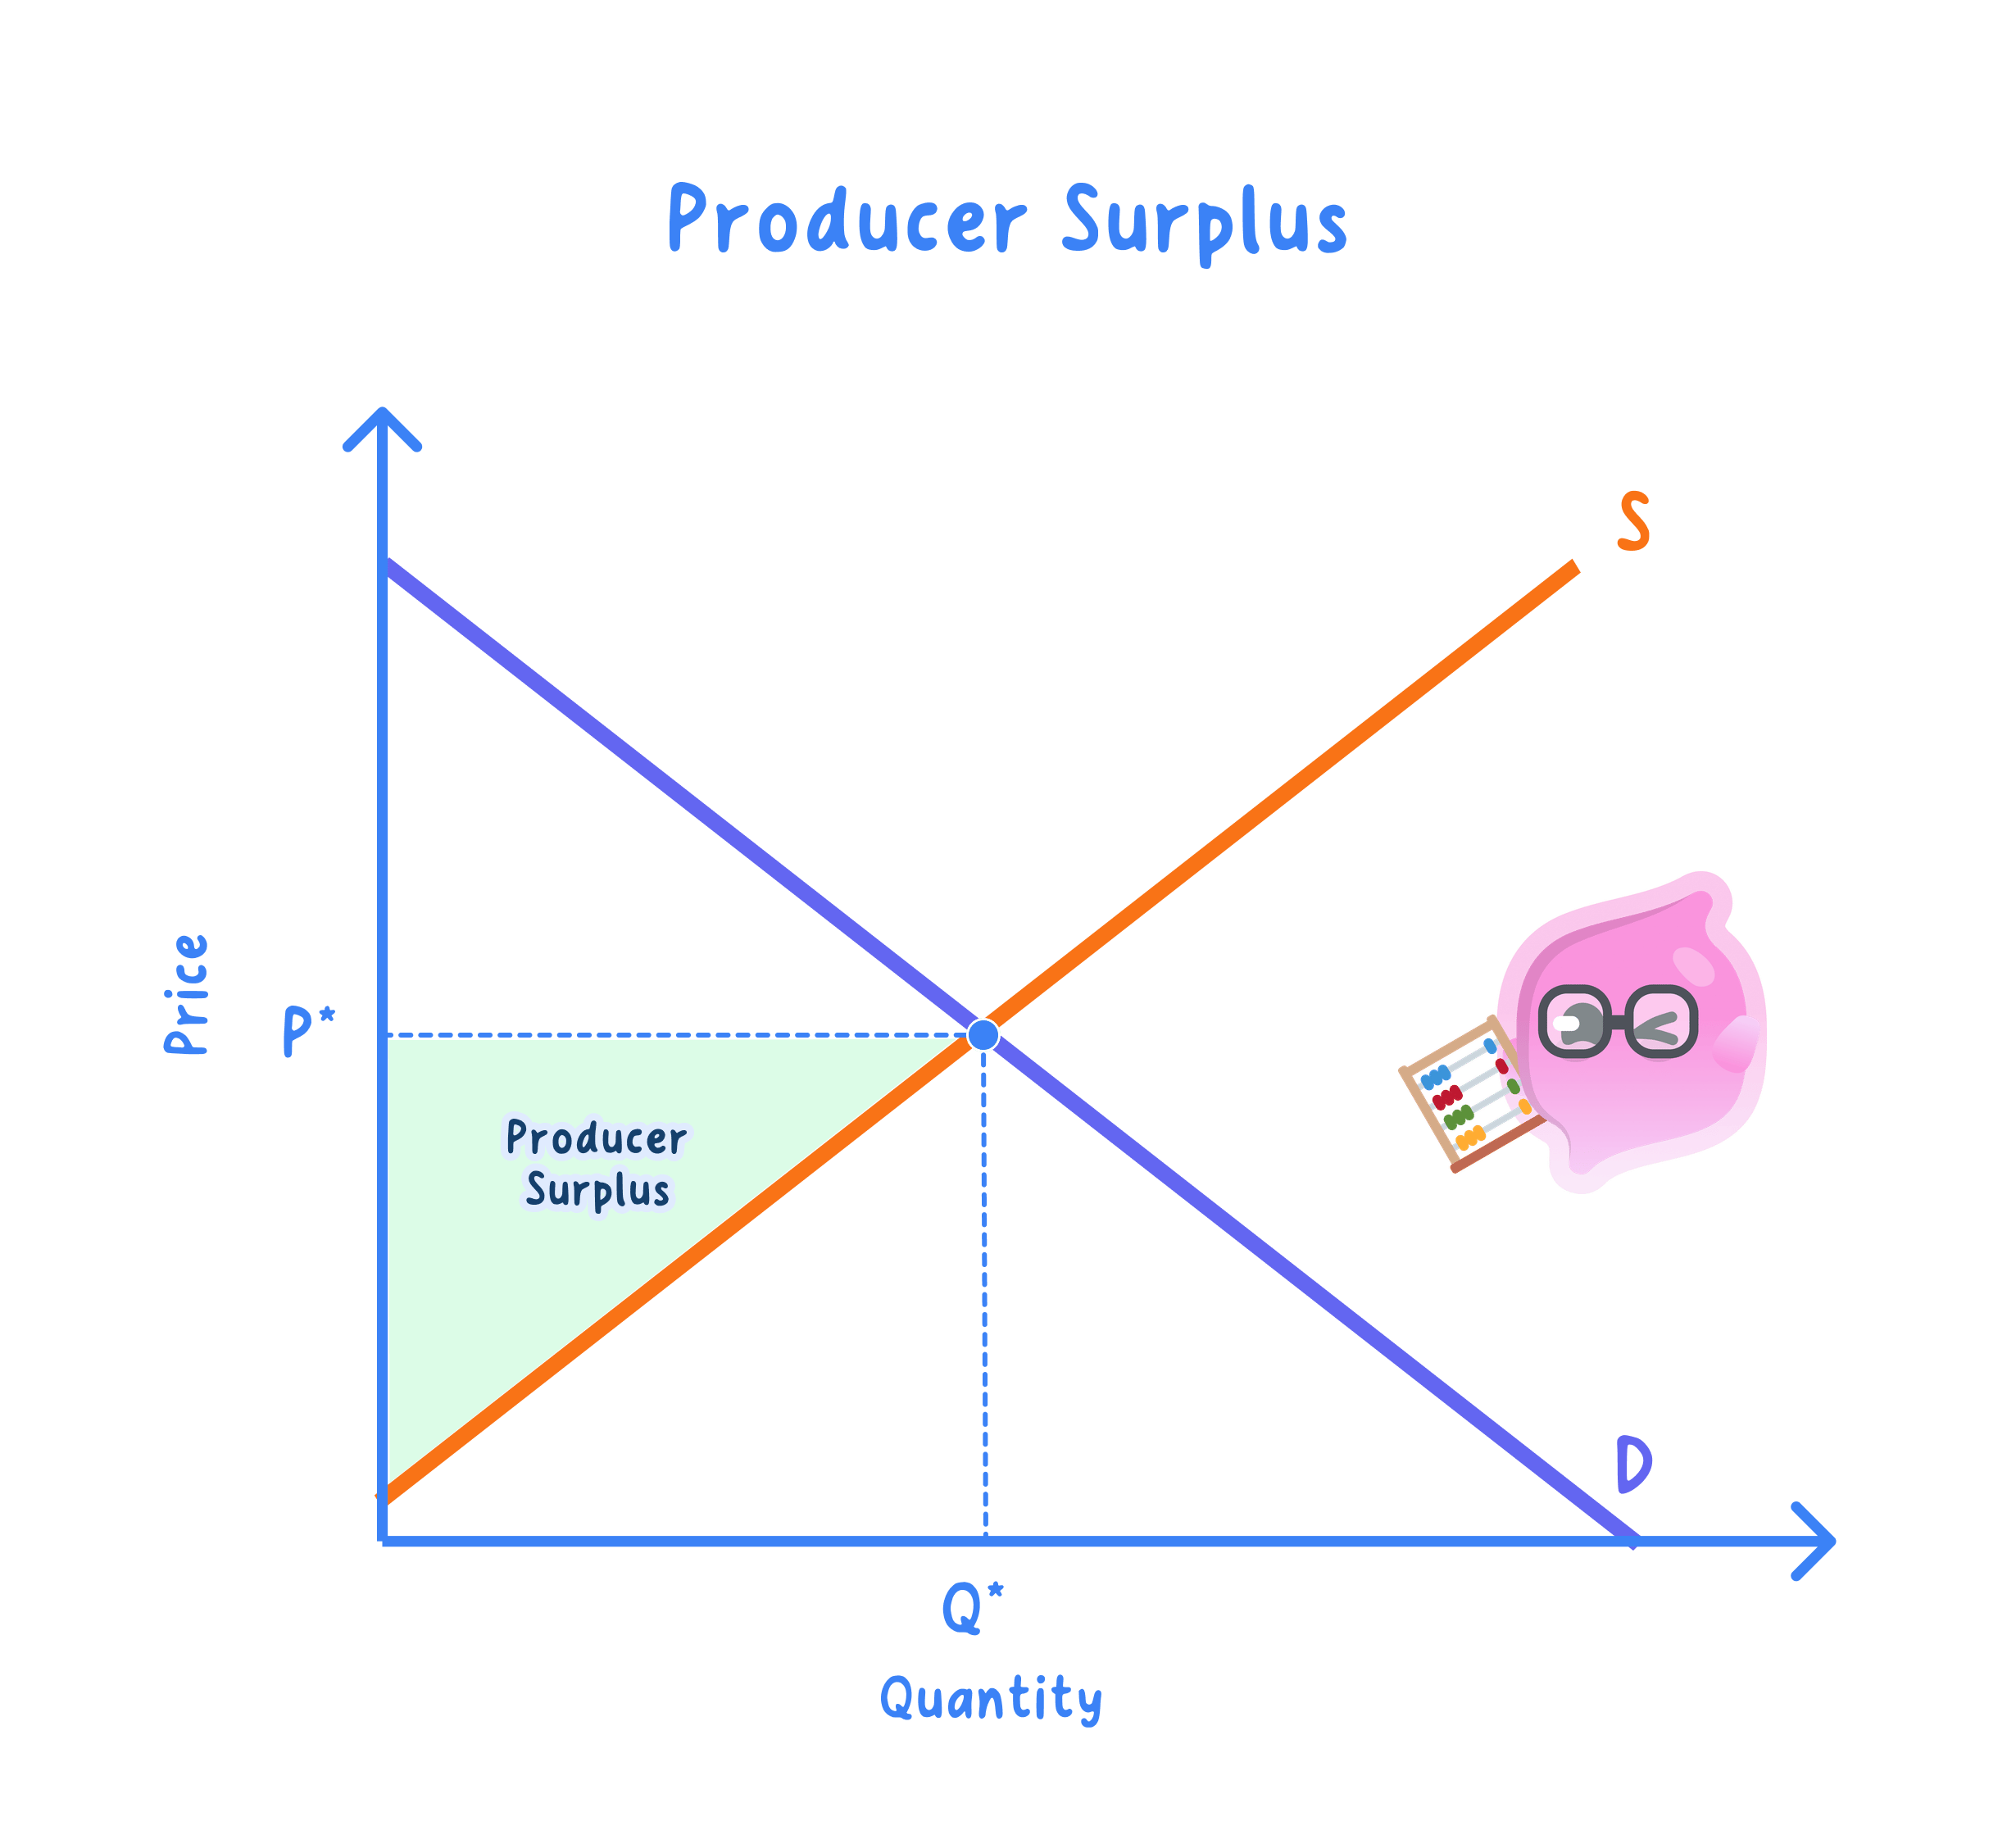
Producer surplus measures the extra benefit producers get when they receive more than the minimum price they would have accepted.
For example, if a firm would supply a unit for £5 but sells it for £9, producer surplus on that unit is £4.
For a whole market:
PS=∑(P−minimum acceptable price)\text{PS} = \sum(P - \text{minimum acceptable price})PS=∑(P−minimum acceptable price)On a diagram, producer surplus is the area above the supply curve and below the market price, up to the quantity sold.
Producer surplus
Producer surplus is the difference between the price producers receive and the minimum price they would have accepted, summed across all units sold.
Producer surplus is not the same as profit
Producer surplus is linked to revenue minus variable costs shown by the supply curve. Profit subtracts total costs, including fixed costs, so the two are related but not identical.
Drawing consumer and producer surplus
At the competitive equilibrium, price is P∗P^*P∗ and quantity is Q∗Q^*Q∗. Consumer surplus is the triangle above P∗P^*P∗ and below demand. Producer surplus is the triangle below P∗P^*P∗ and above supply.

The basic triangle formula is:
A=12×base×heightA=\frac{1}{2}\times\text{base}\times\text{height}A=21×base×heightIn surplus diagrams, the base is usually quantity, and the height is a price difference. Price per unit multiplied by quantity gives a money value, such as £.
Calculating surplus from a diagram
Suppose a market has a demand intercept of £30, a supply intercept of £6, an equilibrium price of £18, and an equilibrium quantity of 120 units.
-
Calculate consumer surplus height: consumers at the top of the demand curve would pay £30, but the market price is £18, so the height is £12.
-
Use the triangle formula for consumer surplus: with base 120 units and height £12, A=12×120×12=720A=\frac{1}{2}\times120\times12=720A=21×120×12=720, so consumer surplus is £720.
-
Calculate producer surplus height: the lowest acceptable price shown by the supply curve is £6, while producers receive £18, so the height is £12.
-
Use the triangle formula for producer surplus: with base 120 units and height £12, A=12×120×12=720A=\frac{1}{2}\times120\times12=720A=21×120×12=720, so producer surplus is £720.
Why equilibrium matters
If there are no externalities, a competitive market equilibrium maximises total economic welfare because all units where marginal benefit exceeds marginal cost are traded.
An externality is a cost or benefit affecting a third party that is not reflected in the market price. If externalities exist, private demand and supply may not represent the true social benefits and costs.
Effects of a price change on consumer surplus
When price rises, consumer surplus falls. This happens for two reasons:
- Consumers who still buy the good pay more.
- Some consumers leave the market because the price is now above their willingness to pay.
When price falls, consumer surplus rises. Existing consumers pay less, and extra consumers enter the market.
The left-hand panel below shows the loss of consumer surplus from a price rise. The right-hand panel shows the gain in producer surplus from a price rise.

Calculating the loss of consumer surplus
Suppose price rises from £10 to £14. Quantity demanded falls from 100 units to 70 units. Assume the demand curve is a straight line between these points.
-
Calculate the loss on units still bought: 70 units are still bought, but each now costs £4 more, so Arectangle=4×70=280A_{\text{rectangle}}=4\times70=280Arectangle=4×70=280. This is £280 of lost consumer surplus.
-
Calculate the loss from units no longer bought: quantity falls by 30 units, and the price change is £4, so Atriangle=12×4×30=60A_{\text{triangle}}=\frac{1}{2}\times4\times30=60Atriangle=21×4×30=60. This is £60 of lost consumer surplus.
-
Add both areas: total loss of consumer surplus is £280 plus £60, which equals £340.
Effects of a price change on producer surplus
When price rises, producer surplus normally rises, assuming producers actually receive the higher price. This happens because:
- Producers receive more on units they were already selling.
- Extra units become profitable to supply.
When price falls, producer surplus normally falls. Producers receive less on existing sales, and some units are no longer worth supplying.
Calculating the gain in producer surplus
Suppose price rises from £10 to £14. Quantity supplied rises from 50 units to 80 units. Assume the supply curve is a straight line between these points.
-
Calculate the gain on units already supplied: 50 units were already sold, and producers now receive £4 more per unit, so Arectangle=4×50=200A_{\text{rectangle}}=4\times50=200Arectangle=4×50=200. This is £200 of extra producer surplus.
-
Calculate the gain from extra units supplied: quantity supplied rises by 30 units, and the price rise is £4, so Atriangle=12×4×30=60A_{\text{triangle}}=\frac{1}{2}\times4\times30=60Atriangle=21×4×30=60. This is £60 of extra producer surplus.
-
Add both areas: total gain in producer surplus is £200 plus £60, which equals £260.
A quick direction check
Higher price usually means lower consumer surplus and higher producer surplus. Lower price usually means higher consumer surplus and lower producer surplus. Then check whether the diagram involves a demand shift, supply shift, tax, subsidy, price ceiling, or price floor.
Evaluating the impact of price changes
The simple rule is useful, but evaluation is about asking: how large is the effect, who is affected, and why did the price change?
1. The cause of the price change matters
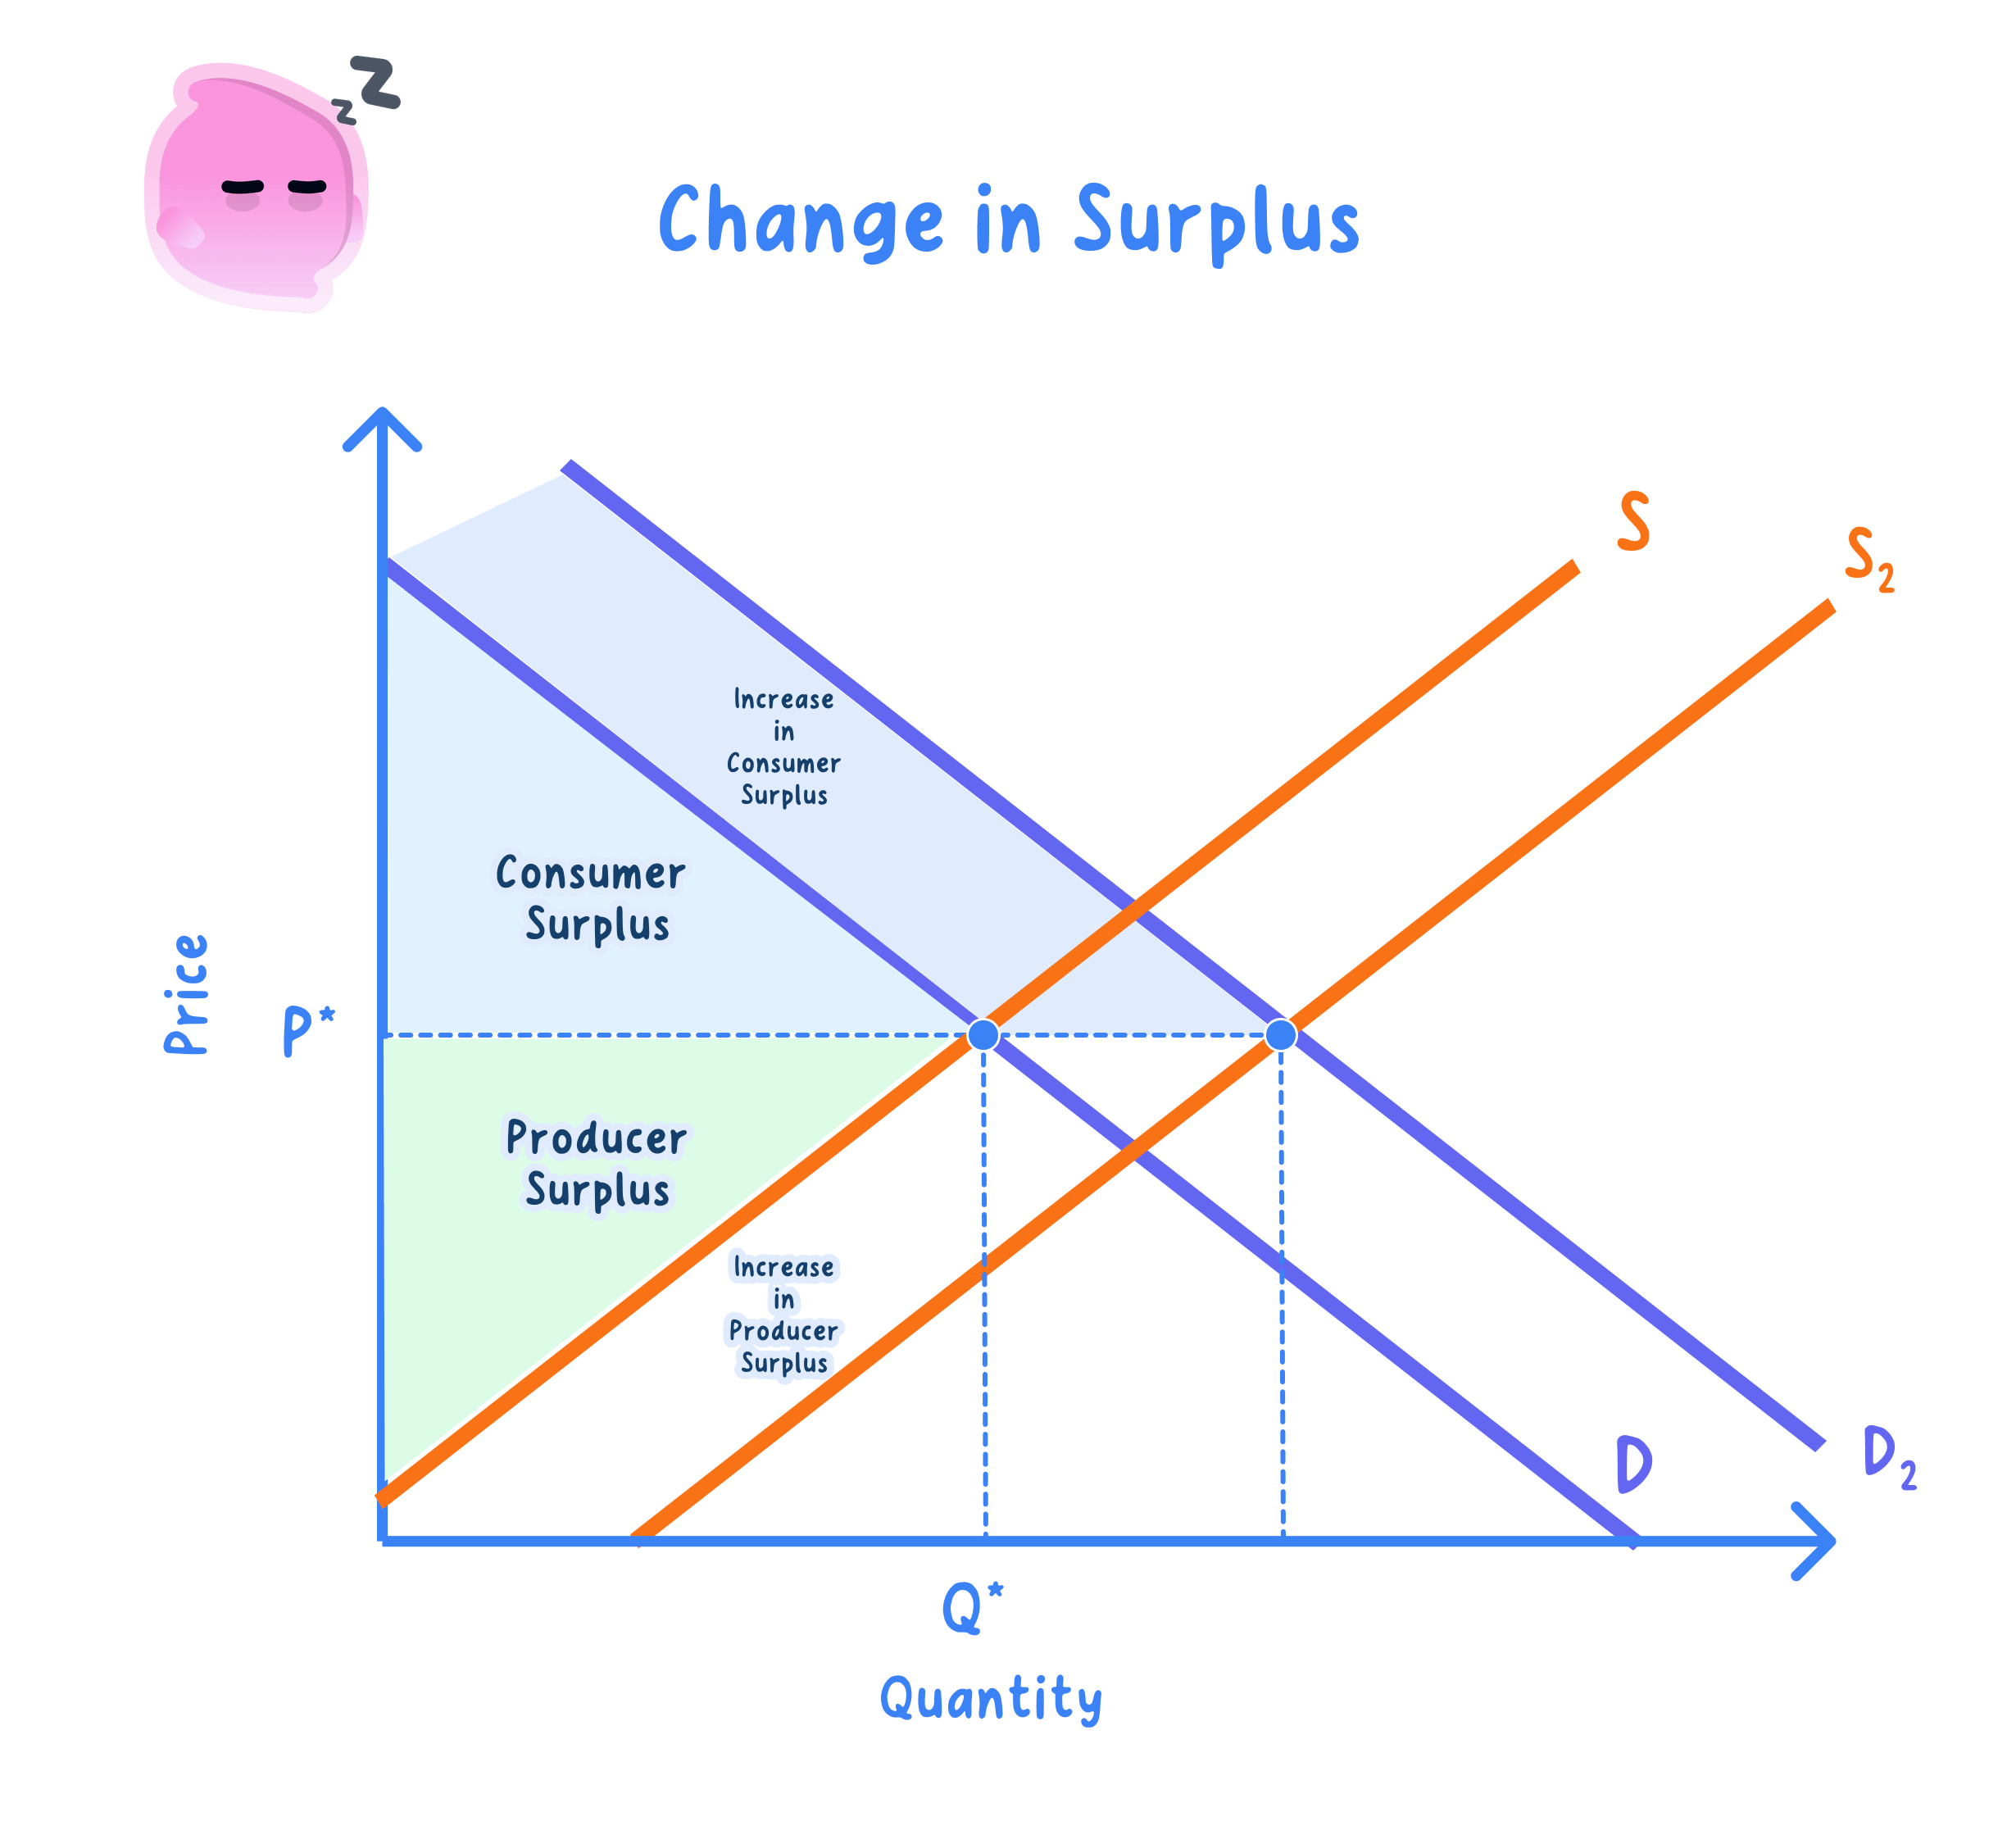
If price rises because demand has increased, producers may gain from both a higher price and higher quantity. Consumer surplus is less straightforward, because the demand curve itself has shifted: consumers now place a higher value on the product.
If price rises because supply has decreased, such as during an energy cost shock, consumers are likely to lose surplus, while producer surplus may be ambiguous. Some producers receive higher prices, but higher costs and lower output can reduce the overall gain.
This was relevant during the UK cost-of-living squeeze, when higher energy and food prices reduced consumer surplus sharply, especially for households buying essentials.
2. Elasticity affects the size of the surplus change
Price elasticity of demand measures how responsive quantity demanded is to a change in price.
For necessities such as electricity, gas, or basic food, demand is often price inelastic in the short run. That means a price rise causes a relatively small fall in quantity demanded, so consumers keep buying but pay much more. The loss of consumer surplus can be large.
For goods with many substitutes, such as restaurant meals or branded clothing, demand is more elastic. Consumers can switch away, so firms may gain less producer surplus from raising prices.
3. Short run and long run may differ
In the short run, consumers may have few alternatives. For example, commuters may still need petrol even after a price rise.
In the long run, consumers can adjust by buying more efficient cars, using public transport, changing supplier, or reducing consumption. This makes demand more elastic over time, so the long-run surplus impact may be smaller or distributed differently.
4. Surplus changes can be transfers or welfare losses
A transfer is when surplus moves from one group to another without necessarily reducing total welfare. For example, if consumers pay a higher price and producers receive it, some consumer surplus becomes producer surplus.
A deadweight loss is a loss of total economic welfare where mutually beneficial trades no longer happen. This can occur with taxes, monopoly pricing, or price controls.
Forgetting which price producers receive
With an indirect tax, consumers may pay a higher price, but producers may receive a lower price after tax. Do not automatically say producer surplus rises just because the consumer price rises.
Overall judgement
A price rise usually reduces consumer surplus and may increase producer surplus, but the final impact depends on the cause of the price rise, the elasticity of demand and supply, and whether the higher price reflects a genuine increase in value or a restriction in output.
For essentials with inelastic demand, such as household energy, price rises tend to create significant consumer losses and distributional concerns. For markets where higher prices encourage innovation, investment, or increased supply, some loss of consumer surplus may be partly offset by long-run gains in availability or quality.
In the exam
-
Define consumer surplus and producer surplus accurately, then label the areas on a diagram.
-
When analysing a price change, split the effect into the rectangle on existing units and the triangle on units gained or lost.
-
Evaluate using cause, elasticity, time period, and stakeholder impact before reaching a supported judgement.
Check yourself
- Why is consumer surplus found above the market price but below the demand curve?
- If price rises from £20 to £25 and quantity demanded falls, what two areas make up the loss of consumer surplus?
- Why might a producer not gain surplus when the price paid by consumers rises?