Supply
What you'll learn
- Why supply curves usually slope upwards.
- How individual firms’ supply adds up to market supply.
- The difference between joint supply and competitive supply.
- How to distinguish movements along a supply curve from shifts of the whole curve.
1. Starting point: what is supply?
In a market, demand comes from buyers and supply comes from sellers. Supply is about what producers are prepared to sell, not what consumers want to buy.
For A-Level Economics, always include the idea that producers must be both willing and able to sell.
Supply and quantity supplied
- Supply is the quantity of a good or service that producers are willing and able to offer for sale at each possible price over a given time period, ceteris paribus.
- Quantity supplied is the amount producers are willing and able to sell at one specific price.
- Ceteris paribus means “all other things being equal”. We isolate the effect of one variable while assuming other influences stay constant.
A supply schedule is a table showing quantity supplied at different prices. A supply curve is the same relationship shown on a diagram, with price on the vertical axis and quantity supplied on the horizontal axis.
Supply is the whole curve
Do not use “supply” and “quantity supplied” as if they mean the same thing. Supply means the whole relationship or curve. Quantity supplied means one point on that curve.
2. The relationship between price and quantity supplied
The usual relationship between price and quantity supplied is positive: as price rises, quantity supplied rises. This is called the law of supply.
There are two main reasons for this:
- Profit incentive: a higher price makes selling the good more profitable, so firms are encouraged to increase output.
- Rising marginal costs: as firms produce more in the short run, extra output may require overtime, less efficient machinery, or more expensive inputs. Firms need a higher price to cover these extra costs.
Marginal cost
Marginal cost is the extra cost of producing one more unit of output.
The left-hand diagram shows an extension and contraction of supply along one supply curve. The right-hand diagram shows shifts of the whole supply curve, which we cover later.

Explaining why a higher price increases quantity supplied
-
Suppose a small bakery can sell pastries at £2 each. At that price, only the lower-cost batches are profitable, so it supplies 200 pastries per week.
-
If the market price rises to £3, some extra batches that were previously not worth making now become profitable, even if they require overtime or more expensive ingredients.
-
The bakery therefore moves up along its existing supply curve and increases quantity supplied, perhaps from 200 to 300 pastries per week. This is an extension of supply, not an increase in supply.
The basic supply rule
A change in the good’s own price causes a movement along the supply curve. A change in any non-price condition of production shifts the whole supply curve.
3. Individual and market supply
An individual supply curve shows how much one producer is willing and able to supply at each price.
A market supply curve shows how much all producers in the market are willing and able to supply at each price.
Market supply
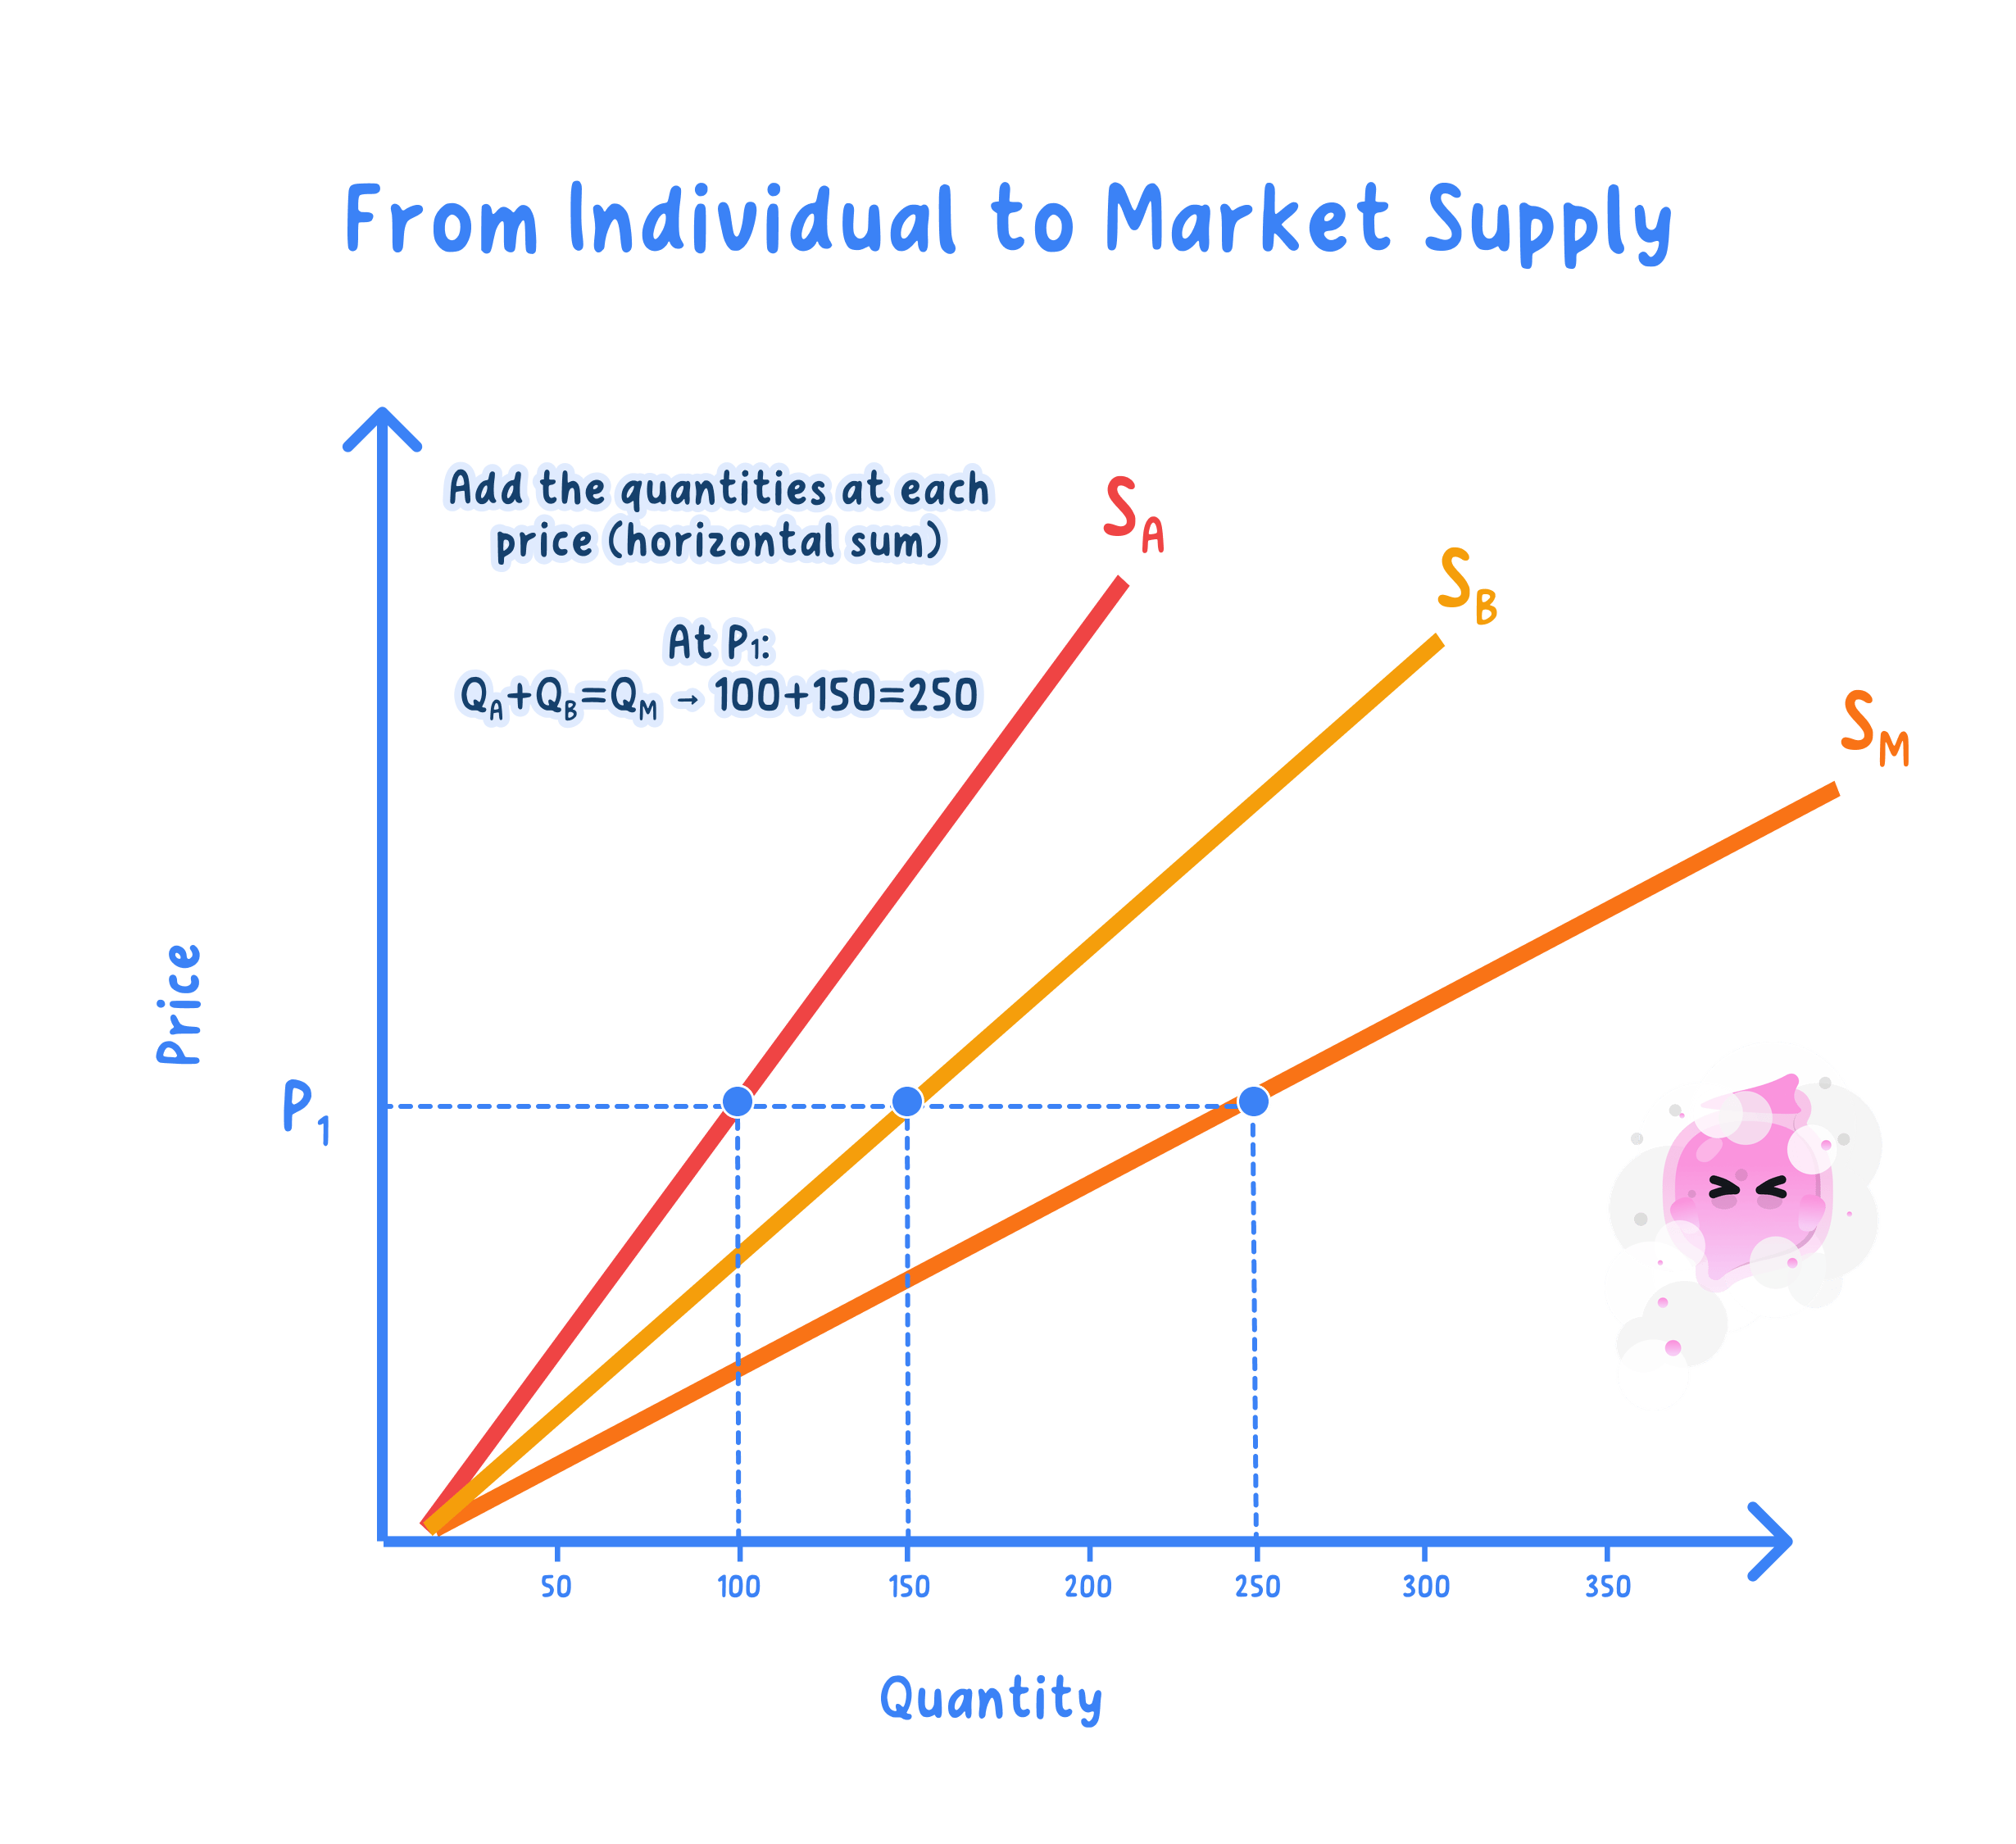
Market supply is the total quantity supplied by all firms in a market at each possible price over a given time period.
To find market supply, you add up the quantities supplied by each firm at the same price. This is called horizontal summation because you add quantities along the horizontal axis.

Adding individual supply to market supply
-
Hold the price constant. At price P1, Firm A supplies 20 units and Firm B supplies 30 units.
-
Add the quantities supplied at that same price using the relationship QM=QA+QBQ_M = Q_A + Q_BQM=QA+QB. Market quantity supplied is 50 units.
-
Repeat at price P2. Firm A supplies 40 units and Firm B supplies 50 units, so market quantity supplied is 90 units.
-
Plot the market points: 50 units at P1 and 90 units at P2. Joining these points gives the market supply curve.
Do not add prices
When constructing market supply, you add quantities at each price. You do not add Firm A’s price to Firm B’s price.
4. Joint supply and competitive supply
Some goods are linked on the supply side because they use the same production process or the same scarce resources.
Joint supply
Joint supply occurs when producing one good automatically produces another good as part of the same production process.
Examples include:
- Petrol and diesel from refining crude oil.
- Beef and leather from cattle.
- Lamb and wool from sheep.
If more crude oil is refined, the supply of both petrol and diesel may increase. The outputs are produced together.
Competitive supply
Competitive supply occurs when the same scarce resources can be used to produce alternative goods.
Examples include:
- Farmland used for wheat or barley.
- Milk used for butter or cheese.
- Factory capacity used for electric cars or petrol cars.
If more resources are switched into producing one good, fewer resources are available to produce the other. This creates an opportunity cost.
Opportunity cost
Opportunity cost is the value of the next best alternative forgone when a choice is made.
The diagram shows the contrast: joint supply tends to move related supplies in the same direction, while competitive supply moves them in opposite directions.

Identifying joint and competitive supply
-
A refinery increases crude oil processing because petrol prices rise. Since diesel is also produced from the same refining process, diesel supply may rise too. This is joint supply.
-
A farmer switches land from barley to wheat because wheat prices rise. More wheat is supplied, but less land remains for barley, so barley supply falls. This is competitive supply.
-
The key test is whether the goods come from the same process or compete for the same scarce resource. Same process means joint supply; same resource means competitive supply.
Joint supply is not the same as complementary demand
Joint supply is about how goods are produced, not how consumers use them. Petrol and diesel may be in joint supply even though consumers do not normally consume them together.
5. Movements along the supply curve
A movement along the supply curve happens when the good’s own price changes, assuming all other factors remain constant.
There are two types:
- Extension of supply: price rises, so quantity supplied rises. This is a movement up along the supply curve.
- Contraction of supply: price falls, so quantity supplied falls. This is a movement down along the supply curve.
Extension and contraction of supply
An extension of supply is an increase in quantity supplied caused by a rise in the good’s own price. A contraction of supply is a decrease in quantity supplied caused by a fall in the good’s own price.
For example, if the price of strawberries rises in summer, growers may supply more strawberries to supermarkets. That is an extension of supply. If the price falls, they may reduce quantity supplied. That is a contraction.
Exam shortcut
If the question says the price of the good itself has changed, think movement along the curve: extension if price rises, contraction if price falls.
6. Shifts of the supply curve
A shift of the supply curve happens when a non-price factor changes. This means producers are willing and able to supply a different quantity at every possible price.
An increase in supply is a rightward shift of the whole curve. At the same price, more is supplied.
A decrease in supply is a leftward shift of the whole curve. At the same price, less is supplied.
Shift of supply
A shift of supply occurs when a non-price determinant changes, causing producers to supply more or less at every price.
Common causes of supply shifts include:
- Costs of production: higher wages, rent, energy prices, or raw material costs reduce supply.
- Technology and productivity: better machinery or improved worker productivity can increase supply.
- Indirect taxes: taxes on production increase firms’ costs, reducing supply.
- Subsidies: government payments to producers lower effective costs, increasing supply.
- Number of firms: more firms entering the market increases market supply.
- Weather and natural shocks: poor weather can reduce agricultural supply.
- Regulation: stricter rules may raise costs and reduce supply.
- Exchange rates: if the pound depreciates, imported inputs become more expensive, which can reduce UK firms’ supply.
UK examples are useful for AO2. During the cost-of-living squeeze, high energy prices raised costs for many producers, shifting supply left. Post-pandemic supply-chain disruption also reduced supply in some markets, especially where firms relied on imported components.
Deciding whether supply moves or shifts
-
Suppose UK bakeries face a sharp rise in electricity prices while the price of bread itself has not changed. Electricity is an input cost, not the own price of bread.
-
Higher electricity costs raise the cost of producing each loaf. At each possible bread price, fewer loaves are profitable to produce.
-
The supply curve for bread shifts left. This is a decrease in supply, not a contraction of supply.
Use precise language
“Supply falls” means the whole curve shifts left. “Quantity supplied falls” means a movement down along the same curve. Examiners reward this distinction.
7. Bringing it together
When analysing supply, always ask:
- Has the price of the good itself changed?
- Or has a condition of production changed?
- Are we looking at one firm, the whole market, or linked products?
If it is the good’s own price, draw a movement along the existing curve. If it is anything else affecting producers’ willingness or ability to sell, draw a shift.
In the exam
-
Label supply diagrams fully: Price on the vertical axis, Quantity supplied on the horizontal axis, and curves as S, S1, S2 or similar.
-
Use the correct wording: extension/contraction for movements along the curve; increase/decrease in supply for shifts of the curve.
-
For market supply, explain that quantities are added at each price. For joint and competitive supply, identify whether goods share a production process or compete for scarce resources.
Check yourself
- Why does a supply curve usually slope upwards?
- What is the difference between an extension of supply and an increase in supply?
- How would you explain the difference between joint supply and competitive supply using examples?