Demand
What you'll learn
- What economists mean by demand, quantity demanded, and ceteris paribus.
- How to draw and explain a downward-sloping demand curve.
- How individual demand combines to form market demand.
- How to distinguish movements along a demand curve from shifts of the whole curve.
Starting point: what is demand?
A market is any arrangement where buyers and sellers interact to exchange a good or service. In a market, buyers create demand and sellers create supply.
Demand is not the same as simply “wanting” something. You may want a sports car, but unless you are both willing and able to pay for it, you do not create effective demand in the market.
Demand
Demand is the quantity of a good or service that consumers are willing and able to buy at different prices over a given time period, ceteris paribus.
Ceteris paribus means “all other things being equal”. Economists use it to isolate one relationship at a time. For demand, we first ask: what happens to quantity demanded when only the good’s own price changes?
Quantity demanded
Quantity demanded is the amount consumers are willing and able to buy at one specific price, over a given time period.
The relationship between price and quantity demanded
For most goods, there is an inverse relationship between price and quantity demanded:
- When price rises, quantity demanded tends to fall.
- When price falls, quantity demanded tends to rise.
This is known as the law of demand.
The law of demand
A demand curve usually slopes downwards because a lower price makes the good more attractive and affordable, so consumers demand a greater quantity.
There are three useful reasons for the downward slope:
1. The substitution effect
The substitution effect occurs when consumers switch towards a good because it has become cheaper relative to alternatives.
For example, if the price of train tickets falls while petrol prices stay the same, some commuters may switch from driving to taking the train.
2. The income effect
The income effect occurs when a price fall increases consumers’ real purchasing power. If a product becomes cheaper, your income can now buy more than before.
For example, if supermarket food prices fall, households may be able to buy more food, or buy better-quality food, with the same weekly budget.
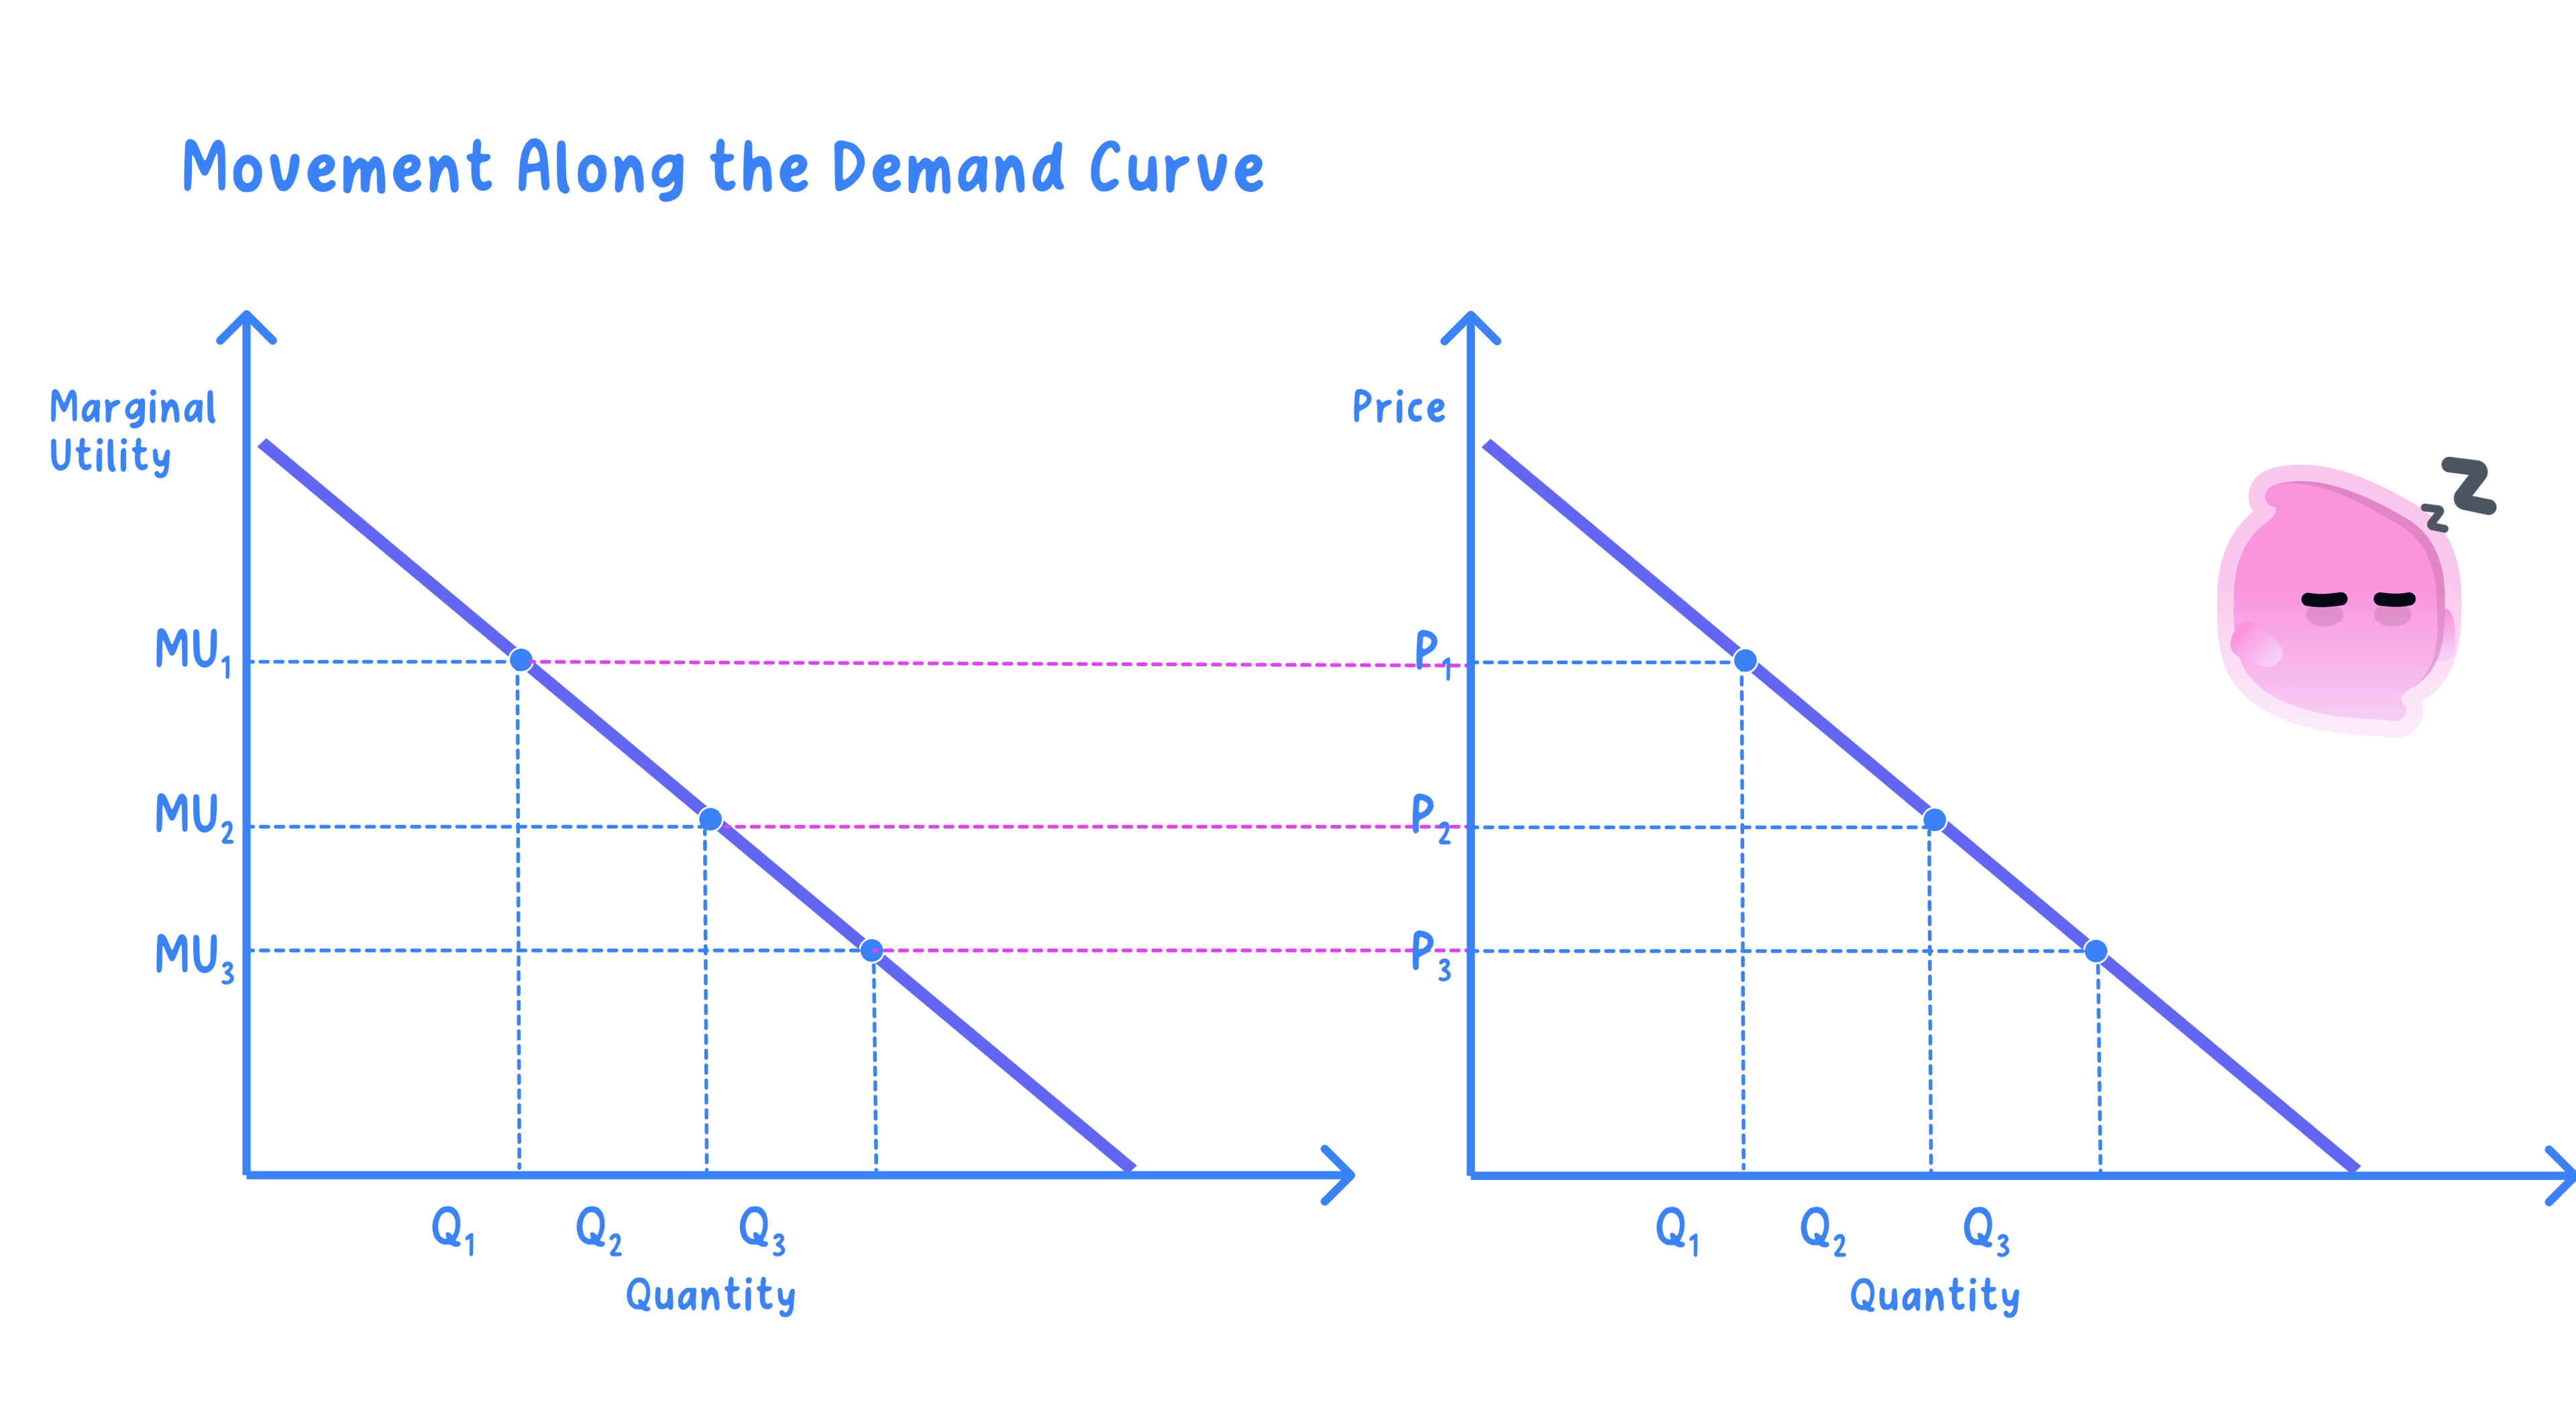
3. Diminishing marginal utility
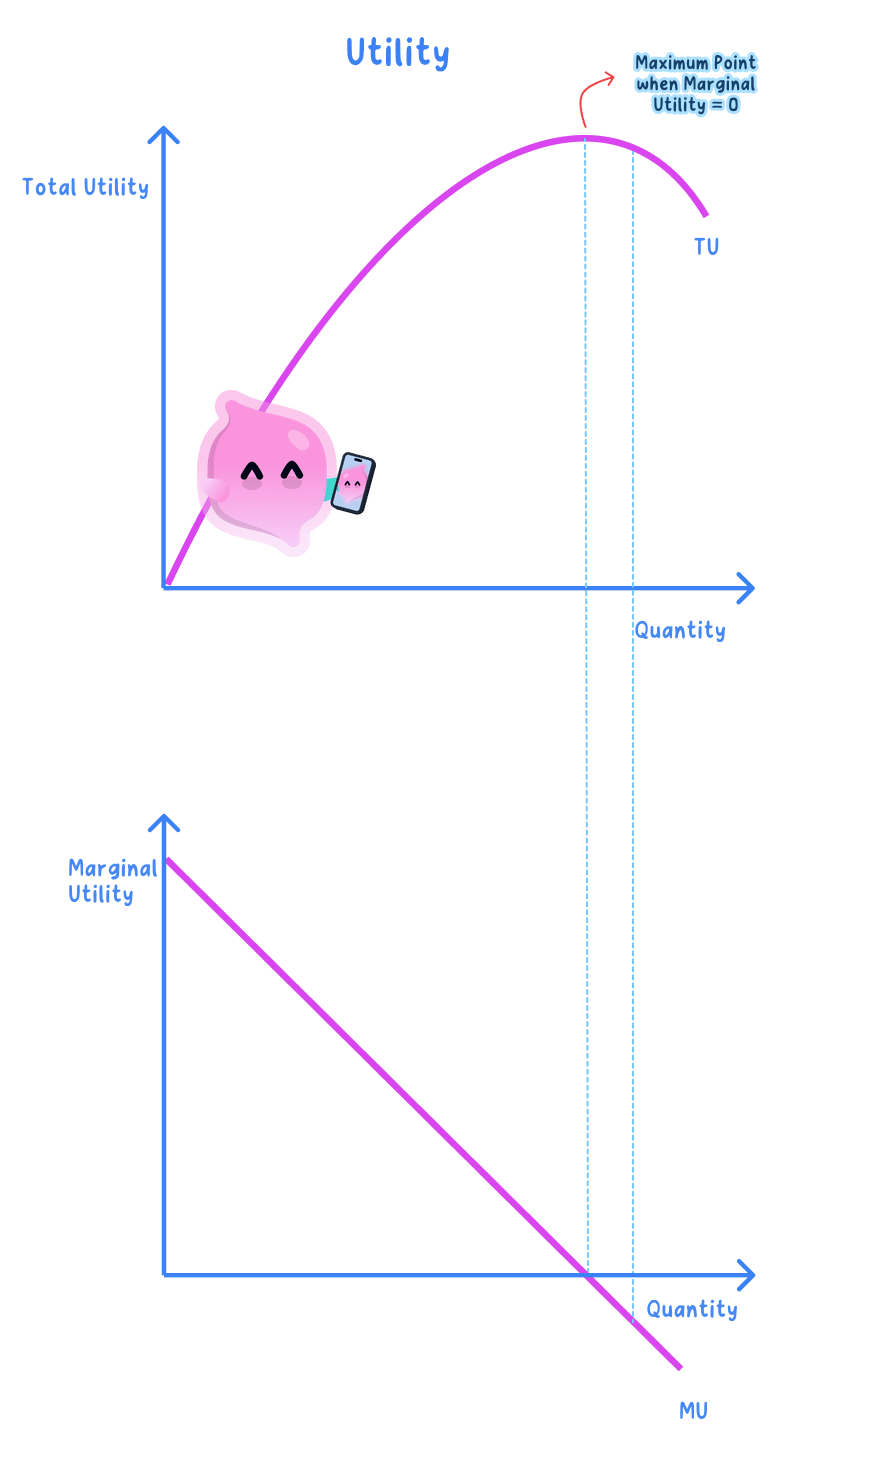
Utility means satisfaction. Marginal utility means the extra satisfaction from consuming one more unit. Often, the more you already have of something, the less extra satisfaction the next unit gives you.
So consumers usually need a lower price to persuade them to buy additional units.
The diagram shows the standard demand curve, plus the key distinction between movements along the curve and shifts of the whole curve.

Rare exceptions
Some goods may not follow the usual law of demand, such as possible Veblen goods where a higher price may make the good more desirable as a status symbol. At A-Level, assume demand slopes downwards unless the question clearly gives a reason not to.
Individual and market demand
Individual demand
Individual demand is the quantity of a good or service that one consumer is willing and able to buy at different prices.
For example, your weekly demand for coffees might be 5 cups at £2 each, but only 2 cups at £4 each.
Market demand
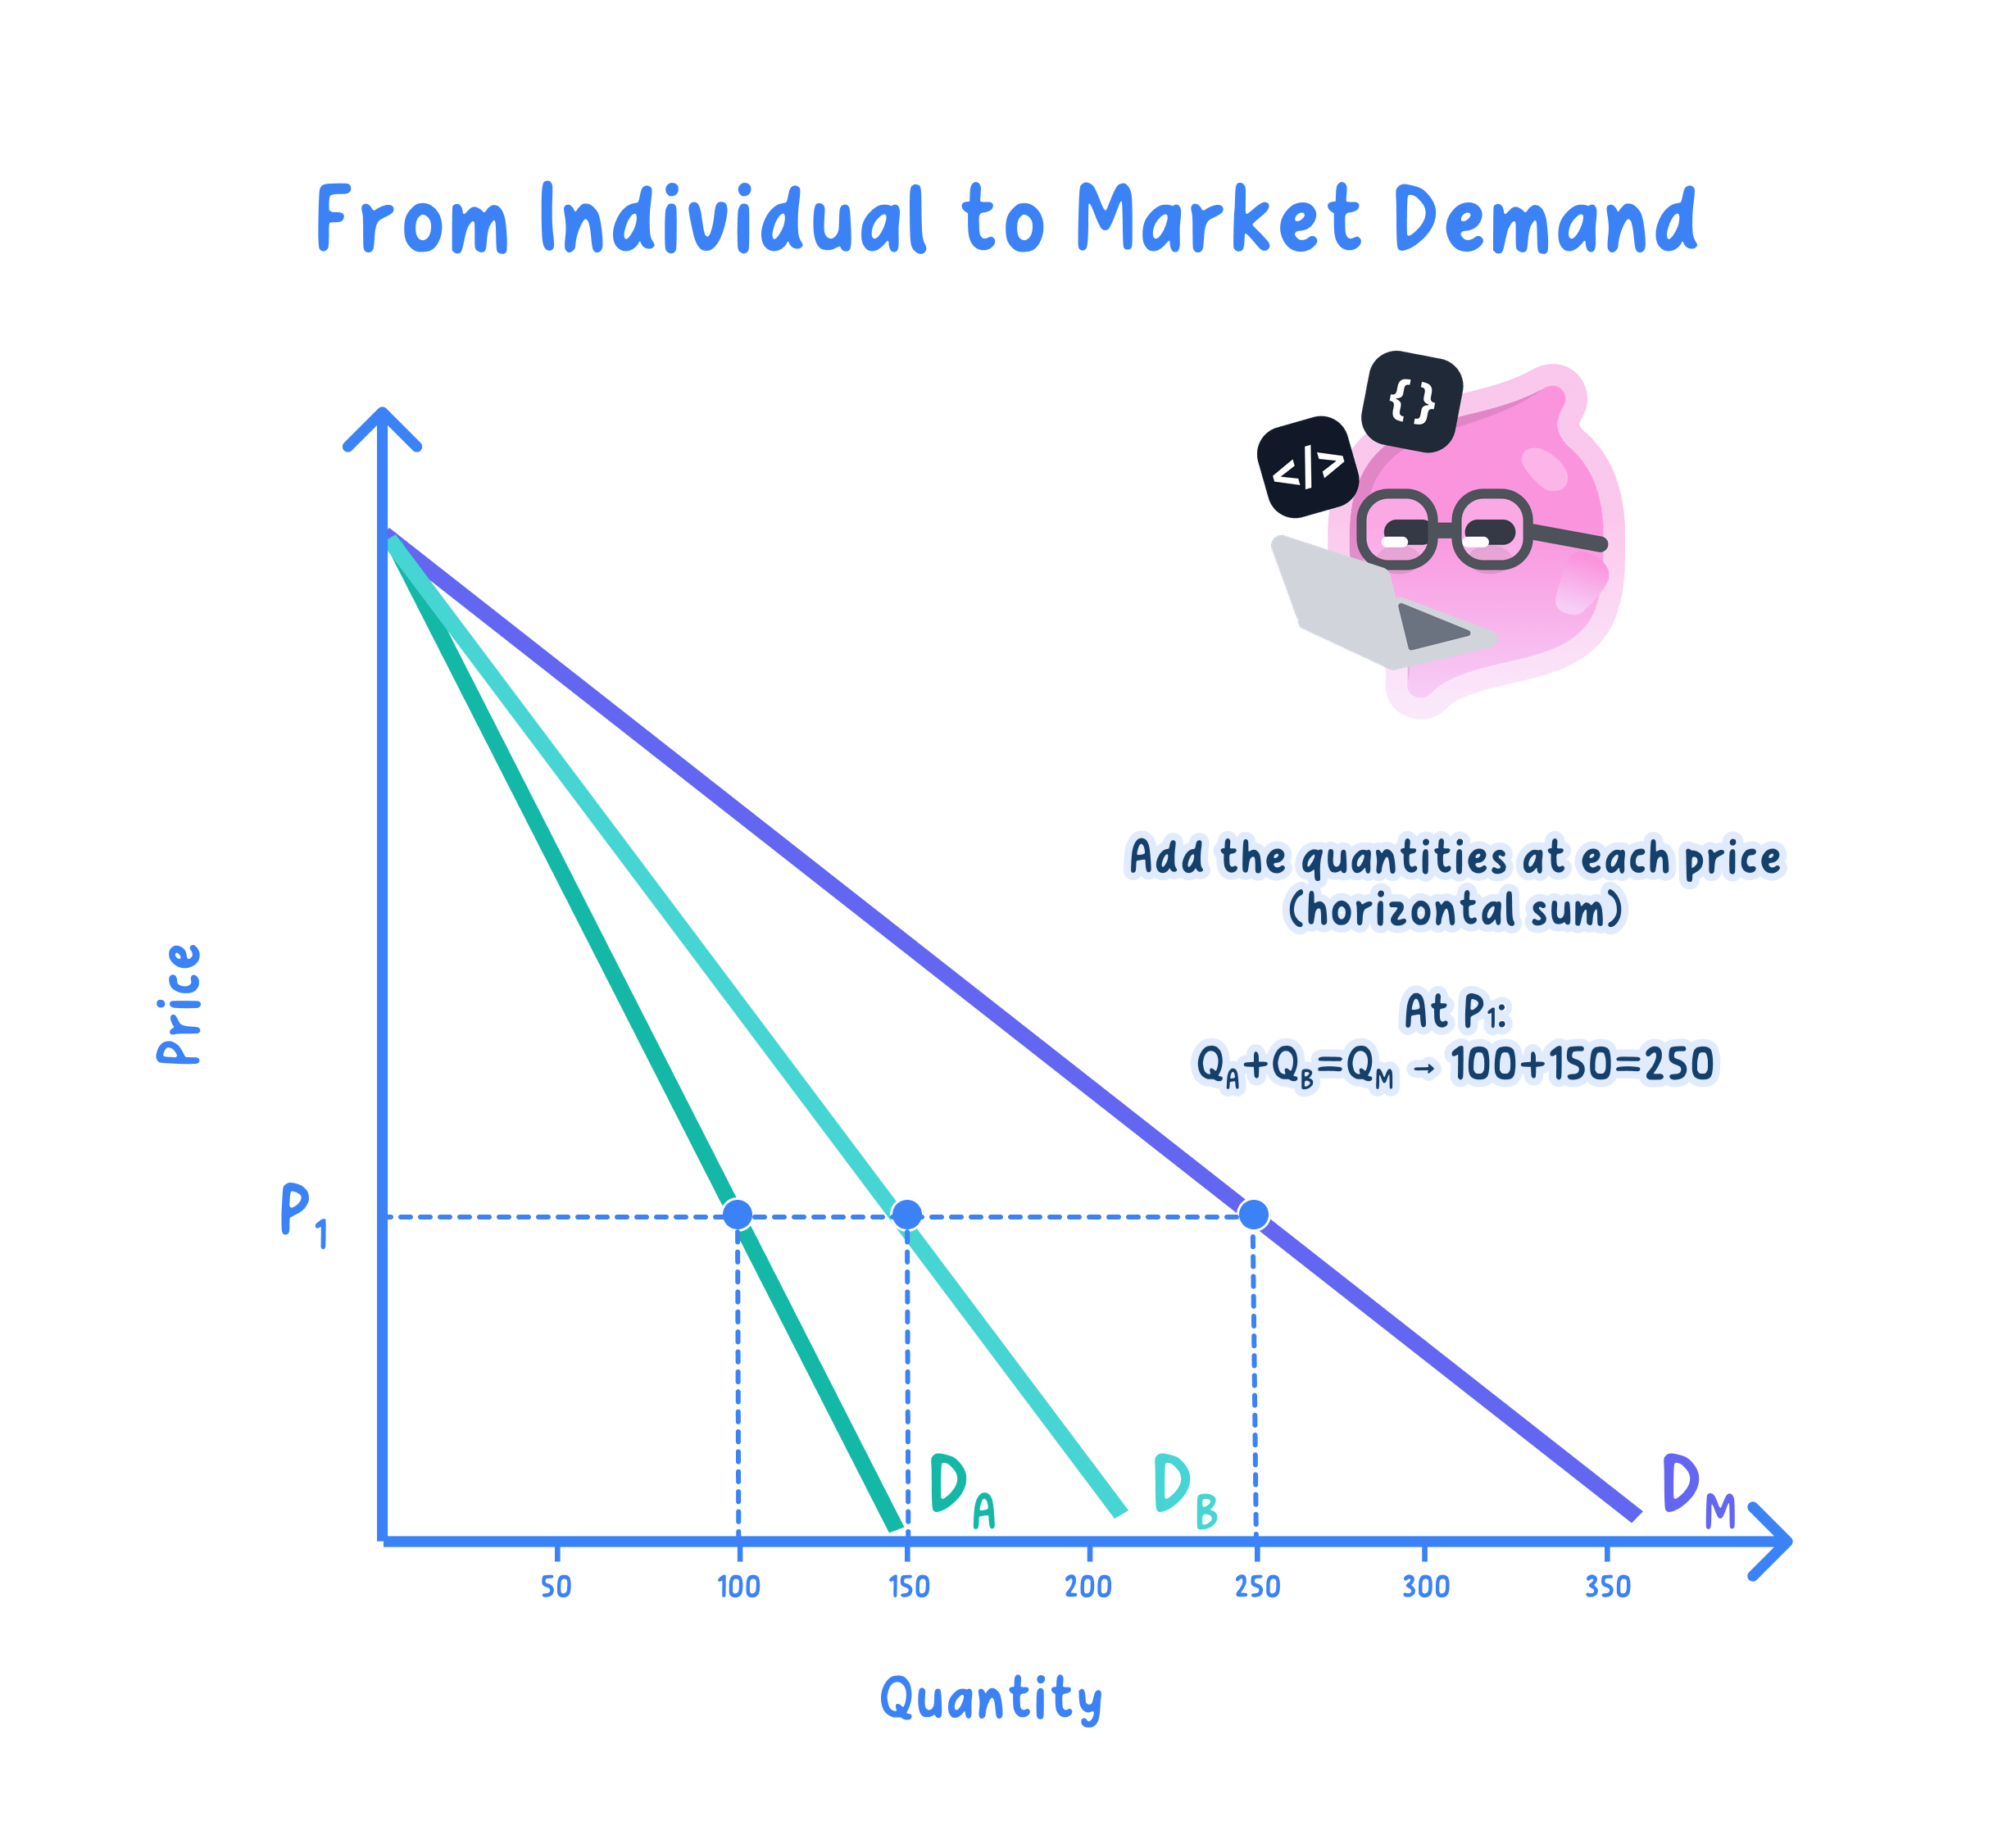
Market demand is the total quantity demanded by all consumers in the market at each price.
Economists find market demand by horizontally summing individual demand curves. This means adding quantities demanded at the same price.

The key relationship is:
Qd,market=Qd,A+Qd,B+Qd,C+⋯Q_{d,\text{market}} = Q_{d,A} + Q_{d,B} + Q_{d,C} + \cdotsQd,market=Qd,A+Qd,B+Qd,C+⋯Adding individual demand
-
At a price of £5 per meal, Consumer A demands 2 meals per week, Consumer B demands 3 meals per week, and Consumer C demands 1 meal per week.
-
Add the quantities demanded at that same price:
Qd,market=2+3+1=6Q_{d,\text{market}} = 2 + 3 + 1 = 6Qd,market=2+3+1=6 meals per week. -
If the price falls to £4 and the three consumers now demand 3, 5 and 2 meals, market quantity demanded becomes 10 meals per week, showing an extension of market demand along the market demand curve.
Adding demand curves vertically
Market demand is found by adding quantities at the same price, not by adding prices at the same quantity.
Joint, competitive and composite demand
Some demand relationships depend on how goods are connected to each other. You need these terms for explaining why the demand curve for one good might shift when something happens in another market.

Joint demand
Joint demand occurs when two or more goods are demanded together. These goods are also called complements.
Examples include:
- Cars and petrol
- Printers and ink cartridges
- Games consoles and video games
If the price of cars falls, quantity demanded for cars may rise. This can increase demand for petrol, shifting the petrol demand curve to the right.
Competitive demand
Competitive demand occurs when goods are substitutes for each other. A substitute is a good that can be used instead of another good.
Examples include:
- Tea and coffee
- Chicken and beef
- Netflix and Disney+
If the price of chicken rises, some consumers may switch to beef. Demand for beef may increase, shifting the beef demand curve to the right.
Composite demand
Composite demand occurs when one good is demanded for several different uses.
Examples include:
- Wheat used for bread, animal feed and biofuel
- Oil used for petrol, plastics and heating
- Milk used for drinking, cheese and yoghurt
If demand for one use rises sharply, it may reduce availability for other uses and push up the price of the shared resource.
Classifying demand relationships
-
Electric cars and charging points are used together, so stronger demand for electric cars is likely to increase demand for charging points. This is joint demand.
-
Butter and margarine can both be used as spreads, so a rise in the price of butter may increase demand for margarine. This is competitive demand.
-
Lithium is used in electric vehicle batteries, phones and grid storage, so rising demand from one use can increase pressure on total lithium demand. This is composite demand.
Movements along the demand curve
A movement along the demand curve happens only when the good’s own price changes.
Movement along the demand curve
A movement along the demand curve is a change in quantity demanded caused by a change in the good’s own price, with all other factors held constant.
There are two types:
Extension of demand
An extension of demand happens when price falls and quantity demanded rises. This is a movement down the demand curve.
Example: if cinema tickets fall from £12 to £8, more people may buy tickets.
Contraction of demand
A contraction of demand happens when price rises and quantity demanded falls. This is a movement up the demand curve.
Example: if a monthly gym membership rises from £25 to £40, fewer people may buy memberships.
Identifying an extension of demand
-
Suppose the price of a train ticket falls from £6 to £4, while income, tastes and the price of petrol stay unchanged.
-
Because the train ticket is now cheaper relative to other travel options, consumers are likely to demand more train journeys.
-
This is an extension of demand: quantity demanded increases because of a fall in the good’s own price, so the movement is down along the same demand curve.
Shifts of the demand curve
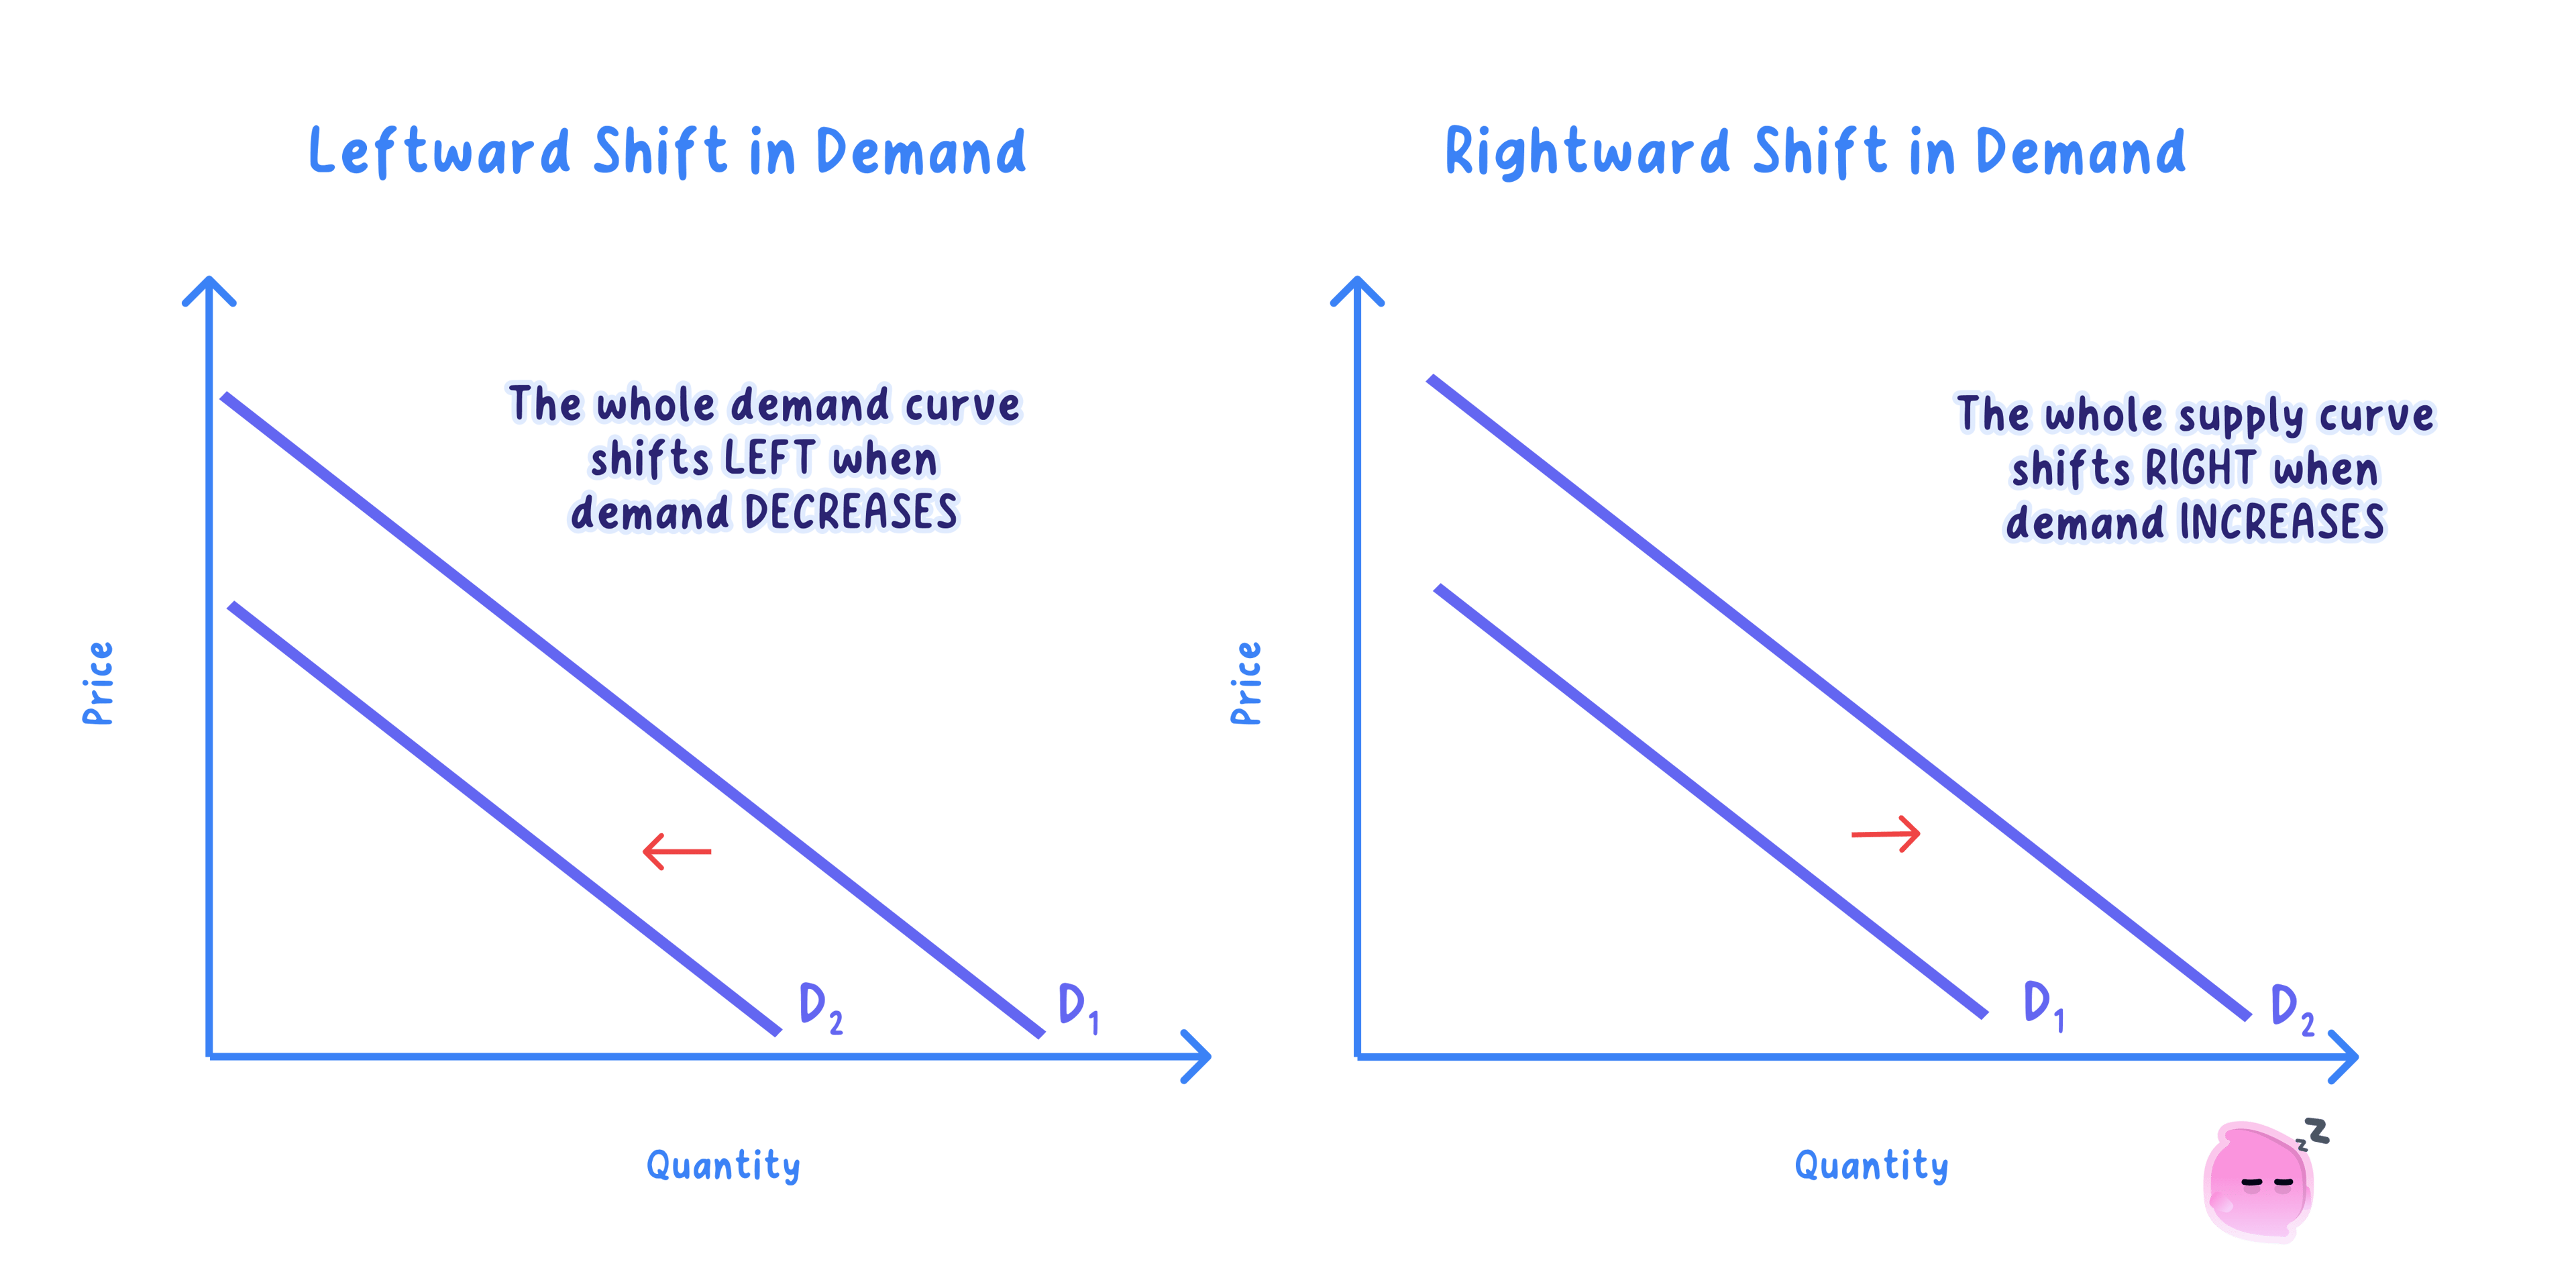
A shift of the demand curve happens when a non-price factor changes demand at every price.
Shift of demand
A shift of demand is a change in the quantity consumers are willing and able to buy at each price, caused by a factor other than the good’s own price.
Increase in demand
An increase in demand means more is demanded at every price. The demand curve shifts to the right.
Possible causes include:
- Higher incomes for a normal good
- Successful advertising
- A rise in the price of a substitute
- A fall in the price of a complement
- Population growth
- Consumer expectations that prices will rise in the future
Decrease in demand
A decrease in demand means less is demanded at every price. The demand curve shifts to the left.
Possible causes include:
- Lower incomes for a normal good
- A fall in popularity or fashion
- A fall in the price of a substitute
- A rise in the price of a complement
- A shrinking target population
- Consumers expecting prices to fall later
A normal good is a good for which demand rises as income rises. An inferior good is a good for which demand falls as income rises, because consumers switch to preferred alternatives.
For example, during the UK cost-of-living squeeze, some households reduced demand for restaurant meals, but increased demand for cheaper supermarket own-brand products.
Analysing a leftward demand shift
-
Suppose real disposable incomes fall because wages rise more slowly than prices, as happened for many UK households during the cost-of-living squeeze.
-
Restaurant meals are likely to be a normal good, so at the same price of £25 per meal, consumers may now demand fewer meals per week.
-
The restaurant meal demand curve shifts left because the cause is lower income, not a rise in the meal’s own price.
Movement or shift?
Ask: did the good’s own price change? If yes, it is a movement along the demand curve. If another factor changed, it is a shift of the whole demand curve.
Demand versus quantity demanded
A fall in price causes an increase in quantity demanded, not an increase in demand. “Demand increases” means the whole demand curve shifts to the right.
Bringing it together
Demand analysis helps you explain consumer behaviour in real markets. For example:
- Higher Bank of England interest rates can reduce demand for houses and cars by making borrowing more expensive.
- A rise in petrol prices can reduce demand for petrol and also reduce demand for petrol-dependent activities.
- Stronger environmental preferences can increase demand for electric vehicles, renewable energy and plant-based food.
In essays, the strongest answers do not just say “demand changes”. They explain the cause, identify whether it is a movement or shift, and then link it to the diagram.
In the exam
-
Define demand using willing and able, a time period, and ceteris paribus.
-
Label diagrams clearly: vertical axis Price (£), horizontal axis Quantity demanded, and a downward-sloping demand curve labelled D.
-
Use precise language: own-price changes cause extensions or contractions; non-price factors cause increases or decreases in demand.
-
For market demand, add quantities demanded at the same price; for joint, competitive and composite demand, explain the relationship between the goods.
Check yourself
- Why does a fall in price cause an extension of demand rather than an increase in demand?
- At £10, Consumer A demands 3 units and Consumer B demands 5 units. What is market demand at £10, and why?
- Give one example each of joint demand, competitive demand and composite demand.