x

Inflation

In your study of macroeconomic policy objectives, price stability is one of the most vital targets for any government. Understanding how price changes are measured and how they ripple through the economy is crucial for your exams. These notes will guide you through the definitions, calculations, causes, and consequences of changes in the price level.


What you'll learn

  • How to define and distinguish between inflation, deflation, disinflation, and hyperinflation.
  • How the UK measures inflation using the Consumer Prices Index (CPI) and Retail Prices Index (RPI).
  • How to calculate rate changes and adjust nominal figures into real terms using index numbers.
  • How to evaluate the causes (demand-pull vs. cost-push) and consequences of both inflation and deflation.

Defining Key Terms

To analyse price stability, we must first be precise with our terminology. The price level refers to the average of current prices across the entire economy.

Definition

Inflation

Inflation is a sustained increase in the general price level in an economy over a given period of time, leading to a fall in the purchasing power of money.

Definition

Deflation

Deflation is a sustained decrease in the general price level in an economy over a given period of time, where the rate of inflation becomes negative (below 0%).

Definition

Disinflation

Disinflation is a fall in the rate of inflation. Prices are still rising, but they are rising at a slower rate than before (for example, the inflation rate falling from 8% to 5%).

Definition

Hyperinflation

Hyperinflation is an extremely rapid, out-of-control period of inflation, typically defined as price increases exceeding 50% per month.

Common Mistake

Confusing Deflation with Disinflation

Many students see an inflation rate drop from 6% to 3% and incorrectly state that "prices are falling". This is disinflation. Prices are still rising; they are simply rising at a slower pace. Prices only fall when the inflation rate drops below 0% (deflation).


The Policy Objective of Low and Stable Inflation

The UK government sets the macroeconomic objective of low and stable inflation. Rather than targeting 0% inflation, the government targets a small, positive rate of inflation.

In the UK, the Chancellor of the Exchequer sets the monetary policy target for inflation, which is currently 2.0% as measured by the Consumer Prices Index (CPI). This target is symmetric, meaning a deviation of more than 1 percentage point in either direction (above 3% or below 1%) requires the Governor of the Bank of England to write an open explanatory letter to the Chancellor.

A low, stable target of 2.0% is chosen because:

  • It provides a "cushion" against the risk of deflation, which can trap an economy in a persistent recession.
  • It allows real wages to adjust downwards without nominal wage cuts, which workers strongly resist (known as "downward nominal wage rigidity").
  • It gives businesses predictability, which encourages long-term planning and investment.

Real vs. Nominal Values

When analysing economic data over time, economists must distinguish between money values at face value and those adjusted for the eroding effects of inflation.

  • Nominal values are economic variables expressed in monetary terms at current prices (not adjusted for inflation).
  • Real values are economic variables adjusted for changes in the price level (adjusted for inflation) to reflect actual purchasing power.

To convert a nominal value to a real value, you use the following formula:

Real Value=Nominal ValuePrice Index×100 \text{Real Value} = \frac{\text{Nominal Value}}{\text{Price Index}} \times 100 Real Value=Price IndexNominal Value​×100

<tip title="The "Real" Formula Hint">

Always remember: Real = Nominal - Inflation (as a percentage approximation). If you receive a 5% nominal wage rise, but inflation is 3%, your real wage (purchasing power) has only increased by approximately 2%.


Measuring Inflation: CPI and RPI

In the UK, the Office for National Statistics (ONS) measures price changes monthly. The two main measures are the Consumer Prices Index (CPI) and the Retail Prices Index (RPI).

How the Indexes are Constructed

  1. The Living Costs and Food Survey: The ONS surveys around 6,000 UK households to find out what they buy. This determines what goes into the representative "basket of goods and services".
  2. The Basket of Goods and Services: This basket contains around 700 items that represent average consumer spending. The basket is updated annually to reflect changing tastes and technology (e.g., adding streaming services and removing CDs).
  3. Weighting: Not all goods are equal. A 10% rise in the price of petrol affects household budgets far more than a 10% rise in the price of postage stamps. Therefore, goods are assigned "weights" based on their share of total household expenditure.
  4. Price Collection: ONS researchers collect over 100,000 price quotes monthly across different locations and online stores to monitor price changes.
  5. Base Year: A base year is chosen and set to an index value of 100. Price movements are then calculated relative to this baseline.

Key Differences Between CPI and RPI

While both track price changes, they differ in coverage and calculation:

FeatureConsumer Prices Index (CPI)Retail Prices Index (RPI)
Housing CostsExcludes most owner-occupier housing costs (like mortgage interest payments and council tax).Includes mortgage interest payments, council tax, and housing depreciation.
Population CoverageCovers a wider population, including institutional households (e.g., care homes) and foreign visitors.Excludes very high earners and pensioner households who rely mainly on state pensions.
Mathematical FormulaUses a geometric mean (which accounts for consumers switching to cheaper alternatives when prices rise).Uses an arithmetic mean (which does not account for consumer substitution, typically making RPI higher than CPI).
Official StatusThe UK government's official target metric (specifically CPIH, which includes owner-occupiers' housing costs).No longer classified as a "National Statistic" due to calculation issues, but still used to calculate payments on index-linked gilts and rail fare increases.

Calculating the Rate of Inflation

To calculate inflation from index numbers, you must calculate the percentage change in the index over a specific period.

Rate of Inflation=Indext−Indext−1Indext−1×100 \text{Rate of Inflation} = \frac{\text{Index}_t - \text{Index}_{t-1}}{\text{Index}_{t-1}} \times 100 Rate of Inflation=Indext−1​Indext​−Indext−1​​×100

Where Indext\text{Index}_tIndext​ is the index value of the current period, and Indext−1\text{Index}_{t-1}Indext−1​ is the index value of the previous period.

Example

Calculating the rate of inflation using index numbers

Suppose the UK CPI index numbers for three consecutive years are as follows:

  • Year 1 (Base Year): 100.0
  • Year 2: 104.2
  • Year 3: 107.5

Task: Calculate the rate of inflation between Year 2 and Year 3.

Step-by-step calculation:

  1. Identify the index values for the start and end of the period. The index at the start of the period (Indext−1\text{Index}_{t-1}Indext−1​) is Year 2 = 104.2. The index at the end of the period (Indext\text{Index}_tIndext​) is Year 3 = 107.5.

  2. Calculate the absolute change in the index.

Change=107.5−104.2=3.3 \text{Change} = 107.5 - 104.2 = 3.3 Change=107.5−104.2=3.3
  1. Divide the change by the starting index and multiply by 100 to find the percentage increase.
Inflation Rate=3.3104.2×100≈3.17% \text{Inflation Rate} = \frac{3.3}{104.2} \times 100 \approx 3.17\% Inflation Rate=104.23.3​×100≈3.17%

Note: Always remember to state the units (%) and round appropriately as directed by the question prompt.


Causes of Inflation

Economists categorise the causes of inflation into demand-side and supply-side pressures.

1. Demand-Pull Inflation

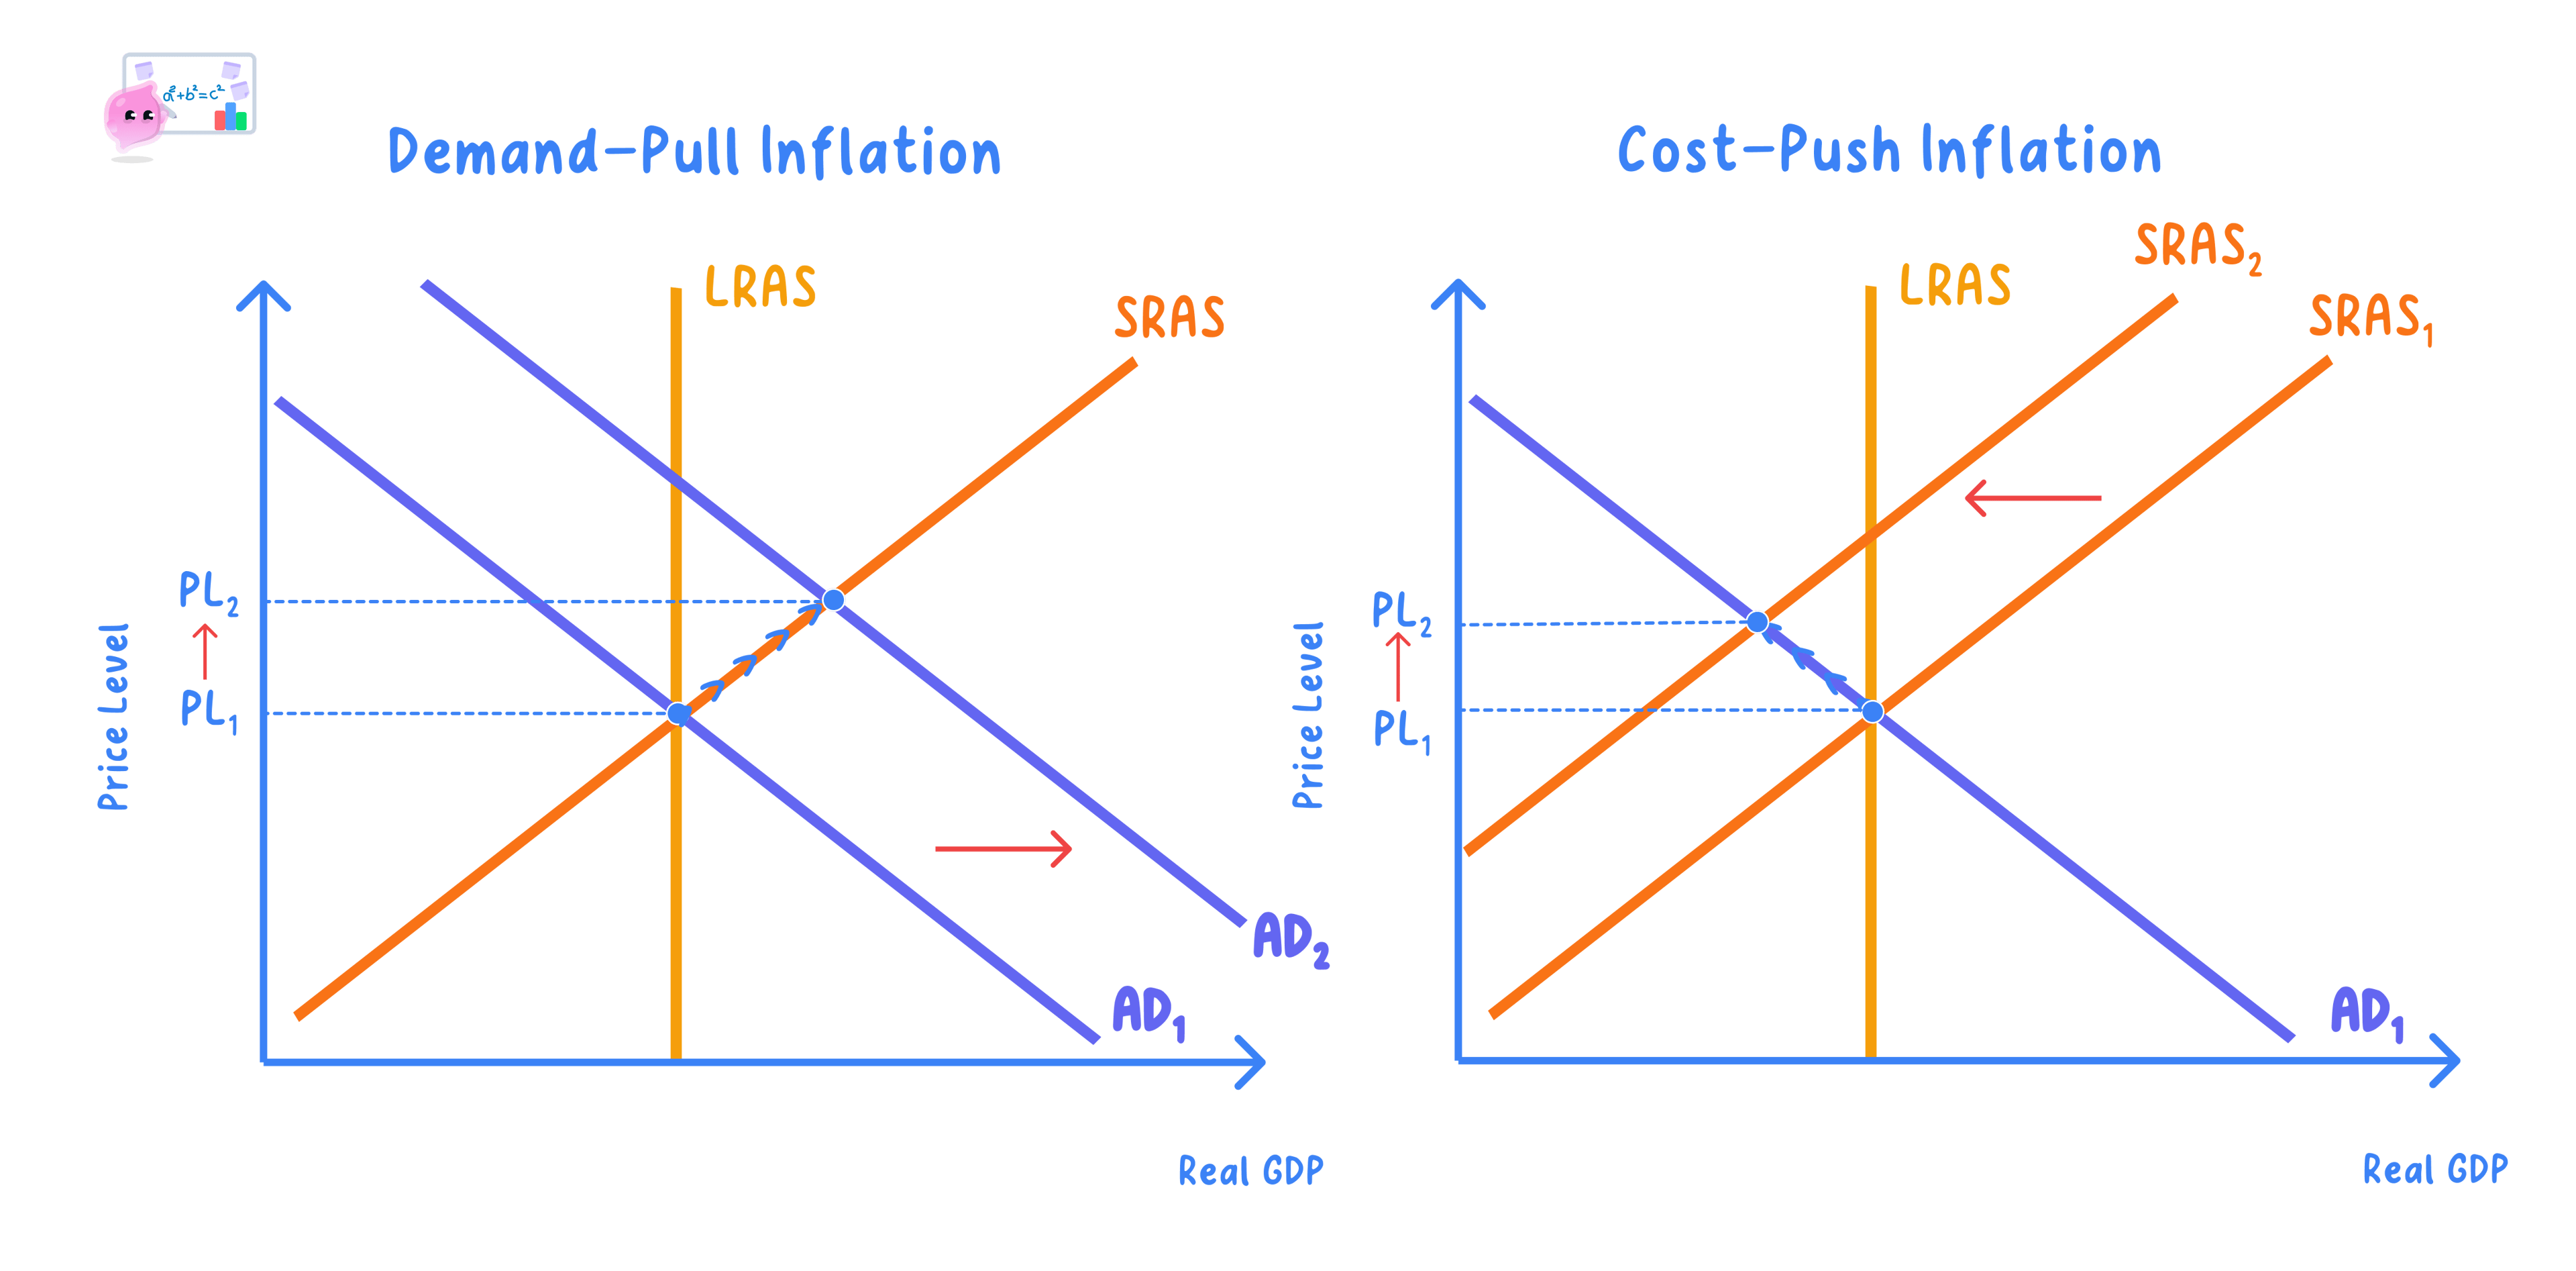
This occurs when Aggregate Demand (AD) grows faster than the productive capacity of the economy (Long-Run Aggregate Supply - LRAS). When there is excess demand in the economy ("too much money chasing too few goods"), firms respond by raising prices to ration resources and increase profit margins.

Key drivers of Demand-Pull Inflation:

  • Lower interest rates (making credit cheaper, boosting consumer spending CCC and investment III).
  • Increased government spending (GGG) or tax cuts.
  • A depreciating exchange rate (making exports cheaper and imports more expensive, boosting net exports X−MX-MX−M).
  • Rising consumer and business confidence.

2. Cost-Push Inflation

This occurs when the costs of production for firms rise, forcing them to increase their prices to preserve profit margins, even if Aggregate Demand remains unchanged. This represents a leftward shift of the Short-Run Aggregate Supply (SRAS) curve.

Key drivers of Cost-Push Inflation:

  • Rising wages (exceeding productivity gains).
  • Rising raw material and commodity prices (e.g., the global energy price shock of 2022 following the Ukraine conflict).
  • An increase in indirect taxes (such as VAT).
  • A depreciating exchange rate (which increases the sterling price of imported raw materials).

Demand-Pull and Cost-Push Inflation


Causes of Deflation

Deflation can also be categorised by its origin, which determines whether it is beneficial or harmful to the economy.

1. "Bad" (Malignant) Deflation — Demand-Side

This is caused by a severe and persistent fall in Aggregate Demand (AD shifting left). It is often associated with high unemployment, low growth, and economic stagnation (e.g., the Great Depression or Japan's "Lost Decades").

2. "Good" (Benign) Deflation — Supply-Side

This is caused by an expansion of aggregate supply (SRAS or LRAS shifting right). It is driven by falling production costs, technological progress, or productivity gains. The price level falls, but real national output increases, and unemployment usually falls.


Consequences of Inflation and Deflation

Evaluating the impact of price instability is a core essay skill. The consequences depend on the rate, stability, and predictability of the price changes.

Consequences of High Inflation

Costs/Negative Impacts:

  • Erosion of Real Income: If nominal wages do not keep pace with inflation, real incomes fall, reducing living standards. This was experienced during the UK "cost-of-living squeeze" in 2022–2023.
  • Redistribution of Wealth: Inflation arbitrarily redistributes wealth from savers (whose real interest rate may become negative) to borrowers (whose real debt burden falls).
  • International Competitiveness: If UK inflation is higher than our trading partners, UK exports become relatively expensive and imports become cheaper, worsening the current account balance.
  • Menu Costs: The administrative costs to firms of constantly changing prices (e.g., reprinting catalogues, updating digital pricing systems).
  • Shoe-Leather Costs: The time and effort consumers spend searching for the best prices in an inflationary environment, wearing out "shoe leather" in the process.
  • Wage-Price Spiral: High inflation leads workers to demand higher nominal wage rises to protect real incomes. Firms cover these higher labour costs by raising prices further, creating an ongoing loop.
  • Fiscal Drag: If tax thresholds are frozen while nominal wages rise with inflation, taxpayers are pushed into higher tax brackets without a real terms raise, increasing the government's tax take.

Potential Benefits:

  • Reduces Real Value of National Debt: High inflation reduces the real value of the government’s accumulated debt burden.
  • Prevents Nominal Wage Rigidities: Small amounts of inflation make it easier for firms to cut real wages without workers actively resisting.

Consequences of Deflation

Costs of Demand-Side Deflation:

  • The Deflationary Spiral: When prices are falling, consumers delay major purchases (such as cars or houses) because they expect them to be cheaper in the future. This reduces Aggregate Demand further, leading to more price cuts, lower output, and higher unemployment.
  • Increasing Real Value of Debt: Unlike inflation, deflation increases the real burden of debt for both households and governments, making it harder to pay off mortgages and national debt.
  • Ineffectiveness of Monetary Policy: Nominal interest rates cannot fall below zero (known as the Zero Lower Bound). If deflation is 3% and nominal rates are 0%, the real interest rate is actually high at 3%, making borrowing expensive and saving highly attractive.

Benefits of Supply-Side Deflation:

  • Consumers enjoy lower prices alongside higher real national output and employment.
  • Improved international price competitiveness, boosting export demand.

Evaluating Price Instability (AO4 Exam Strategy)

When evaluating inflation or deflation in essay questions, consider the following evaluative frameworks:

  • The Cause: Is inflation demand-pull (associated with growth and low unemployment) or cost-push (which can lead to stagflation)? Is deflation supply-side (benign) or demand-side (malignant)?
  • Anticipated vs. Unanticipated: If inflation is anticipated, economic agents can adapt (e.g., indexing wages or contracts). Unanticipated inflation causes massive uncertainty, leading to a collapse in business investment.
  • Rate and Stability: A steady 3% inflation rate is manageable; a highly volatile rate fluctuating between 1% and 9% disrupts economic planning.
  • The Margin of Difference: How does the UK rate compare to our major trading partners (like the US and the Eurozone)? If everyone has high inflation, our international competitiveness might not suffer.

Exam technique

In the exam

  1. Never use the word 'money' when you mean 'real output' or 'income'. Clarify whether you are discussing nominal income or real purchasing power.
  2. Be ready to calculate. Multiple-choice and short-answer questions often ask you to calculate inflation rates using index numbers. Always use the formula: New−OldOld×100\frac{\text{New} - \text{Old}}{\text{Old}} \times 100OldNew−Old​×100.
  3. Use AD/AS diagrams dynamically. In essays about inflation, draw the shift (e.g., SRAS shifting left for cost-push or AD shifting right for demand-pull) and explicitly explain the transition on the graph from the old equilibrium price level (PL1PL_1PL1​) to the new one (PL2PL_2PL2​).
  4. Distinguish clearly between CPI and RPI. Examiners like to test your understanding of why RPI is typically higher than CPI (the formula effect and housing costs).

Self review

Check yourself

  • If the CPI changes from 105.0 to 110.2, what is the rate of inflation?
  • Explain the key difference between how housing costs are treated in the CPI compared to the RPI.
  • Why does demand-side deflation tend to create a self-reinforcing downward spiral in aggregate demand?

Recap questions

Test yourself with 5 quick questions on this guide. Answer them all correctly to complete it.

PreviousNext

How was this guide?

Inflation Revision Guide

  1. A Level
  2. /Economics
  3. /Inflation