The Phillips Curve
What you'll learn
- What the natural rate of unemployment and NAIRU mean.
- How Keynesian and neo-classical views of aggregate supply affect inflation-unemployment trade-offs.
- How to draw and explain the short-run Phillips Curve and long-run Phillips Curve.
- How to evaluate whether the Phillips Curve is useful for macroeconomic policymakers.
The basic policy problem
Governments and central banks try to achieve several macroeconomic policy objectives: low and stable inflation, low unemployment, sustainable economic growth, and a stable balance of payments.
The Phillips Curve focuses on a possible tension between two of these objectives:
- Inflation: a sustained increase in the general price level.
- Unemployment: people of working age who are willing and able to work, actively seeking work, but unable to find a job.
The key question is: can policymakers reduce unemployment by accepting higher inflation?
Historically, A. W. Phillips found an inverse relationship between unemployment and wage inflation in UK data. Later economists adapted this into a relationship between unemployment and price inflation.
Natural rate of unemployment and NAIRU
Before drawing the Phillips Curve, you need two closely related ideas.
Natural rate of unemployment
The natural rate of unemployment is the unemployment rate that exists when the labour market is in long-run equilibrium. It includes frictional unemployment from people moving between jobs and structural unemployment from mismatches of skills, location, or industry. It does not mean zero unemployment.
The natural rate is often written as unu_nun. If unemployment is below this level, the labour market may be very tight: firms compete for scarce workers, wages rise faster, and inflationary pressure builds.
NAIRU
The non-accelerating inflation rate of unemployment is the unemployment rate at which inflation is stable. If actual unemployment is below the NAIRU, inflation tends to accelerate; if actual unemployment is above it, inflation tends to slow.
The natural rate and NAIRU are often treated as similar in A-Level diagrams. The difference is emphasis:
- Natural rate: focuses on labour-market structure.
- NAIRU: focuses on the inflation outcome.
Interpreting an unemployment gap
Suppose UK unemployment is 4.0%, while an economist estimates the NAIRU at 4.8%.
- Calculate the unemployment gap: u−un=4.0%−4.8%=−0.8u - u_n = 4.0\% - 4.8\% = -0.8u−un=4.0%−4.8%=−0.8 percentage points.
- Interpret the sign: actual unemployment is below the estimated NAIRU, so the labour market is likely to be tight.
- Apply the inflation logic: firms may need to raise wages to recruit and retain workers, increasing costs and creating upward pressure on inflation.
NAIRU is not directly observable
The NAIRU is an estimate, not a number printed in the economy. It can change over time with skills, migration, trade frictions, benefit incentives, technology, and labour-market participation.
Aggregate supply: why the theory behind the curve matters
To understand the Phillips Curve, connect it to aggregate demand and aggregate supply.
Aggregate demand (AD) is total planned spending in the economy: consumption, investment, government spending, and net exports. Aggregate supply (AS) is total output firms are willing and able to produce at different price levels. Real GDP means national output adjusted for inflation. Full-employment output is the sustainable level of real GDP when resources are normally and efficiently used.
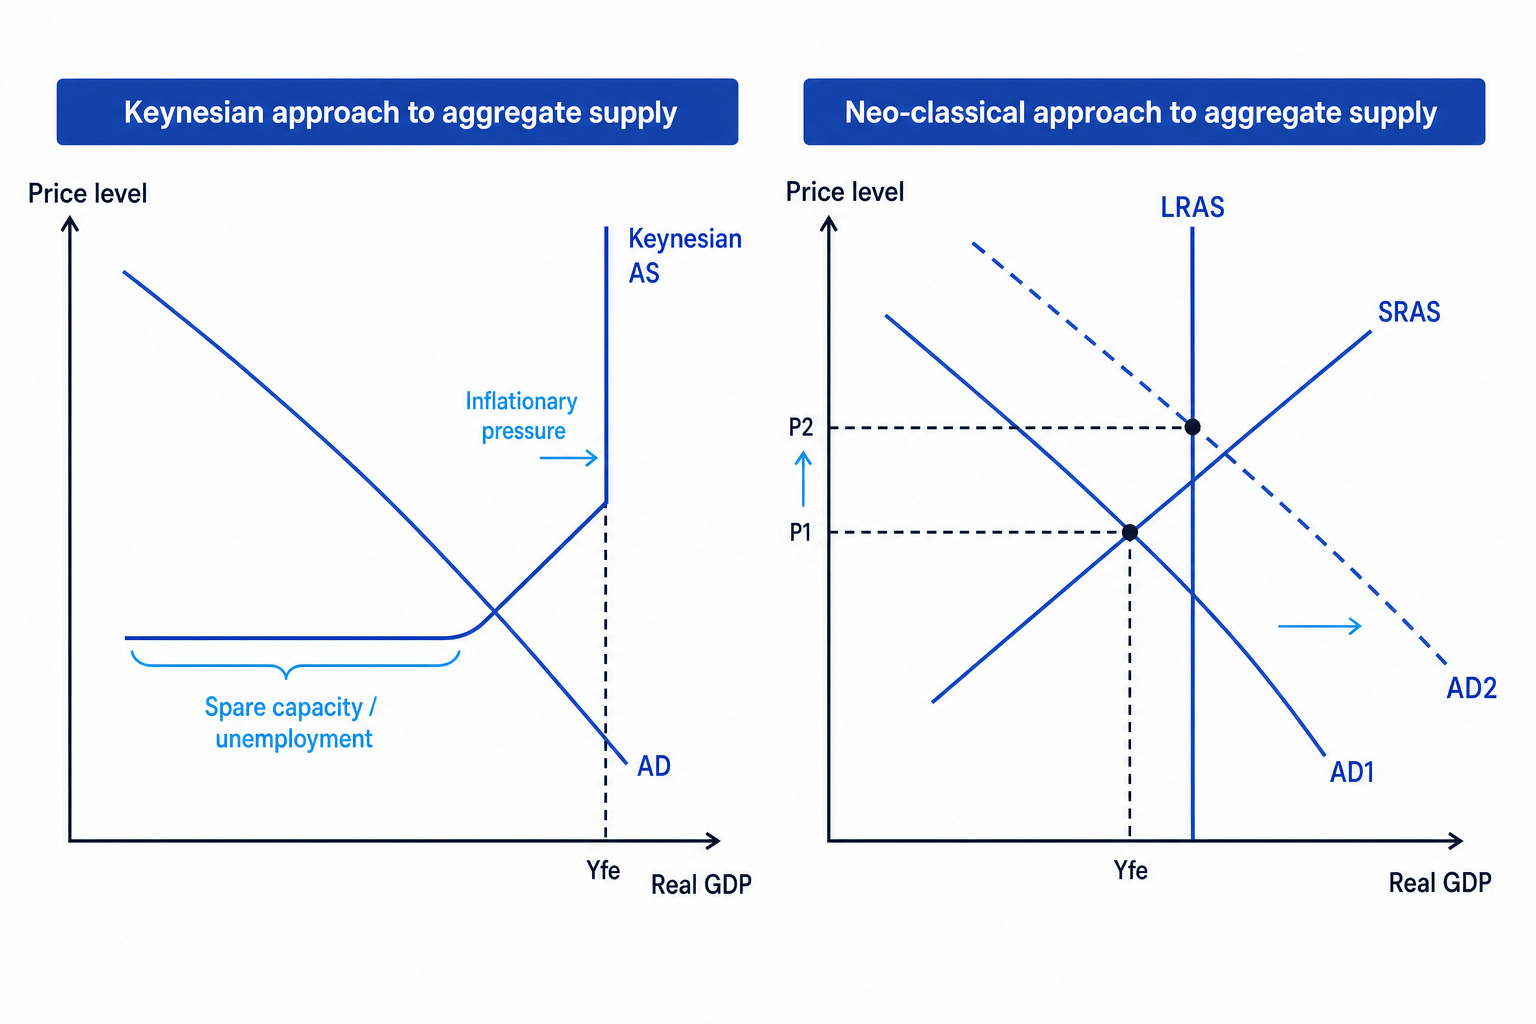
The diagram below contrasts the Keynesian and neo-classical approaches to aggregate supply.
Keynesian aggregate supply
In the Keynesian view, prices and wages may be sticky, especially in the short run. If the economy has spare capacity, an increase in AD can raise real GDP and employment with little immediate inflation.
As the economy gets closer to full capacity, firms struggle to find workers and resources. Output rises less, and prices rise more. At full-employment output, extra AD mainly causes inflation.
Neo-classical aggregate supply
In the neo-classical view, the long-run level of output is determined by supply-side factors such as productivity, labour supply, skills, technology, and incentives.
The long-run aggregate supply curve is vertical at potential output. This means that, in the long run, increasing AD raises the price level but does not permanently increase real GDP.
The AS link
If the economy has spare capacity, lower unemployment may be achieved with limited inflation. If the economy is near full employment, further demand increases are more likely to create inflation than sustainable extra output.
Applying the AS view to a demand boost
Suppose the government increases spending to raise aggregate demand.
- Identify the starting point: if the economy is in a recession with spare capacity, firms can hire unemployed workers and use idle machinery.
- Trace the AD effect: real GDP rises and unemployment falls; inflation may rise only slightly if costs do not increase much.
- Compare this with full employment: if the economy is already near capacity, the same demand boost mainly bids up wages and prices, so inflation rises more than output.
The short-run Phillips Curve
Short-run Phillips Curve
The short-run Phillips Curve shows an inverse relationship between unemployment and inflation in the short run: lower unemployment is associated with higher inflation, and higher unemployment is associated with lower inflation.
This happens because a rise in AD increases output and employment. As unemployment falls, workers gain bargaining power, wages rise, firms’ costs increase, and firms may raise prices. This creates demand-pull inflation, caused by excessive total spending, and possibly wage-driven cost pressure.
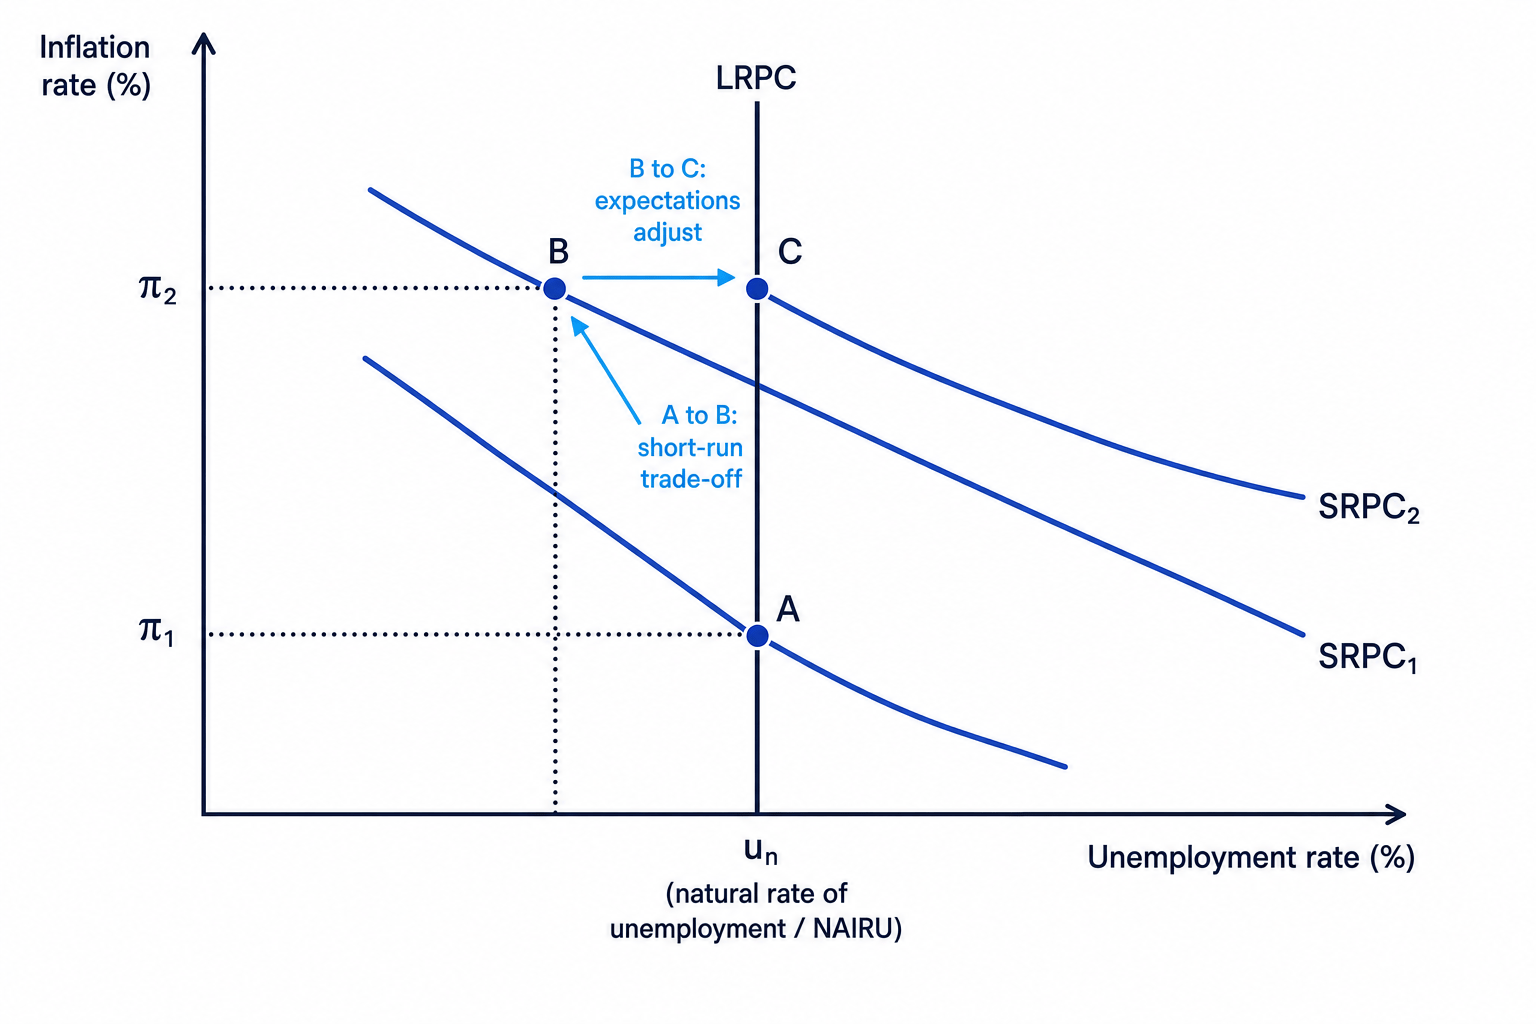
The diagram below shows the short-run trade-off and the long-run adjustment.
A simple expectations-augmented version is:
π=πe−α(u−un)+v\pi = \pi^e - \alpha(u - u_n) + vπ=πe−α(u−un)+vHere, π\piπ is inflation, πe\pi^eπe is expected inflation, uuu is unemployment, unu_nun is the natural rate, α\alphaα shows how strongly inflation responds to unemployment gaps, and vvv represents a supply shock such as an energy price rise.
Movements along the SRPC
A change in aggregate demand causes a movement along the short-run Phillips Curve.
For example, expansionary fiscal policy or looser monetary policy may increase AD. Output rises, unemployment falls, and inflation increases. On the diagram, this is a movement from A to B.
Tracing expansionary demand policy
Suppose the economy begins at the NAIRU and the government cuts income tax to increase consumption.
- Apply the demand effect: higher disposable income increases consumption, raising AD.
- Link AD to labour demand: firms produce more output and hire more workers, so unemployment falls below the NAIRU.
- Link labour-market pressure to inflation: tighter labour markets raise wage pressure and firms pass higher costs into prices, so the economy moves up the SRPC to higher inflation.
Movement versus shift
A change in aggregate demand moves the economy along a short-run Phillips Curve. A change in inflation expectations, supply shocks, productivity, or the estimated NAIRU can shift the Phillips Curve.
The long-run Phillips Curve
The long-run Phillips Curve is vertical at the natural rate of unemployment or NAIRU.
In the long run, workers and firms adjust their expectations. If inflation has risen from π1\pi_1π1 to π2\pi_2π2, workers may demand higher wages to protect real incomes. Firms then face higher costs and set higher prices. The short-run Phillips Curve shifts upward.
This is the Friedman-Phelps argument: there is no permanent trade-off between inflation and unemployment. Policymakers cannot keep unemployment below the natural rate forever simply by accepting higher inflation. Eventually, expectations adjust and unemployment returns to the NAIRU, but inflation is now higher.
Vertical does not mean unemployment never changes
A vertical long-run Phillips Curve means demand-side policy cannot permanently push unemployment below the NAIRU. Supply-side changes can still reduce the NAIRU itself, shifting the long-run Phillips Curve left.
Supply-side policies that could reduce the NAIRU include better training, improved job-search support, childcare provision, infrastructure that improves labour mobility, and policies that raise productivity. However, these may take time, cost money, and risk government failure if poorly designed.
Shifts in the Phillips Curve
The short-run Phillips Curve can shift.
It shifts upward when there is:
- higher expected inflation;
- a negative supply shock, such as a rise in oil or gas prices;
- weaker productivity growth;
- higher import costs due to depreciation of sterling;
- stronger wage bargaining pressure.
It shifts downward when inflation expectations fall, productivity improves, or cost pressures ease.
UK context matters here. During the cost-of-living squeeze, UK CPI inflation peaked at 11.1% in October 2022, partly because of global energy and food price shocks. This was not simply a case of unemployment being “too low”; the SRPC itself shifted upward because costs rose across the economy.
Good evaluation phrase
Say: “The Phillips Curve is most useful when inflation is mainly demand-pull, but less reliable when inflation is caused by supply shocks or imported cost pressures.”
Evaluating the usefulness of the Phillips Curve
Why policymakers may find it useful
The Phillips Curve gives policymakers a clear framework for analysing trade-offs. If unemployment is below the estimated NAIRU and wage growth is strong, the Bank of England may worry that inflationary pressure is becoming embedded.
It also highlights the role of expectations. If households and firms believe inflation will stay high, wage and price setting may adjust upwards, making inflation harder to reduce.
For governments, it supports the idea that demand management may be helpful in a recession but risky near full capacity. This links directly to fiscal policy, monetary policy, and supply-side policy.
Why it may be limited
The relationship is not stable. The 1970s showed stagflation, meaning high inflation and high unemployment at the same time. More recently, pandemic supply-chain disruption and energy shocks raised inflation without a simple fall in unemployment.
Measurement is also difficult. The NAIRU cannot be known with certainty. If policymakers underestimate it, they may overstimulate the economy and create inflation. If they overestimate it, they may tolerate unnecessarily high unemployment.
The curve can also hide distributional issues. A national unemployment rate may look low while particular regions, sectors, or age groups still face serious joblessness or skills mismatch.
Evaluating policy during a supply shock
Suppose inflation is high after an energy price shock, while unemployment is close to the estimated NAIRU.
- Use the Phillips Curve: contractionary monetary policy could reduce AD, raising unemployment and reducing some demand-pull inflation.
- Add the limitation: if inflation is mainly cost-push from energy prices, higher interest rates may reduce inflation only slowly while increasing unemployment and mortgage costs.
- Reach a judgement: the Phillips Curve is useful for spotting overheating, but policymakers should combine it with evidence on wages, vacancies, productivity, exchange rates, and global commodity prices.
Overall judgement
The Phillips Curve is useful as a thinking tool, not as a precise policy menu. It helps explain why reducing unemployment can create inflationary pressure in the short run and why expectations matter in the long run.
However, policymakers should be cautious. The relationship changes when inflation is driven by supply shocks, imported costs, or structural labour-market changes. For OCR essays, the strongest judgement is usually: useful in combination with other indicators, but dangerous if treated as a fixed, exploitable trade-off.
In the exam
- Draw the axes correctly: inflation rate on the vertical axis and unemployment rate on the horizontal axis.
- Distinguish clearly between a movement along the SRPC and a shift of the SRPC.
- Evaluate with time period and cause: demand-pull inflation makes the curve more useful; supply shocks and uncertain NAIRU estimates make it less reliable.
Check yourself
- Why is the NAIRU not the same as zero unemployment?
- What causes the short-run Phillips Curve to shift upward?
- Why does the long-run Phillips Curve become vertical in the Friedman-Phelps view?
