The diagram shows the exchange rate of Japanese Yen (¥) to Euros (€).
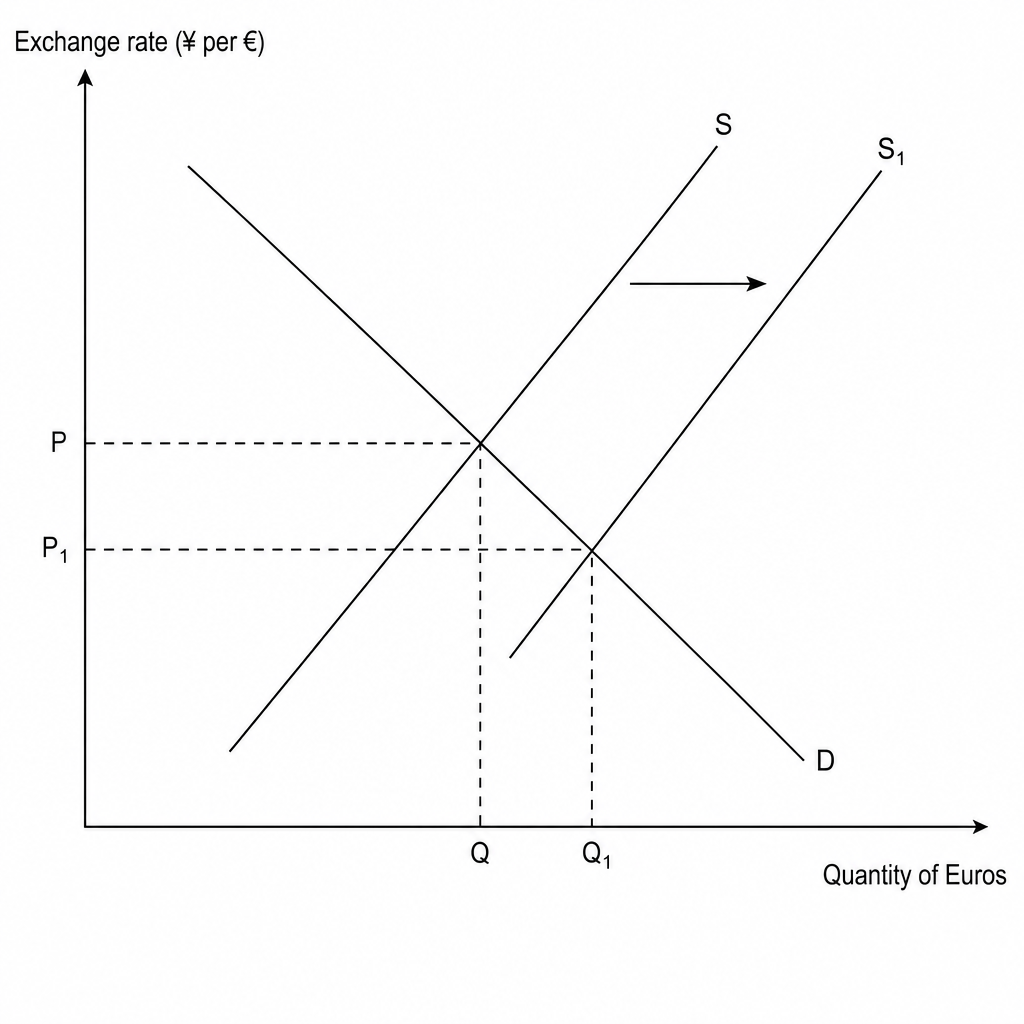
What may have caused the supply curve for Euros to shift from S S\,S to S1S_1S1?
A decrease in exports from the Eurozone
A decrease in imports to the Eurozone
An increase in exports from the Eurozone
An increase in imports to the Eurozone

