Development
What you'll learn
- How an economy can be divided into primary, secondary and tertiary sectors.
- What governments mean by sustainable development as a policy objective.
- Why economic growth can support development — but can also damage sustainability.
- How to evaluate GDP, HDI and wider social/cultural indicators as measures of development.
The big idea: development is more than growth
In everyday language, “development” can sound like “getting richer”. In Economics, it is broader than that.
Economic development
Economic development is an improvement in living standards and quality of life, including income, health, education, freedom, equality, environmental quality and access to basic services.
Economic growth
Economic growth is an increase in real GDP over time. Real GDP means the value of output adjusted for inflation, so it measures changes in output rather than just changes in prices.
Growth can help development, but it is not the same thing. A country might have rising GDP while many people still lack clean water, good healthcare or secure employment. Equally, a country might improve education and health outcomes even if GDP growth is modest.
Growth versus development
Growth is mainly about more output. Development is about better lives. The best exam answers keep this distinction clear.
The structure of an economy
Economists often describe an economy by the sectors where output and employment are concentrated.
Primary, secondary and tertiary sectors
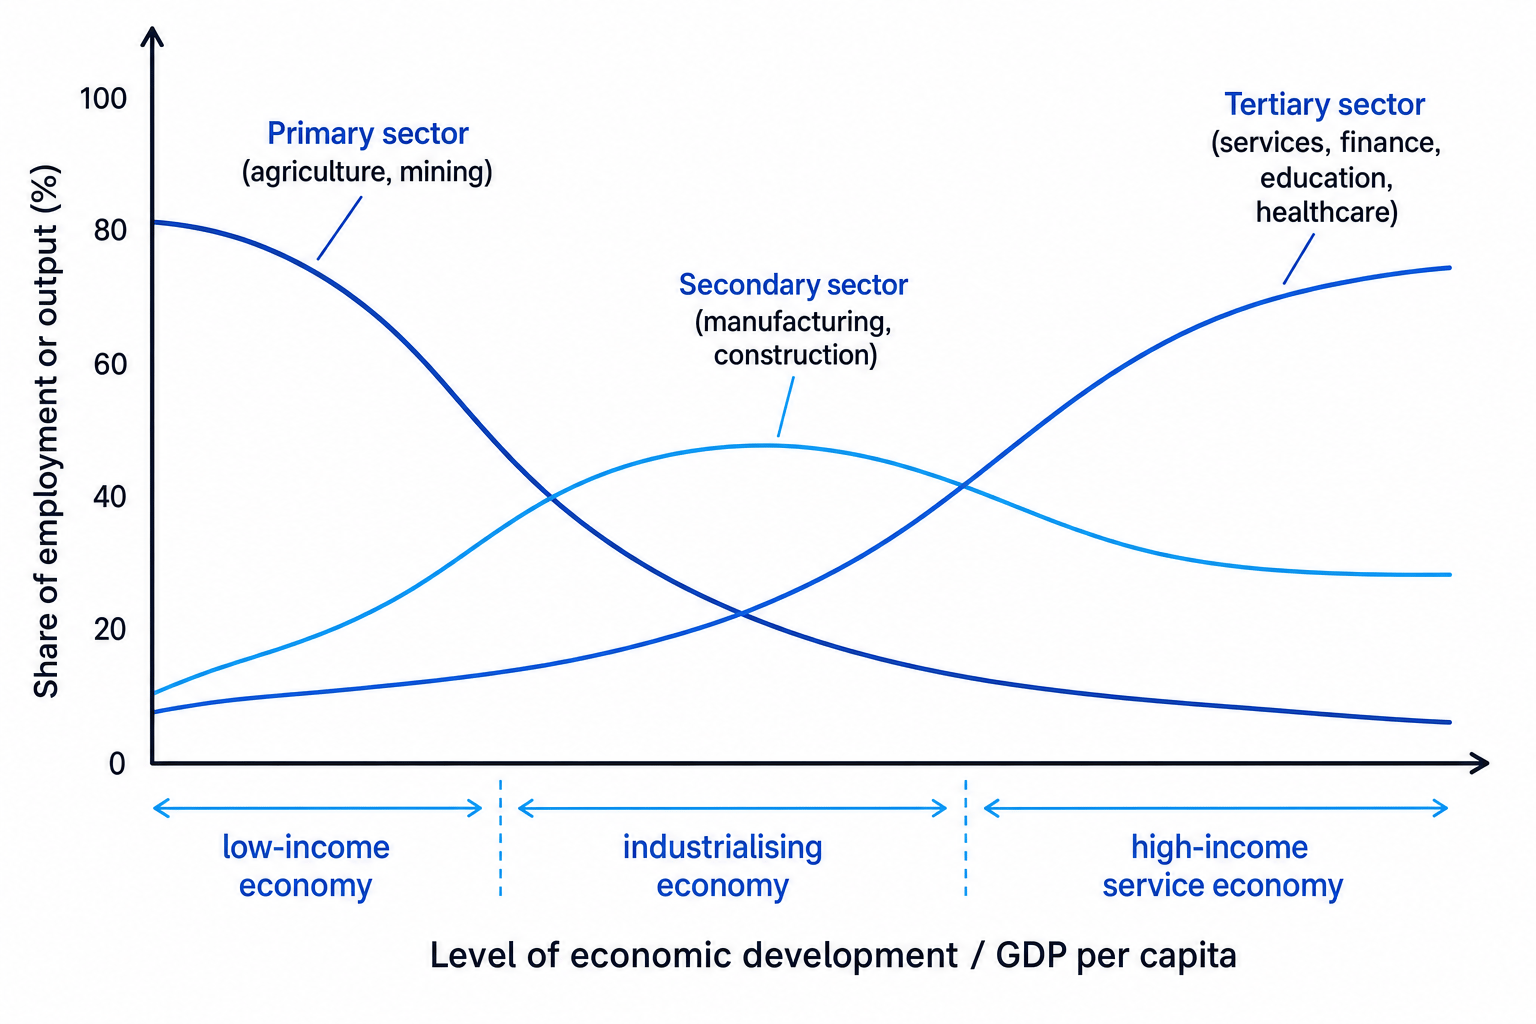
- The primary sector involves extracting or using natural resources, such as farming, fishing, forestry, oil, gas and mining.
- The secondary sector involves manufacturing and construction, such as car production, housebuilding and food processing.
- The tertiary sector involves services, such as retail, banking, healthcare, education, transport, tourism and entertainment.
As countries develop, they often experience structural change: the relative importance of different sectors changes over time. Many low-income economies rely heavily on the primary sector. Industrialising economies usually expand manufacturing. High-income economies tend to have large service sectors.
The diagram shows a common pattern of structural transformation, although real countries do not all follow it neatly.
Why the sector mix matters
The sector structure affects:
- Productivity: manufacturing and high-value services often have higher output per worker than subsistence farming.
- Employment quality: service-sector growth may create high-skilled jobs, but also insecure low-paid work.
- Trade patterns: primary-product exporters may be vulnerable to volatile commodity prices.
- Tax revenue: formal manufacturing and services are usually easier to tax than informal rural activity.
- Sustainability: primary extraction and industrial production can create environmental costs unless regulated.
Interpreting structural change
A country’s employment shares change over 20 years:
- Primary sector: 52% to 22%
- Secondary sector: 18% to 31%
- Tertiary sector: 30% to 47%
-
The fall in primary employment from 52% to 22% suggests fewer workers are relying on agriculture or raw-material extraction, which is typical as productivity improves or workers migrate to towns and cities.
-
The rise in secondary employment from 18% to 31% suggests industrialisation: more workers are employed in manufacturing and construction, which may raise productivity and export capacity.
-
The rise in tertiary employment from 30% to 47% suggests a growing service economy, possibly including retail, finance, education, healthcare and transport.
-
A balanced judgement would be that the economy appears to be developing structurally, but you would need extra evidence on wages, inequality, working conditions and environmental impacts before concluding that living standards have improved.
Confusing sectors with ownership
Primary, secondary and tertiary sectors are about type of economic activity, not whether a firm is privately or publicly owned. A state-owned coal mine is still primary; a private hospital is still tertiary.
Sustainable development as a policy objective
Governments do not only aim for growth, low unemployment and stable inflation. They may also aim for sustainable development.
Sustainable development
Sustainable development means meeting the needs of the present without compromising the ability of future generations to meet their own needs.
This definition is linked to the Brundtland Report and is often summarised as a balance between three aims:
- Economic sustainability: maintaining rising living standards, investment and productivity.
- Social sustainability: reducing poverty, improving health and education, and supporting social cohesion.
- Environmental sustainability: protecting natural resources, biodiversity and climate stability.
Examples of policies aimed at sustainable development include investment in renewable energy, public transport, education, healthcare, clean water, carbon pricing, recycling infrastructure and protection of natural habitats.
The policy objective
Sustainable development is not “no growth”. It is growth and development that can be maintained without creating unacceptable social or environmental costs.
Economic growth and sustainable development
The relationship between economic growth and sustainable development is complex. In essays, you should avoid saying simply “growth is good” or “growth is bad”.
How growth can support sustainable development
Economic growth can increase household incomes, reduce absolute poverty and raise government tax revenue. That extra revenue can fund schools, hospitals, flood defences, renewable energy, public transport and welfare support.
Growth can also finance cleaner technology. For example, higher-income economies may be better able to invest in electric vehicle infrastructure, energy-efficient housing or low-carbon industry. This links to the idea of the Environmental Kuznets Curve, which suggests that environmental damage may rise in early industrialisation but later fall as incomes increase and societies demand cleaner production.
How growth can damage sustainable development
Growth can be unsustainable if it relies on resource depletion, pollution, deforestation or high carbon emissions. Rapid industrialisation can also create urban congestion, poor working conditions and regional inequality.
For example, China’s rapid growth lifted hundreds of millions out of extreme poverty, but it also created major air pollution and carbon-emission challenges. Similarly, fossil-fuel-led growth can raise GDP in the short run while worsening long-run climate risks.
What the relationship depends on
Whether growth supports sustainable development depends on:
- The source of growth: renewable energy and education-led growth are more sustainable than coal extraction.
- Distribution of gains: growth concentrated among the richest may do little for poverty.
- Government regulation: environmental taxes, planning rules and labour laws can reduce negative externalities.
- Time period: short-run GDP gains may hide long-run costs such as climate damage.
- Institutions: corruption or weak property rights may mean growth benefits elites rather than society.
Judging whether growth is sustainable
A government expands roadbuilding and airport capacity. Real GDP grows by 2.8% YoY and unemployment falls, but carbon emissions and air pollution rise.
-
The growth has clear short-run economic benefits: higher output, more construction jobs and possibly improved transport links for firms.
-
The sustainability concern is that higher emissions and pollution create negative externalities, meaning third parties face costs not reflected in market prices.
-
The social impact is mixed: lower unemployment may reduce poverty, but poorer households may suffer more from air pollution if they live near major roads.
-
A supported judgement would be that the policy may promote development if paired with carbon pricing, cleaner public transport and strict environmental standards; without these, it risks raising GDP at the expense of long-run sustainability.
Measuring development
Because development is broad, economists use several indicators rather than one perfect measure.
GDP and GDP per capita
Gross Domestic Product
Gross Domestic Product, or GDP, is the total value of goods and services produced within an economy over a period of time.
GDP is useful because it is widely available, regularly updated and allows comparisons over time. If real GDP is rising, the economy is producing more output. This may suggest more jobs, higher incomes and greater tax revenue.
However, GDP has major limitations as a measure of development.
It does not show how income is distributed. GDP can rise while inequality worsens. It ignores unpaid work, such as childcare and caring for elderly relatives. It may under-record the informal economy, which is especially important in many developing economies. It also does not subtract environmental damage, so pollution-heavy growth may look successful in GDP terms.
GDP per capita improves the measure slightly by dividing output by population:
GDP per capita=real GDPpopulation\text{GDP per capita} = \frac{\text{real GDP}}{\text{population}}GDP per capita=populationreal GDPInterpreting GDP per capita
A country has real GDP of $900 billion and a population of 30 million.
-
Substitute the values into the formula: real GDP is $900 billion and population is 30 million people.
-
Divide total output by population: 900billiondividedby30milliongives900 billion divided by 30 million gives 900billiondividedby30milliongives30,000 per person.
-
Interpret the result carefully: average output per person is 30,000,butthisdoesnotmeaneverypersonearns30,000, but this does not mean every person earns 30,000,butthisdoesnotmeaneverypersonearns30,000.
-
Evaluate the measure: GDP per capita is useful for broad comparisons, but you would still need evidence on inequality, health, education, prices, political freedoms and environmental quality.
Use real GDP for time comparisons
When comparing one country over time, use real GDP or real GDP per capita. Nominal GDP can rise simply because prices have increased.
The Human Development Index
Human Development Index
The Human Development Index, or HDI, is a composite development measure combining income, education and health. It is scored between 0 and 1, where a higher score indicates higher human development.
HDI uses three broad dimensions:
- Health, measured by life expectancy.
- Education, measured using years of schooling.
- Living standards, measured using GNI per capita adjusted for purchasing power.
HDI is useful because it recognises that development is not only about income. A country with moderate income but strong healthcare and education may have a higher HDI than a richer country with poor social outcomes.
However, HDI is still incomplete. It does not directly measure inequality within a country, environmental sustainability, political freedom, gender equality, human rights, crime, corruption or subjective wellbeing. Two countries can have similar HDI scores but very different lived experiences.
Treating HDI as perfect
HDI is broader than GDP, but it is not a full measure of happiness, freedom or sustainability. It is better, not perfect.
Alternative social and cultural indicators
A strong development judgement often uses a dashboard of indicators. Useful alternatives include:
- Gini coefficient: measures income inequality.
- Poverty rates: show the share of people below an income or multidimensional poverty line.
- Infant mortality: deaths of children under one year old per 1,000 live births.
- Literacy rates: show basic educational outcomes.
- Access to clean water, sanitation and electricity: captures basic living standards.
- Gender inequality indicators: show differences in education, income, health or political representation.
- Corruption and rule-of-law measures: indicate institutional quality.
- Life satisfaction surveys: attempt to measure subjective wellbeing.
- Environmental indicators: include carbon emissions per capita, air quality, deforestation and biodiversity loss.
- Cultural and social indicators: may include social trust, community participation, crime rates, political freedoms and respect for minority rights.
The economist Amartya Sen argued that development should be understood in terms of people’s capabilities: what people are actually able to do and be. This supports using broader indicators rather than relying only on GDP.
Evaluating these indicators
Alternative indicators can reveal what GDP hides. For example, a country with high GDP per capita but high inequality, weak rights and severe pollution may be less developed than income data suggests.
But these indicators can be harder to compare internationally. Cultural values differ, survey data may be unreliable, and some measures are subjective. Governments may also manipulate statistics, especially where institutions are weak.
Best measurement judgement
No single indicator is enough. GDP is useful for output, HDI is useful for basic human outcomes, and wider indicators are needed for inequality, sustainability, freedom and social wellbeing.
Overall evaluation: what should you argue?
For OCR essays, a strong answer usually reaches a conditional judgement.
Economic growth is often necessary for development, especially in low-income economies where extra income can fund basic needs. But growth is not sufficient. If growth is unequal, environmentally damaging or based on weak institutions, it may fail to produce sustainable development.
Similarly, GDP is useful but narrow. HDI is broader but still incomplete. The most convincing judgement is that development should be assessed using several measures together, chosen for the context of the country being discussed.
In the exam
-
Start by separating growth from development: growth is real GDP; development is wider living standards and quality of life.
-
When evaluating sustainability, compare short-run benefits with long-run costs, especially environmental damage, inequality and resource depletion.
-
For measurement questions, do not just list indicators. Explain what each measure captures, what it misses, and why a combined approach gives the best judgement.
Check yourself
- Why might a country with high GDP per capita still have low development?
- How does structural change usually alter the primary, secondary and tertiary sectors?
- In what circumstances can economic growth support sustainable development?
