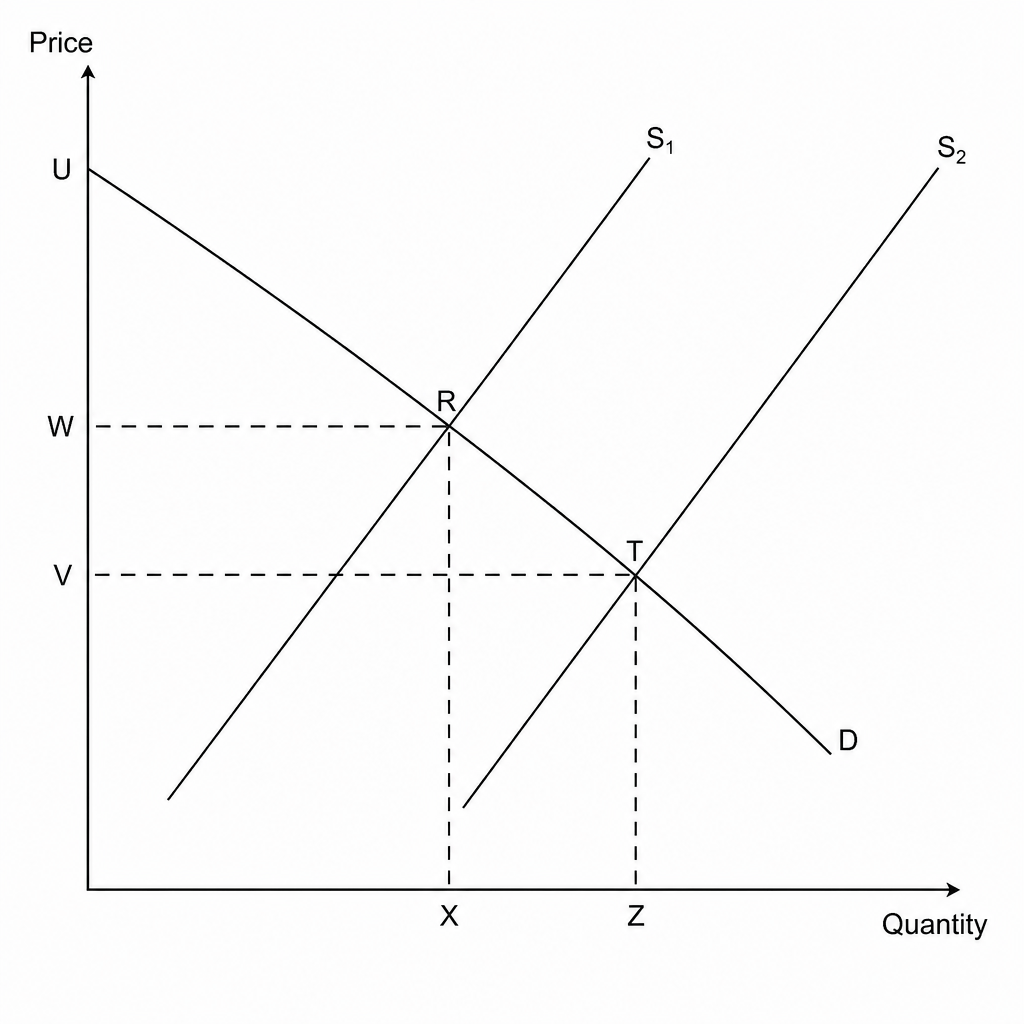
In the diagram below, supply increases from S1 S_1\,S1 to S2S_2S2. Which area represents the increase in consumer surplus?
UWRUWRUWR
UVTUVTUVT
WVTRWVTRWVTR
XRTZXRTZXRTZ