1.2.3a Concepts and calculation of elasticities of demand
Elasticities of Demand
Elasticity of demand: a measure of how responsive quantity demanded is to a change in one of its determinants, calculated as a ratio of percentage changes.
- Each elasticity is the percentage change in quantity demanded divided by the percentage change in its cause.
- Always keep the sign of the coefficient, because for YED and XED the sign carries the economic meaning interpreted in 1.2.3b.
Price Elasticity (PED)
Price elasticity of demand (PED): the responsiveness of quantity demanded to a change in the good's own price.
- A 10% rise in the price of petrol cuts quantity demanded by 4%.
- The negative sign reflects the inverse law of demand, and a value below 1 in size means demand is price inelastic, as petrol tends to be; unusually, a Veblen good such as a Birkin bag can give a positive PED.
Income Elasticity (YED)
Income elasticity of demand (YED): the responsiveness of quantity demanded to a change in real income.
- A rise in real income of 5% raises demand for foreign holidays by 10%.
- The positive sign shows a normal good, and a value above 1 shows it is income elastic, a luxury such as foreign holidays.
Cross Elasticity (XED)
Cross elasticity of demand (XED): the responsiveness of quantity demanded for one good to a change in the price of another good.
- A 20% rise in the price of Pepsi raises demand for Coca-Cola by 10%.
- The positive sign shows the two goods are substitutes, like Coca-Cola and Pepsi; a negative value, as for a printer and its toner, would show complements.
- State the correct formula before substituting any numbers.
- Show the two percentage changes clearly before dividing.
- Keep the sign of every coefficient, since it is part of the answer.
- Do not invert a formula; each measure is the percentage change in quantity demanded over the percentage change in its cause.
- Do not drop the negative sign on PED, which shows the inverse relationship between price and quantity demanded.
- What does each of PED, YED and XED measure?
- State the formula for PED, YED and XED.
- Calculate PED if a 10% price rise cuts quantity demanded by 4%.
- Calculate XED if a 20% rise in the price of good B raises demand for good A by 10%.
1.2.3b Interpreting values and influencing factors
Interpreting PED
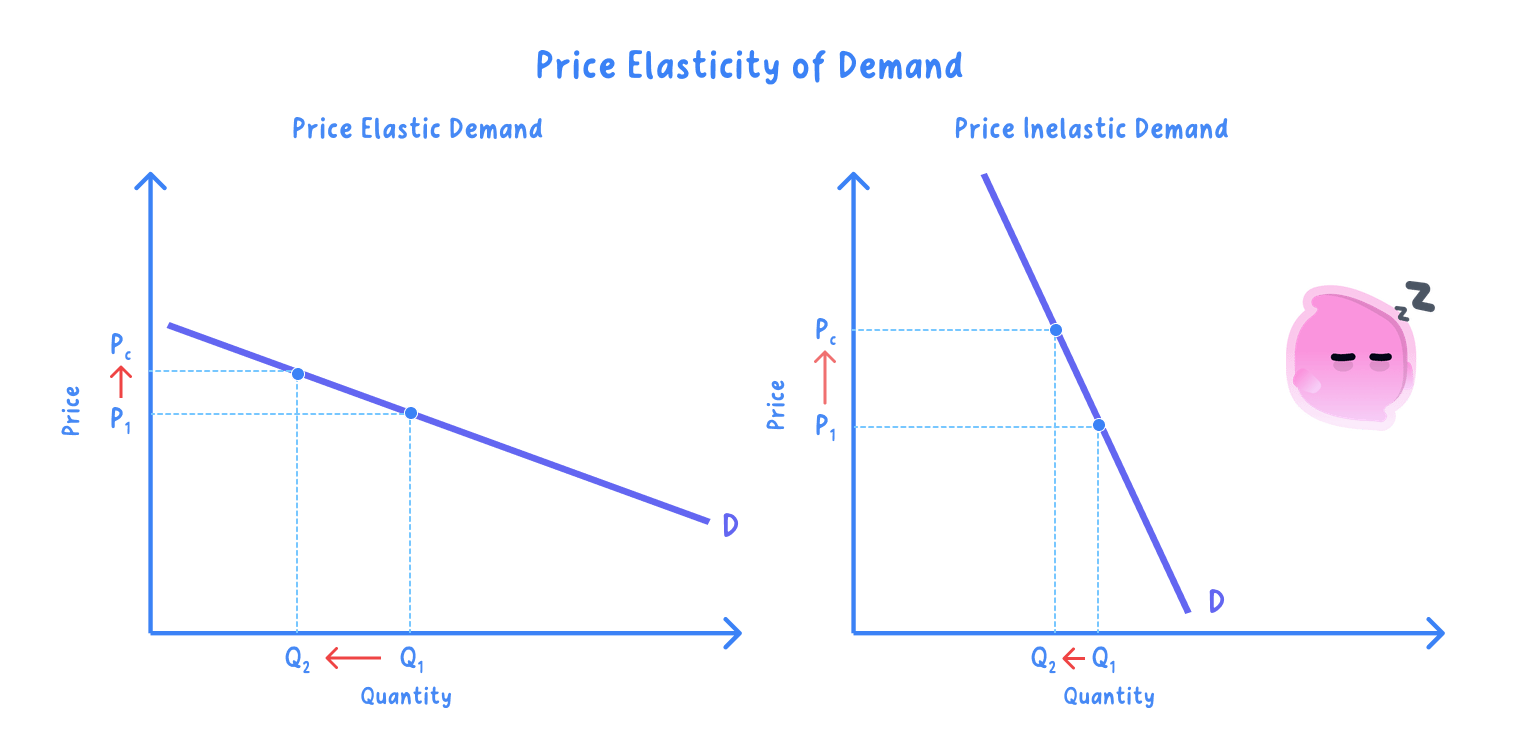
Relatively inelastic: PED between 0 and 1 in size, so quantity changes less than proportionately to price.
Unitary elastic: PED of exactly 1, so quantity changes in exact proportion to price.
Relatively elastic: PED greater than 1 in size, so quantity changes more than proportionately to price.
- The size of the coefficient, ignoring the sign, shows how responsive quantity demanded is to price.
- At the extreme, perfectly inelastic demand has a PED of 0 and is drawn as a vertical demand curve.
- At the other extreme, perfectly elastic demand has an infinite PED and is drawn as a horizontal line at one price.
Interpreting YED
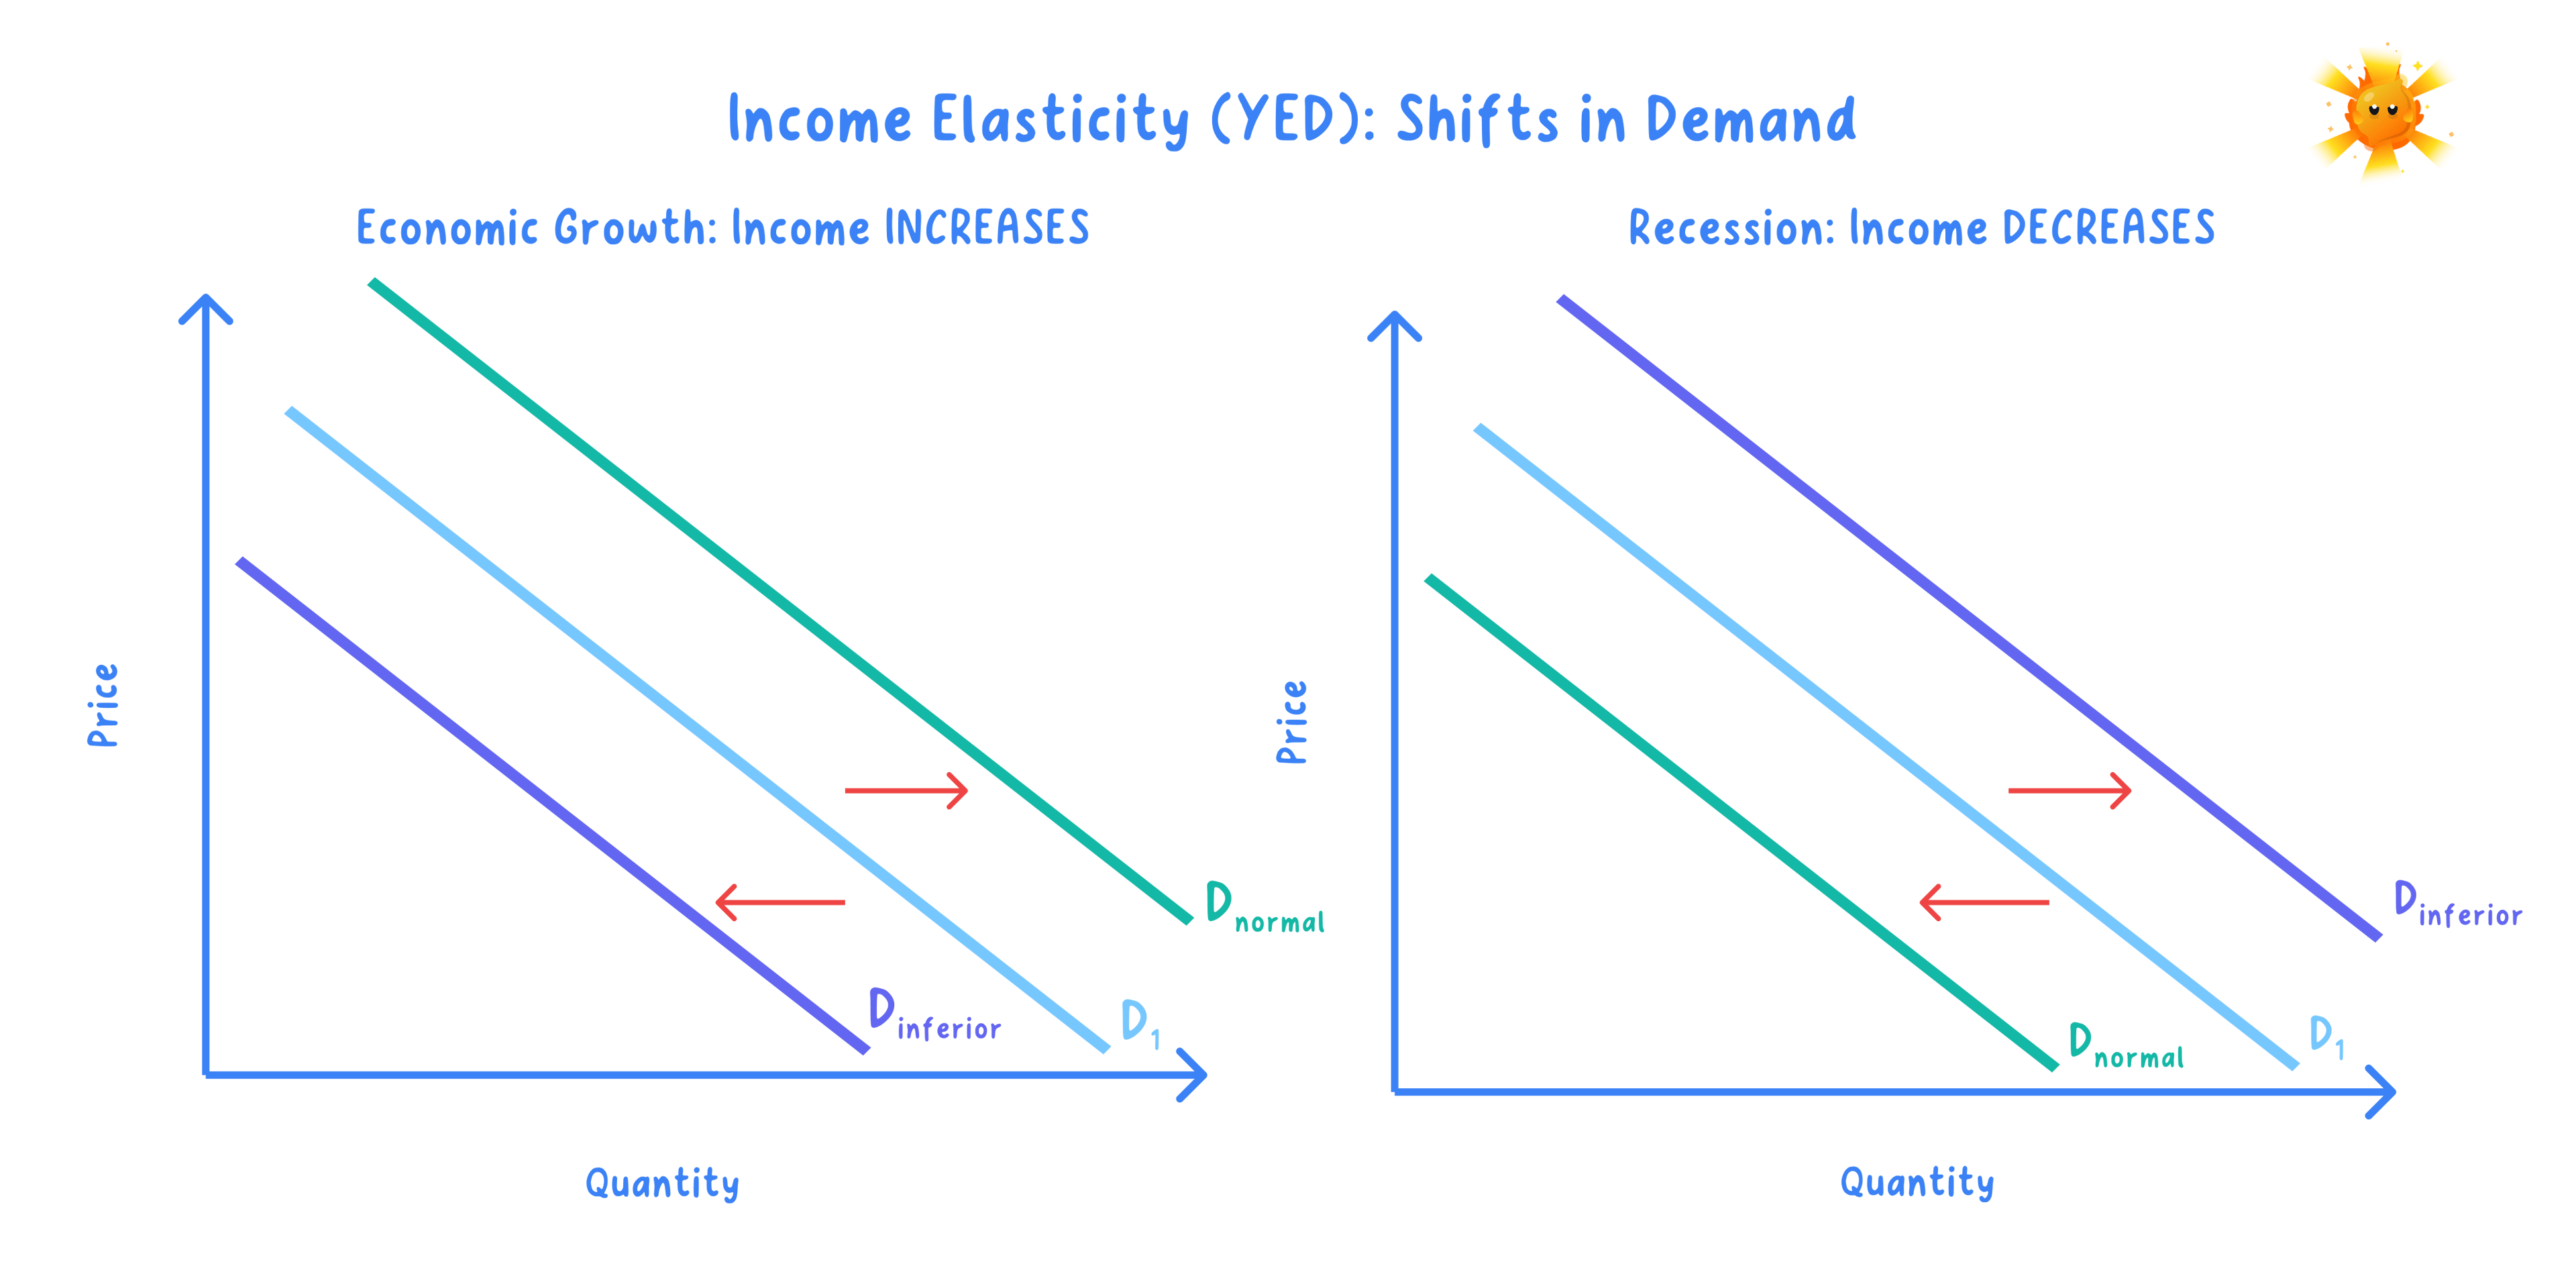
Normal good: positive YED, so demand rises as real income rises.
Inferior good: negative YED, so demand falls as real income rises, whatever the good's quality.
Luxury: a normal good with YED above 1, so demand is income elastic.
Necessity: a normal good with YED between 0 and 1, so demand is income inelastic.
- Read the sign first for the type of good, then read the size for how strongly demand responds to income.
- Restaurant meals with a YED of +2 are a normal luxury, since demand rises fast as income grows.
- An own-brand staple with a YED of −0.5 is inferior, since demand falls as income rises.
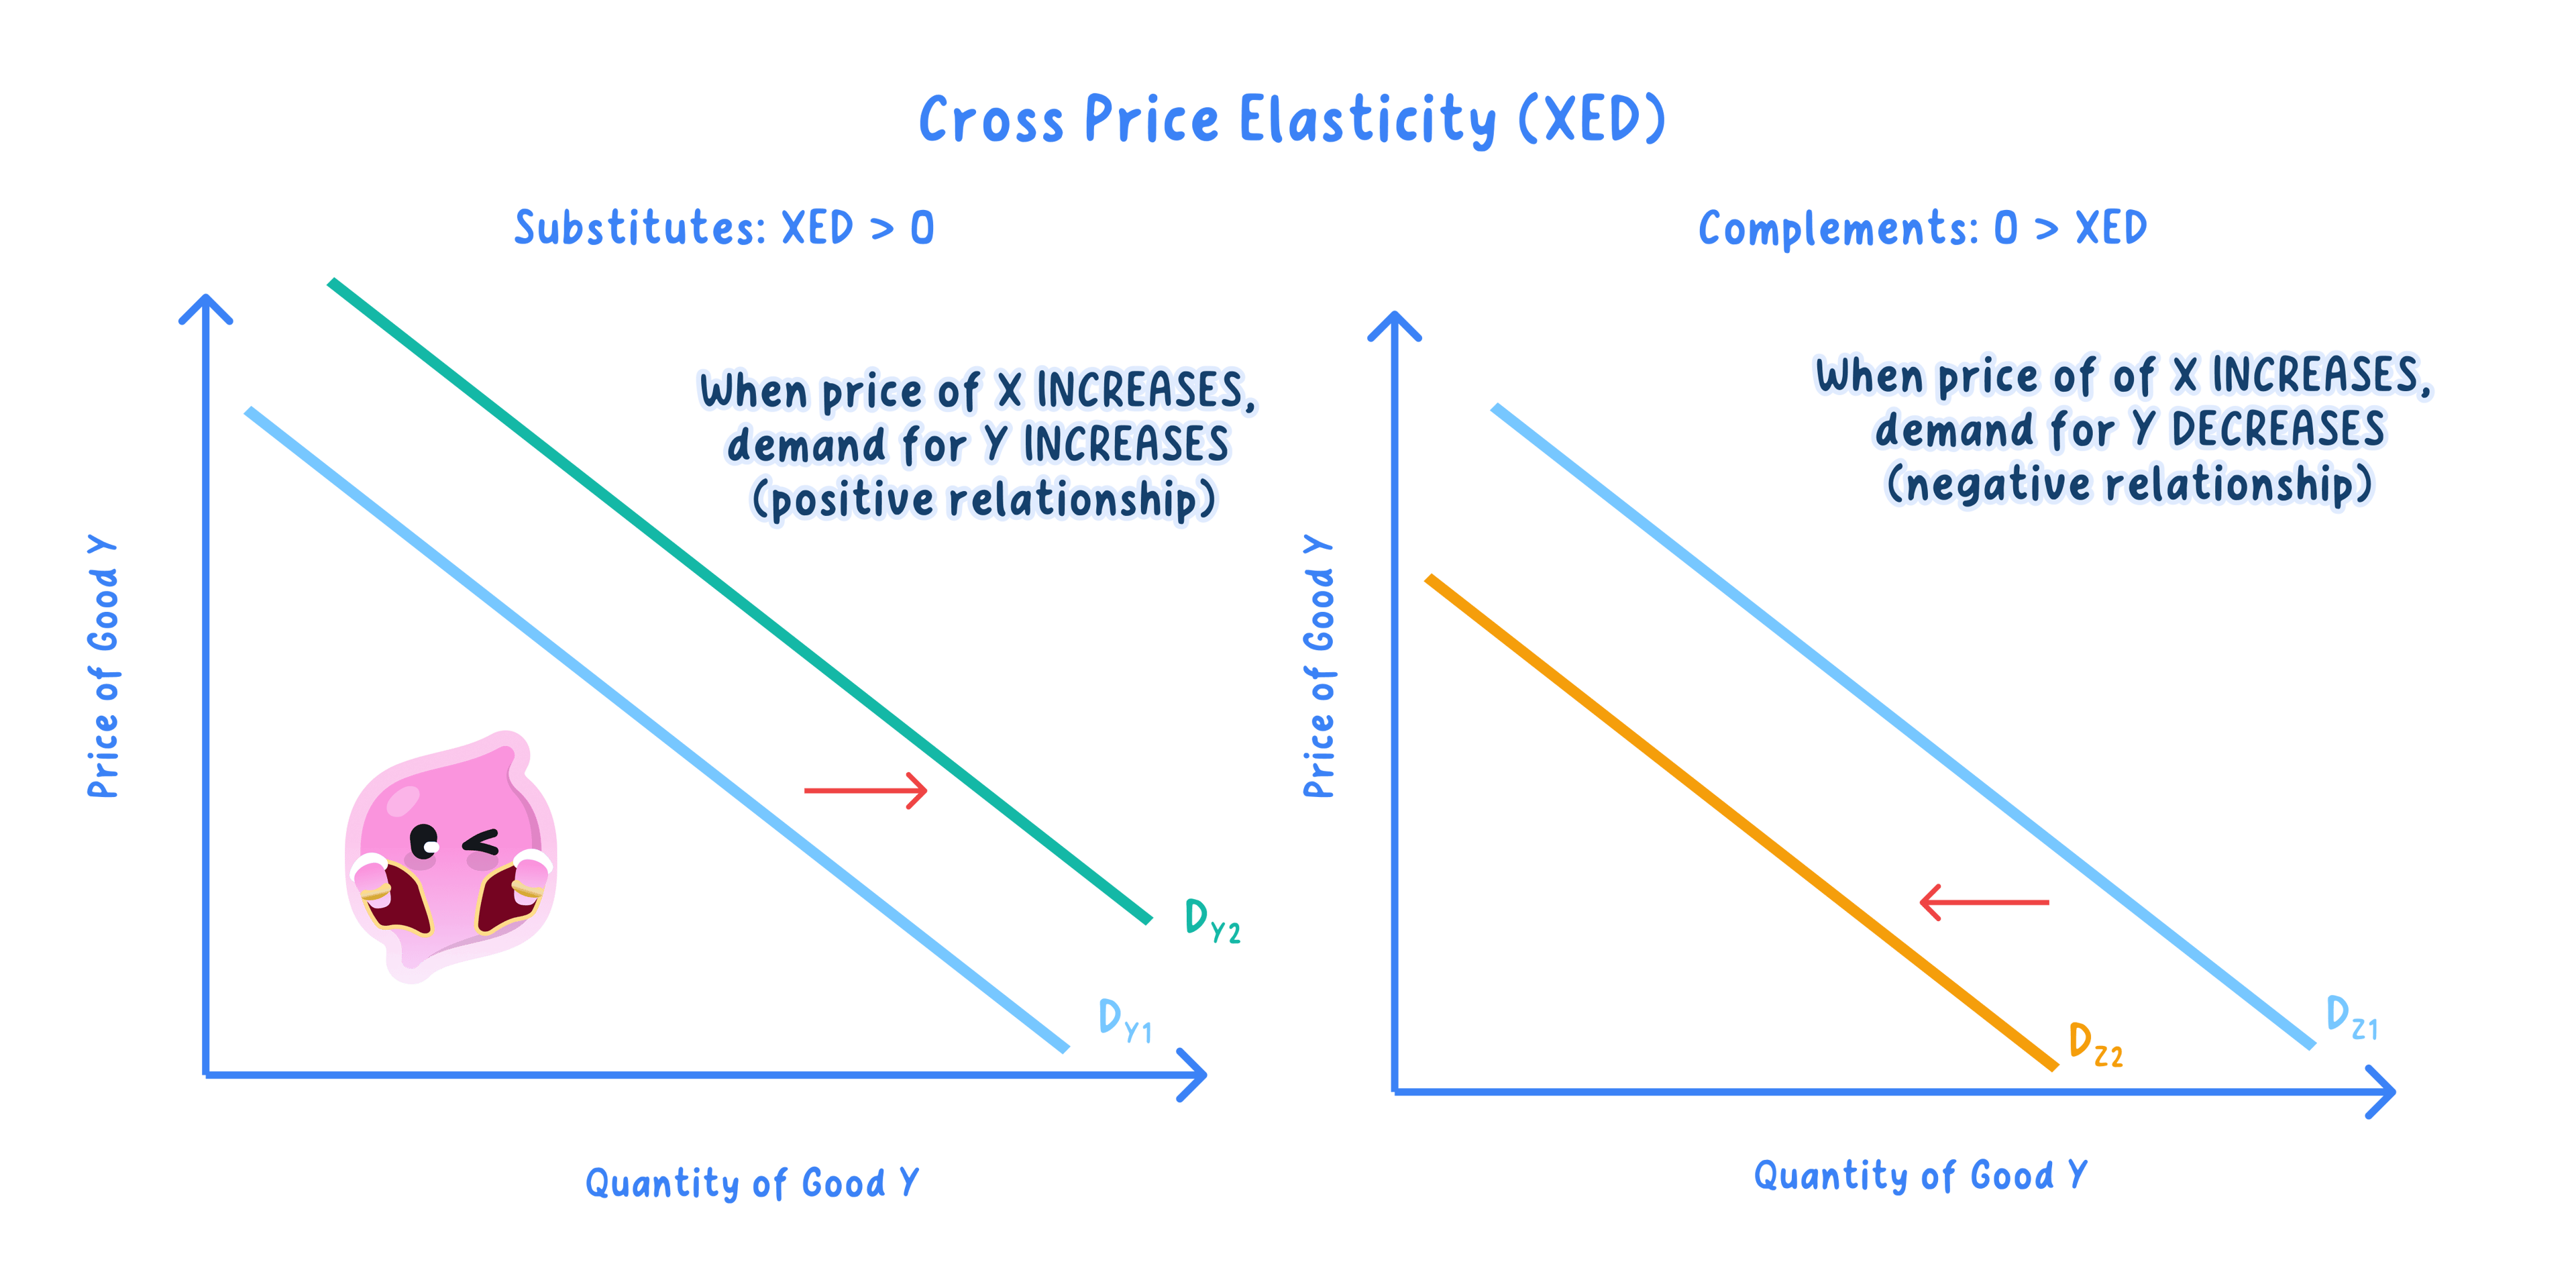
Interpreting XED
Substitutes: positive XED, so a rise in one good's price raises demand for the other.
Complements: negative XED, so a rise in one good's price lowers demand for the other.
Unrelated goods: XED of zero, so a change in one good's price leaves demand for the other unchanged.
- The size of XED shows the strength of the link, so a +0.5 between Coca-Cola and Pepsi is a weak substitute relationship (XED > 0), while a −0.8 between a printer and its toner is a strong complement relationship (XED < 0).
Factors Influencing Elasticity
- PED: the main factor is the availability of close substitutes, since many close substitutes let buyers switch easily and so make demand more elastic.
- Demand is more inelastic when a good is a necessity, takes a small share of income, or is habit-forming, addictive or strongly branded.
- Demand becomes more elastic the longer the time period, as buyers find alternatives, so petrol is inelastic in the short run but more elastic over time.
- YED and XED: YED depends on whether the good is a necessity, luxury or inferior, while XED depends on how closely the two goods are related.
- For YED and XED read the sign first, then read the size for strength.
- Judge the PED category by size, ignoring the negative sign.
- Justify any elasticity claim with a determinant, leading with the availability of substitutes.
- Do not confuse an inferior good with a low-quality good; an inferior good is simply one whose demand falls as income rises.
- Do not treat elasticity as fixed, because it changes over time and with how narrowly the good is defined.
- What PED values count as perfectly inelastic, relatively inelastic, unitary, relatively elastic and perfectly elastic?
- What do the sign and size of YED tell you about a good?
- What do positive, negative and zero XED values indicate?
- Give four factors that influence the price elasticity of demand.
1.2.3c Significance of elasticities and total revenue
Elasticities and Revenue
Total revenue: the price of a good multiplied by the quantity sold, which equals total consumer spending on it.
- Whether a price change raises or lowers total revenue depends on the price elasticity of demand.
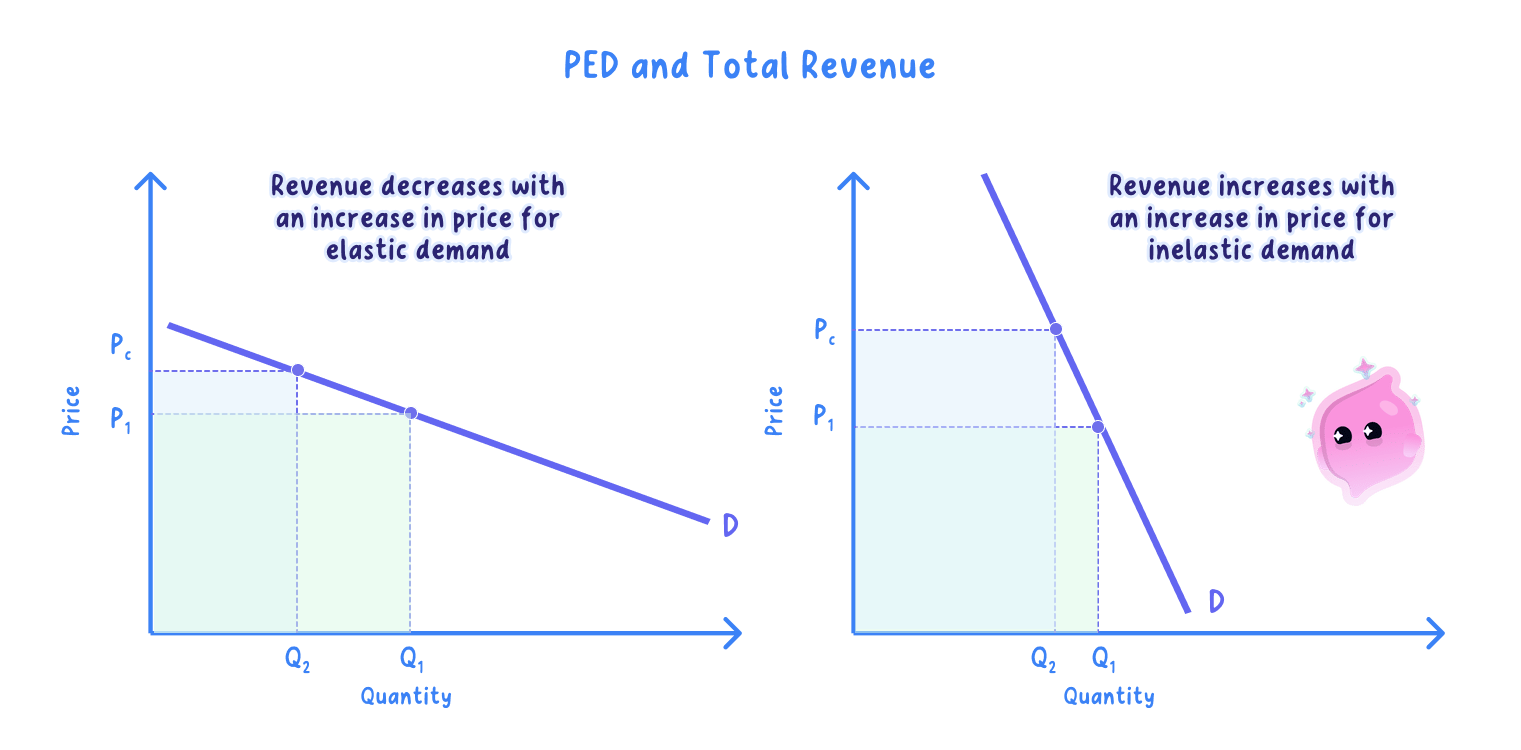
- When demand is inelastic, quantity falls proportionately less than price rises, so a price rise raises total revenue.
- When demand is elastic, quantity falls proportionately more than price rises, so a price rise lowers total revenue.
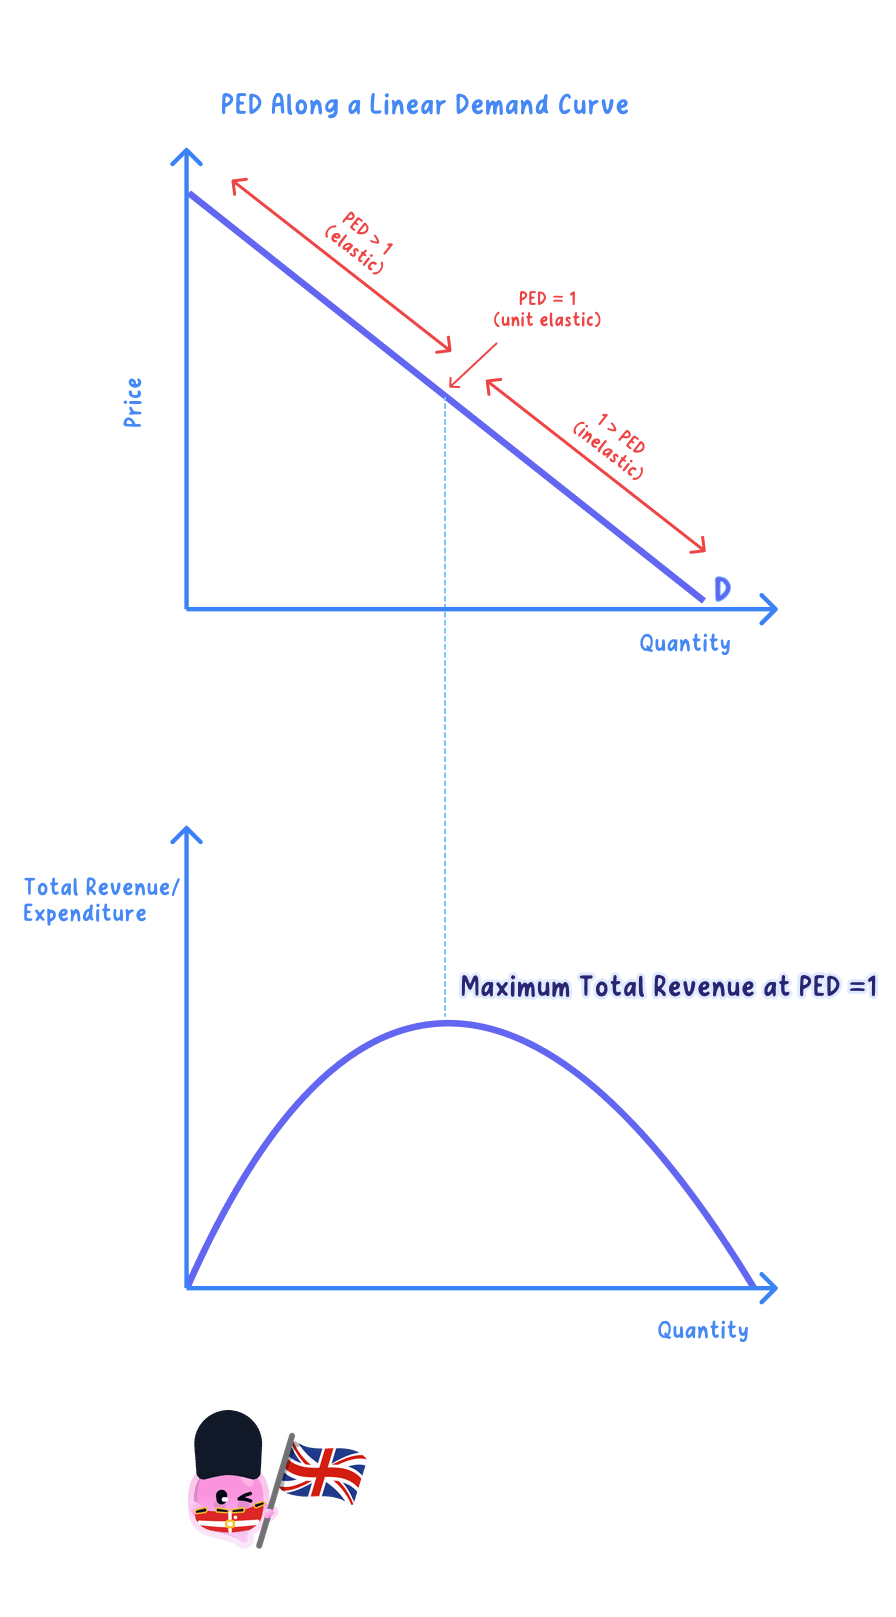
- When demand is unitary elastic, total revenue does not change and is at its maximum, where PED = 1.
- A firm sells 100 units at £10, so total revenue is £1,000.
- Demand is inelastic, so the 20% price rise lifts total revenue from £1,000 to £1,080.
Pricing and Taxation
- A firm should raise price where demand is inelastic and cut price where demand is elastic if the aim is to raise revenue.
- For an indirect tax, the more inelastic demand is, the more of the tax consumers pay and the more revenue the tax raises.
- This is why government taxes inelastic goods such as tobacco and fuel, where consumption falls only a little.
- For a subsidy, the more inelastic demand is, the more of the benefit passes to consumers as a lower price rather than to producers.
- UK tobacco duty is set high because demand is addictive and price inelastic.
- Smokers cut back only a little, so the duty raises large and stable revenue for the government.
Income and Cross Elasticity
- For changes in real income, income elasticity of demand shows which industries grow or decline over the economic cycle.
- Luxuries with high YED boom in an upturn and suffer in a downturn, while inferior goods do the reverse, so firms plan product ranges accordingly.
- For changes in the prices of substitutes and complements, cross elasticity of demand shows how strongly a firm's sales respond to a rival's or a complement's price change.
- A firm facing a close substitute, such as Coca-Cola against Pepsi (XED > 0), is vulnerable to a rival's price cut, while complements such as printers and ink (XED < 0) can be priced jointly.
Is elasticity a reliable guide?
- It holds because a firm or government that knows the elasticity can predict how revenue responds, so taxing inelastic goods raises stable revenue.
- But elasticity values are estimates from past data, and they shift as new substitutes appear or habits change, so the guide can mislead.
- But elasticity also varies along the demand curve and over time, so a value that fits a small price change may fail for a large one.
- On balance, elasticity is a useful guide, but its reliability depends on the quality of the data, the size of the price change and the time horizon.
- State the PED first, then deduce the effect of a price change on total revenue.
- Remember that total revenue is maximised where PED = 1.
- Link the elasticity to the specific decision: taxes and subsidies, the cycle, or rivals' prices.
- Do not claim a price rise always raises revenue, as it only does so when demand is inelastic and it lowers revenue when demand is elastic.
- Do not treat revenue as the same as profit, which also depends on costs.
- How is total revenue calculated, and at what PED is it maximised?
- What happens to total revenue when the price of an inelastic good rises?
- Why does government tax goods with inelastic demand?
- How do YED and XED help a firm respond to income changes and to rivals' prices?
