Market equilibrium
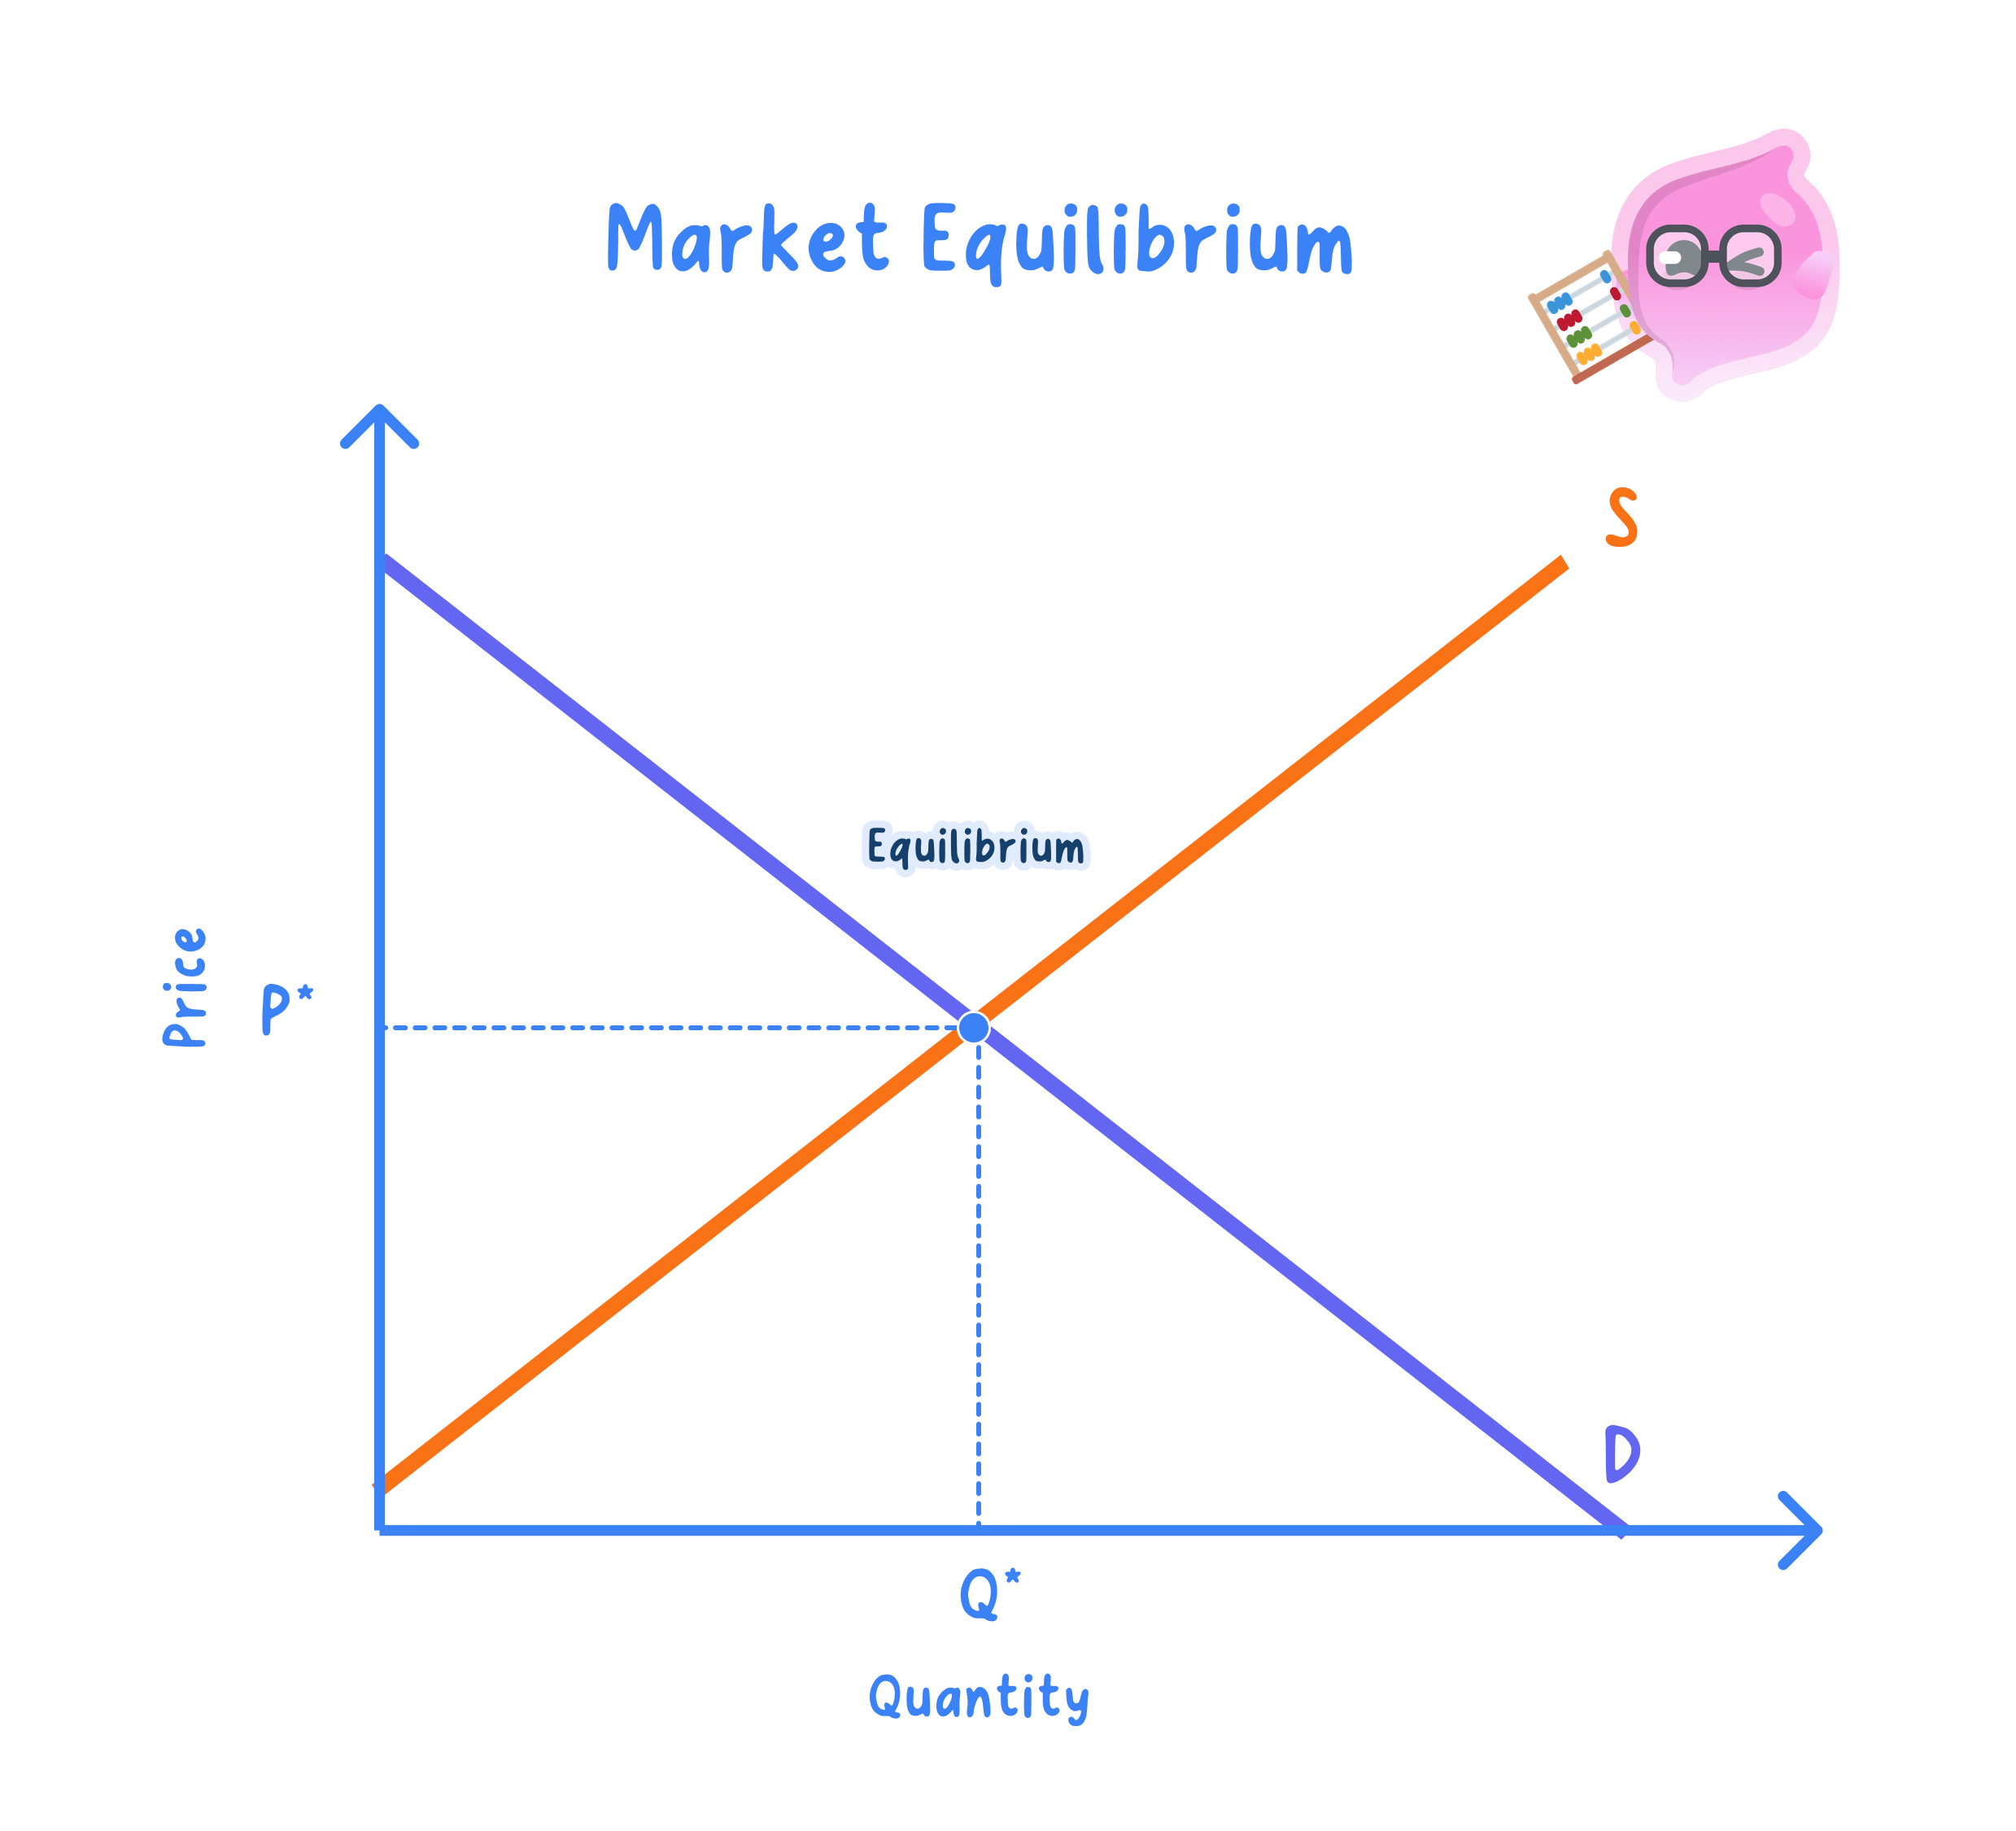
Equilibrium price: the price at which quantity demanded equals quantity supplied, so there is no tendency for price to change.
Equilibrium quantity: the quantity bought and sold at the equilibrium price, found where the demand and supply curves intersect.
- Why the curves cross matters: only at the intersection does the quantity buyers want match the quantity sellers offer, so the market clears with no unsold stock and no unmet demand.
- Read it off a diagram with price on the vertical axis and quantity on the horizontal axis, directly below and across from the crossing point.
- Suppose a coffee has an equilibrium price of £3, where 100 cups are both demanded and supplied.
- At £2 buyers want more cups than sellers offer, creating a shortage.
- At £4 sellers offer more cups than buyers want, creating a surplus.
Shortages and surpluses
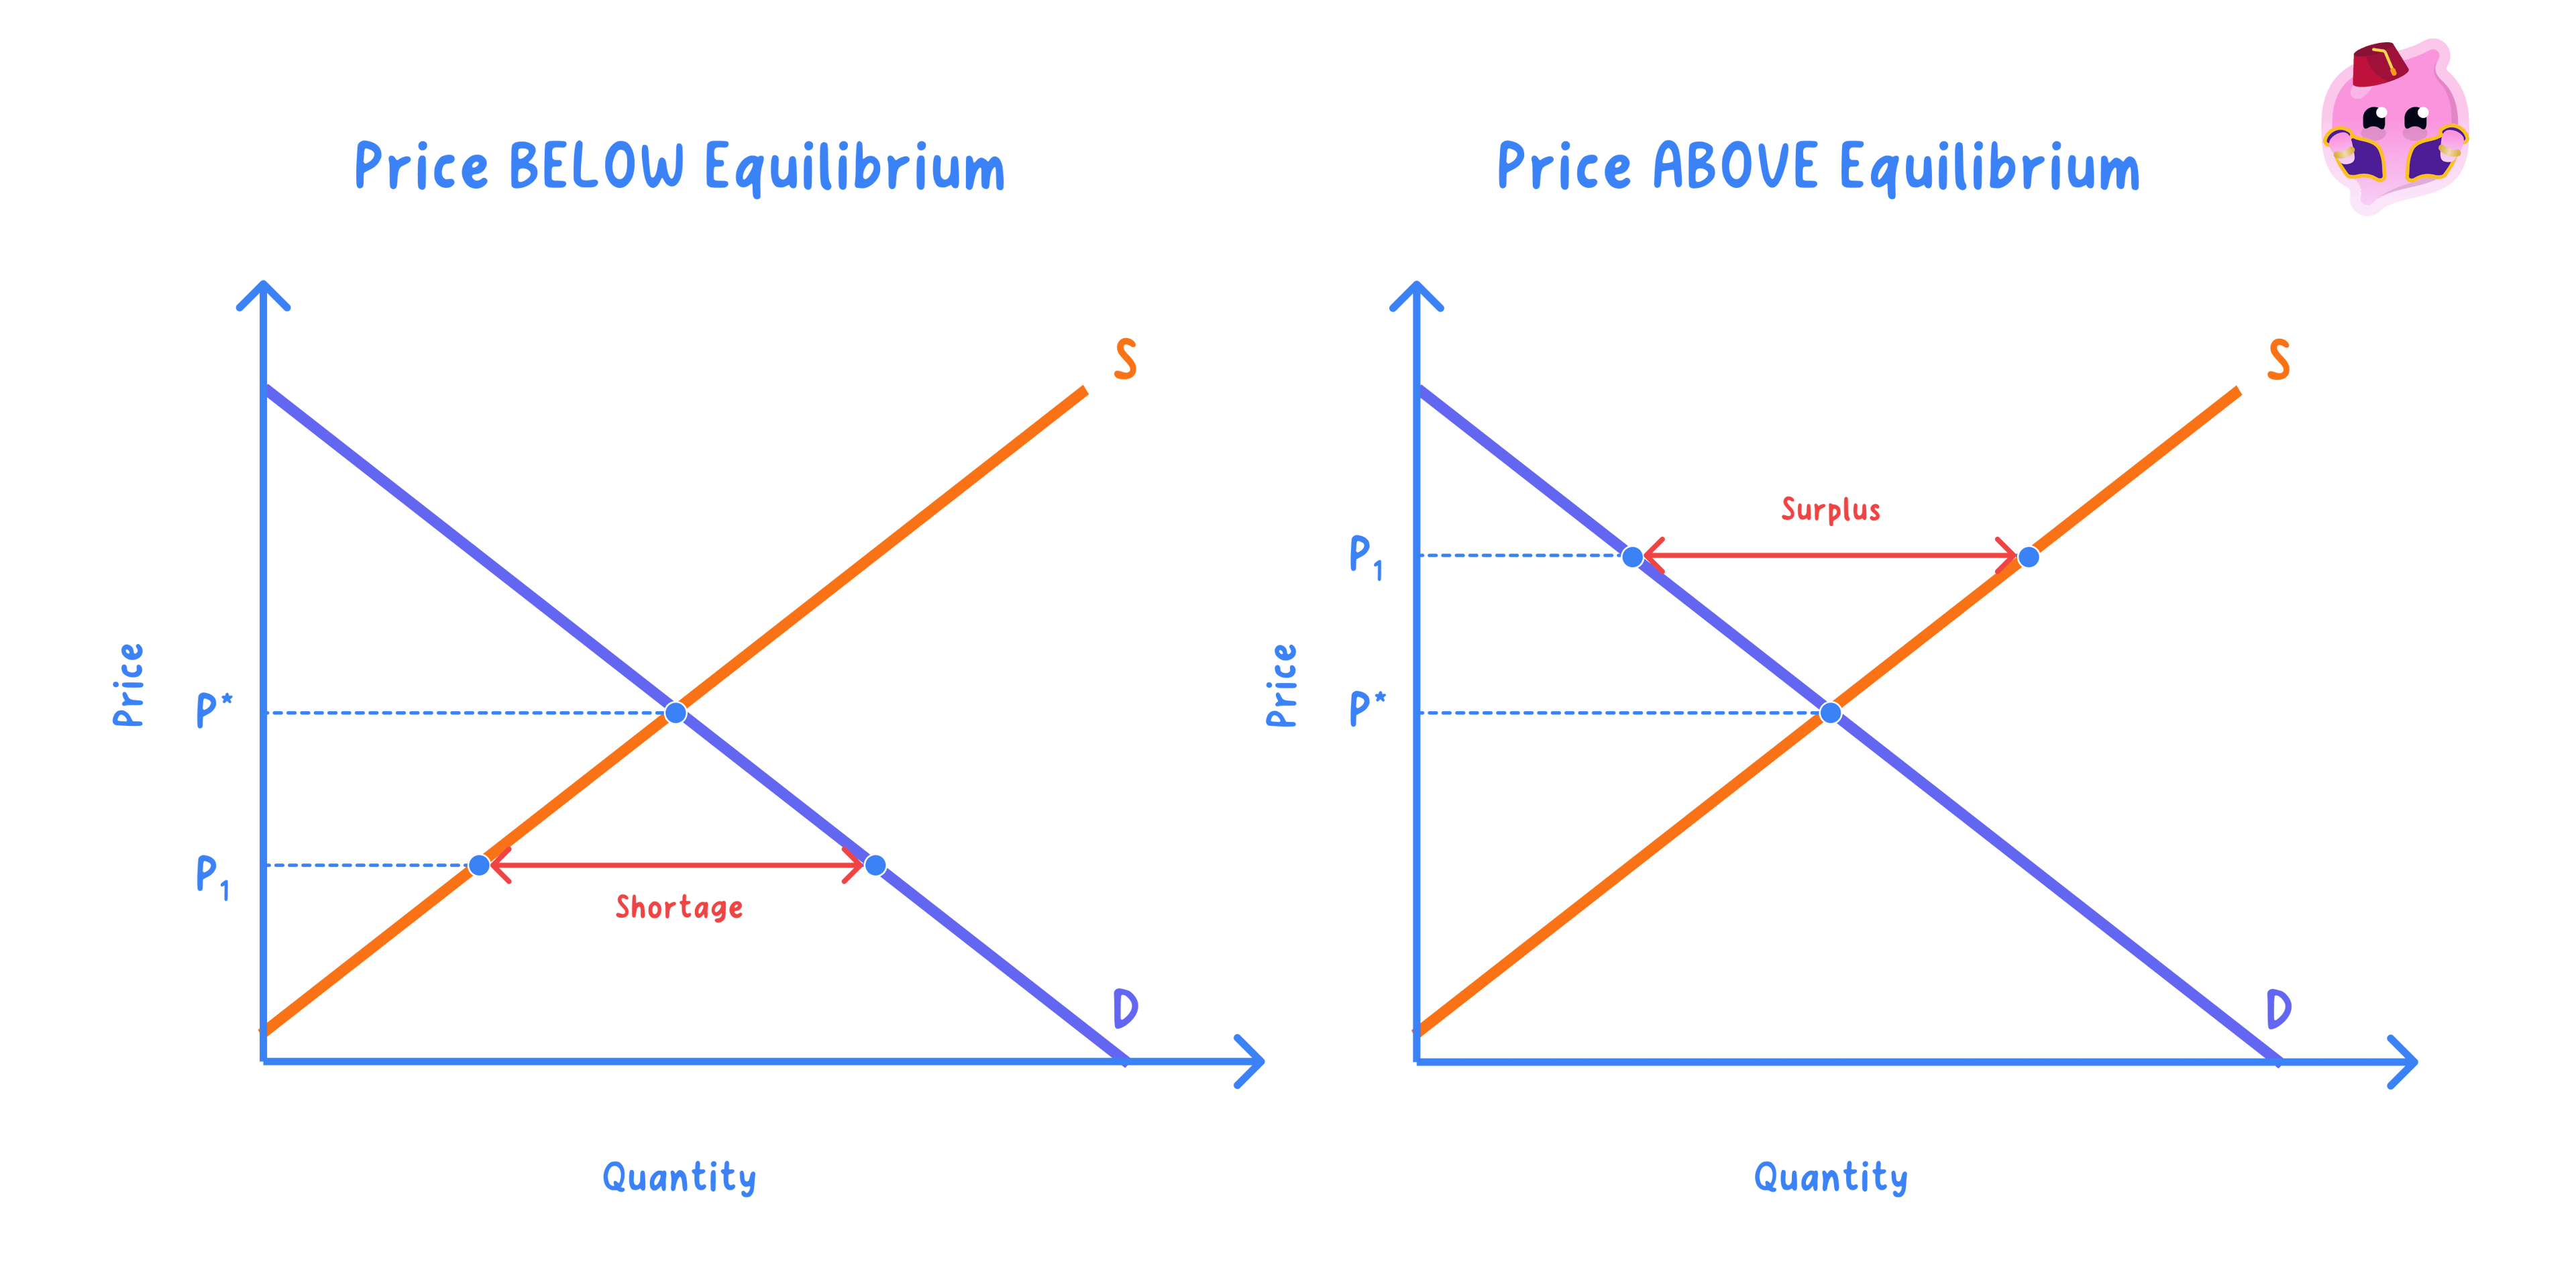
Excess demand (shortage): when price is held below equilibrium so quantity demanded exceeds quantity supplied.
Excess supply (surplus): when price is held above equilibrium so quantity supplied exceeds quantity demanded.
- Reading a shortage: it is the horizontal gap between the larger quantity demanded and the smaller quantity supplied at that low price.
- Reading a surplus: it is the horizontal gap between the larger quantity supplied and the smaller quantity demanded at that high price.
- Market forces act like a thermostat, nudging price up during a shortage and down during a surplus until balance returns.
- The bigger the gap, the stronger the pressure on price, just as a colder room makes the heating work harder.
Market forces
Market forces: the pressure on price created by excess demand or excess supply that automatically moves a market back towards equilibrium.
- Removing a shortage: sellers can raise the price, which contracts quantity demanded and extends quantity supplied until the gap closes.
- Removing a surplus: unsold stock forces sellers to cut the price, which extends quantity demanded and contracts quantity supplied until the gap closes.
- When poor weather cut the UK wheat harvest, the supply curve shifted left and bread prices rose.
- Because demand for a staple food is price inelastic, most of the adjustment fell on price rather than quantity.
Shifts in curves
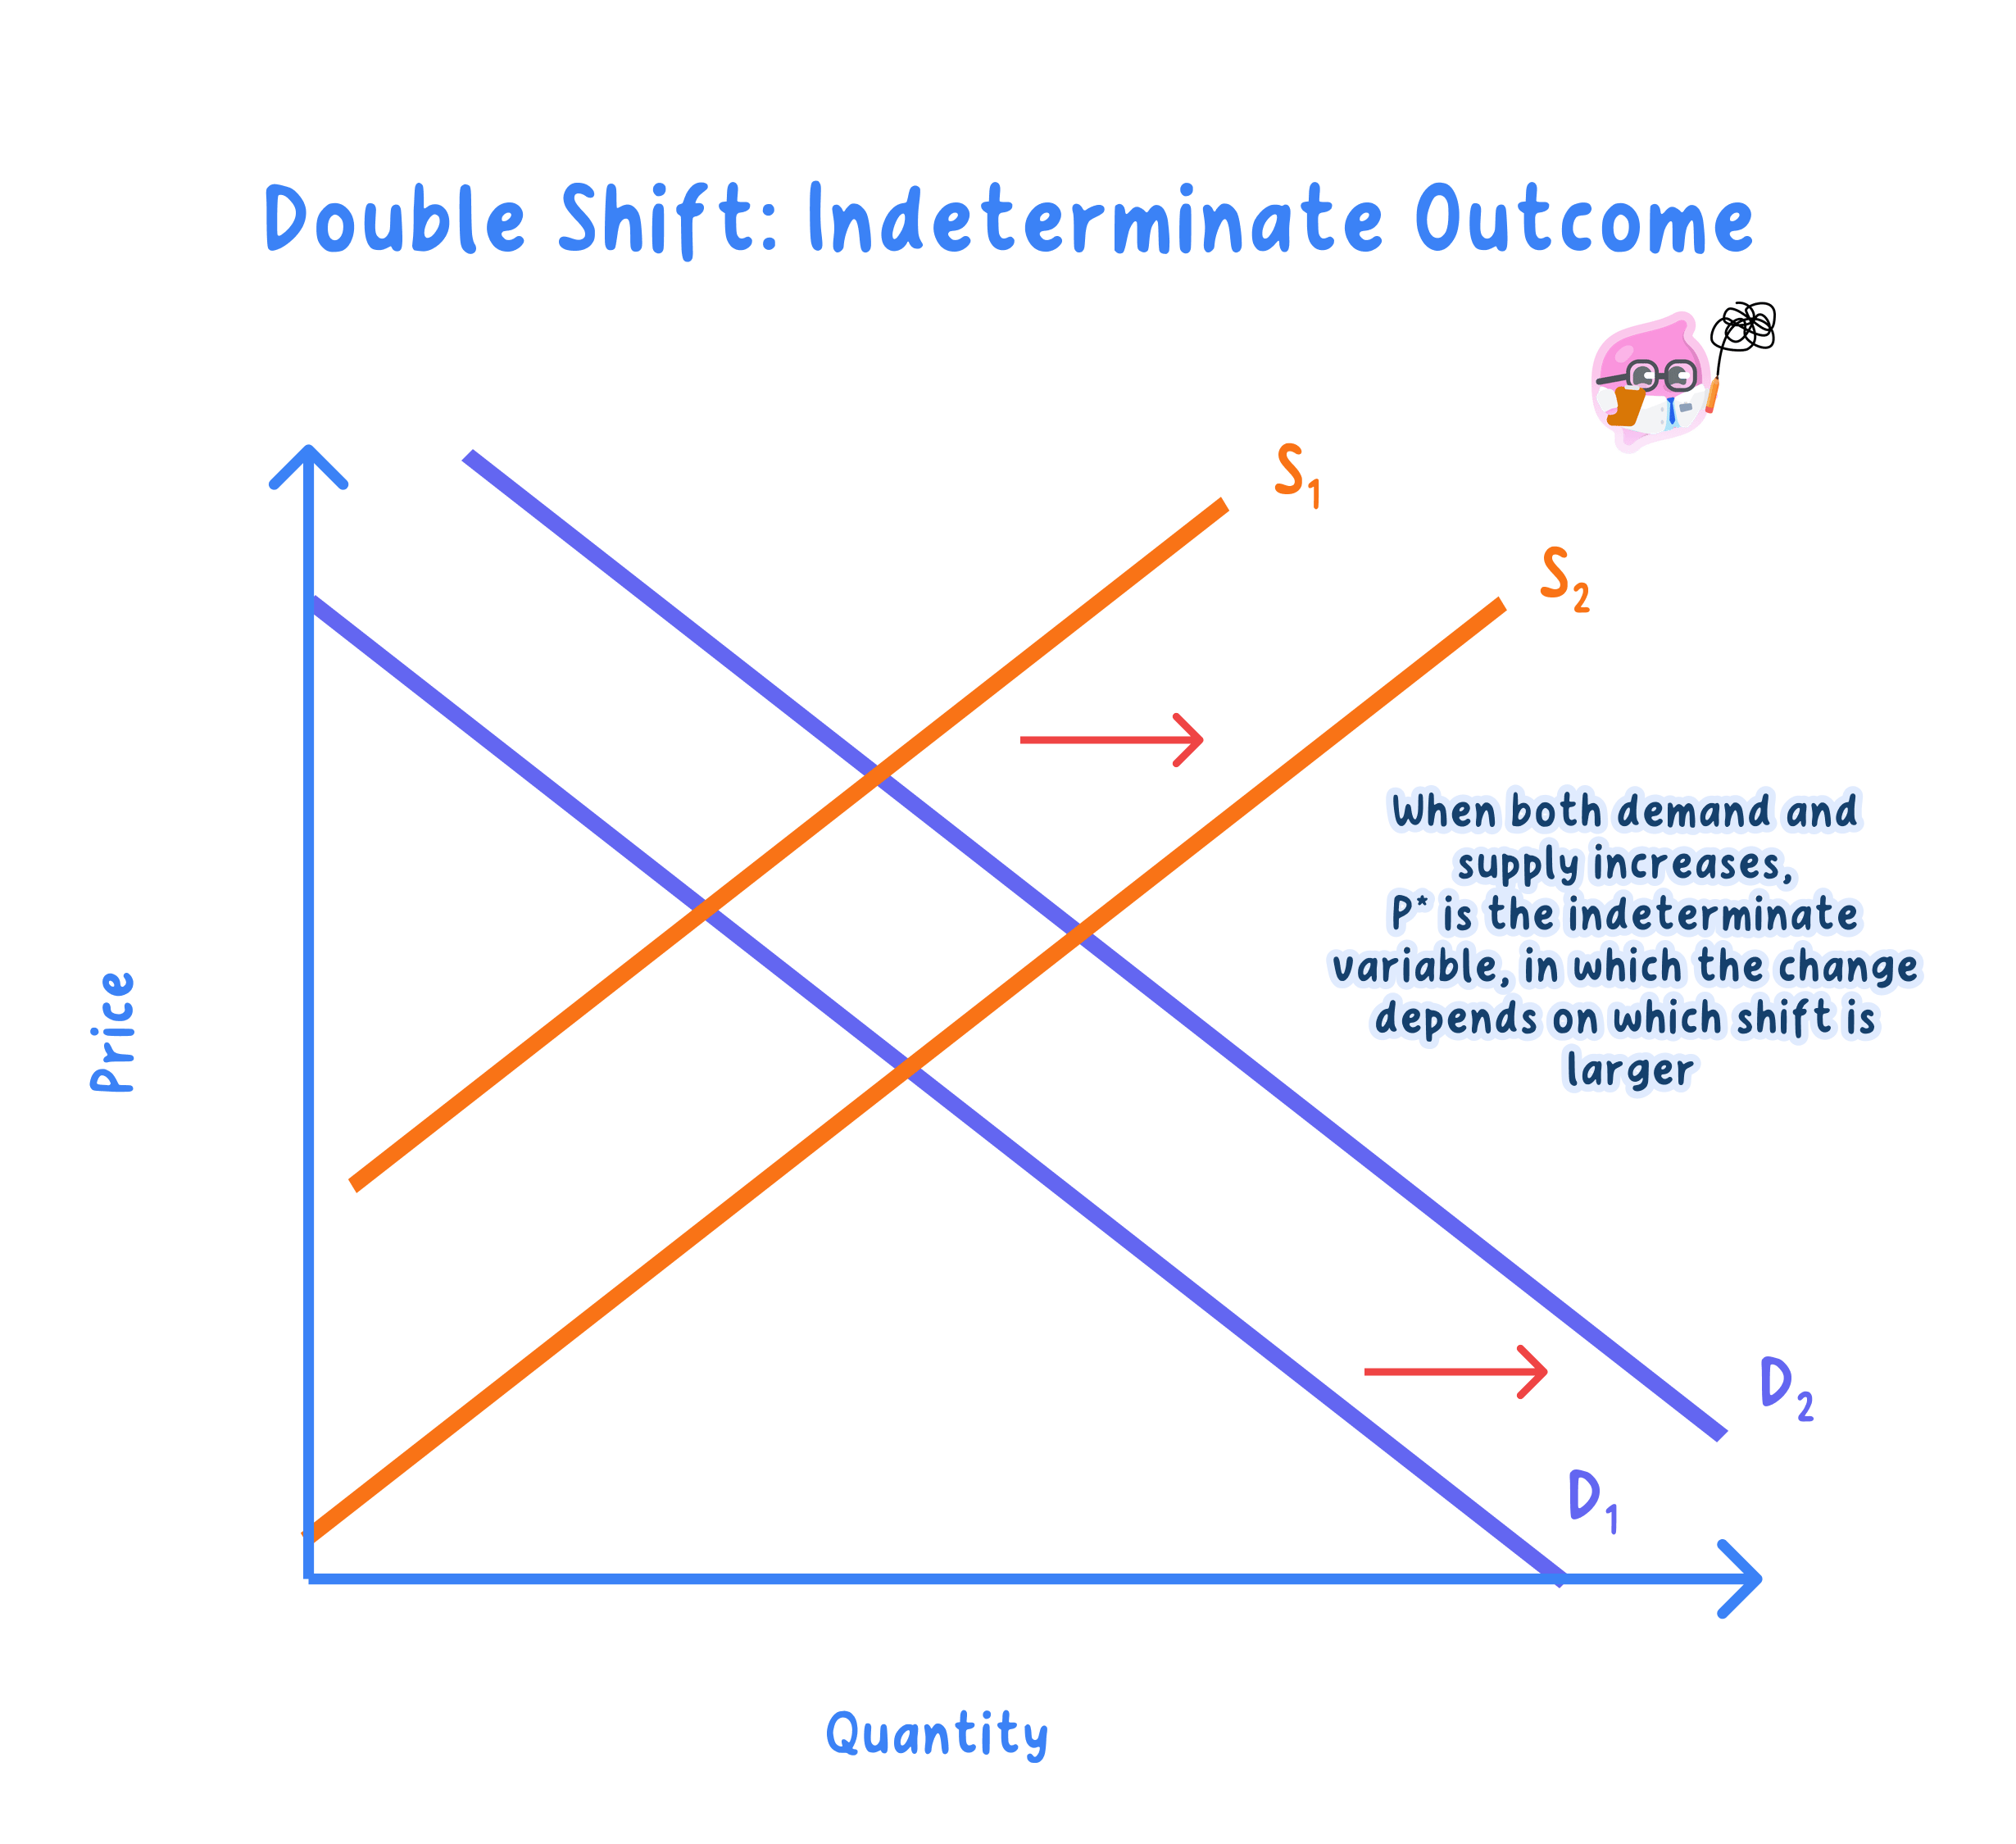
Indeterminate: when both curves shift, the direction of change in price or quantity cannot be known without the relative sizes of the two shifts.
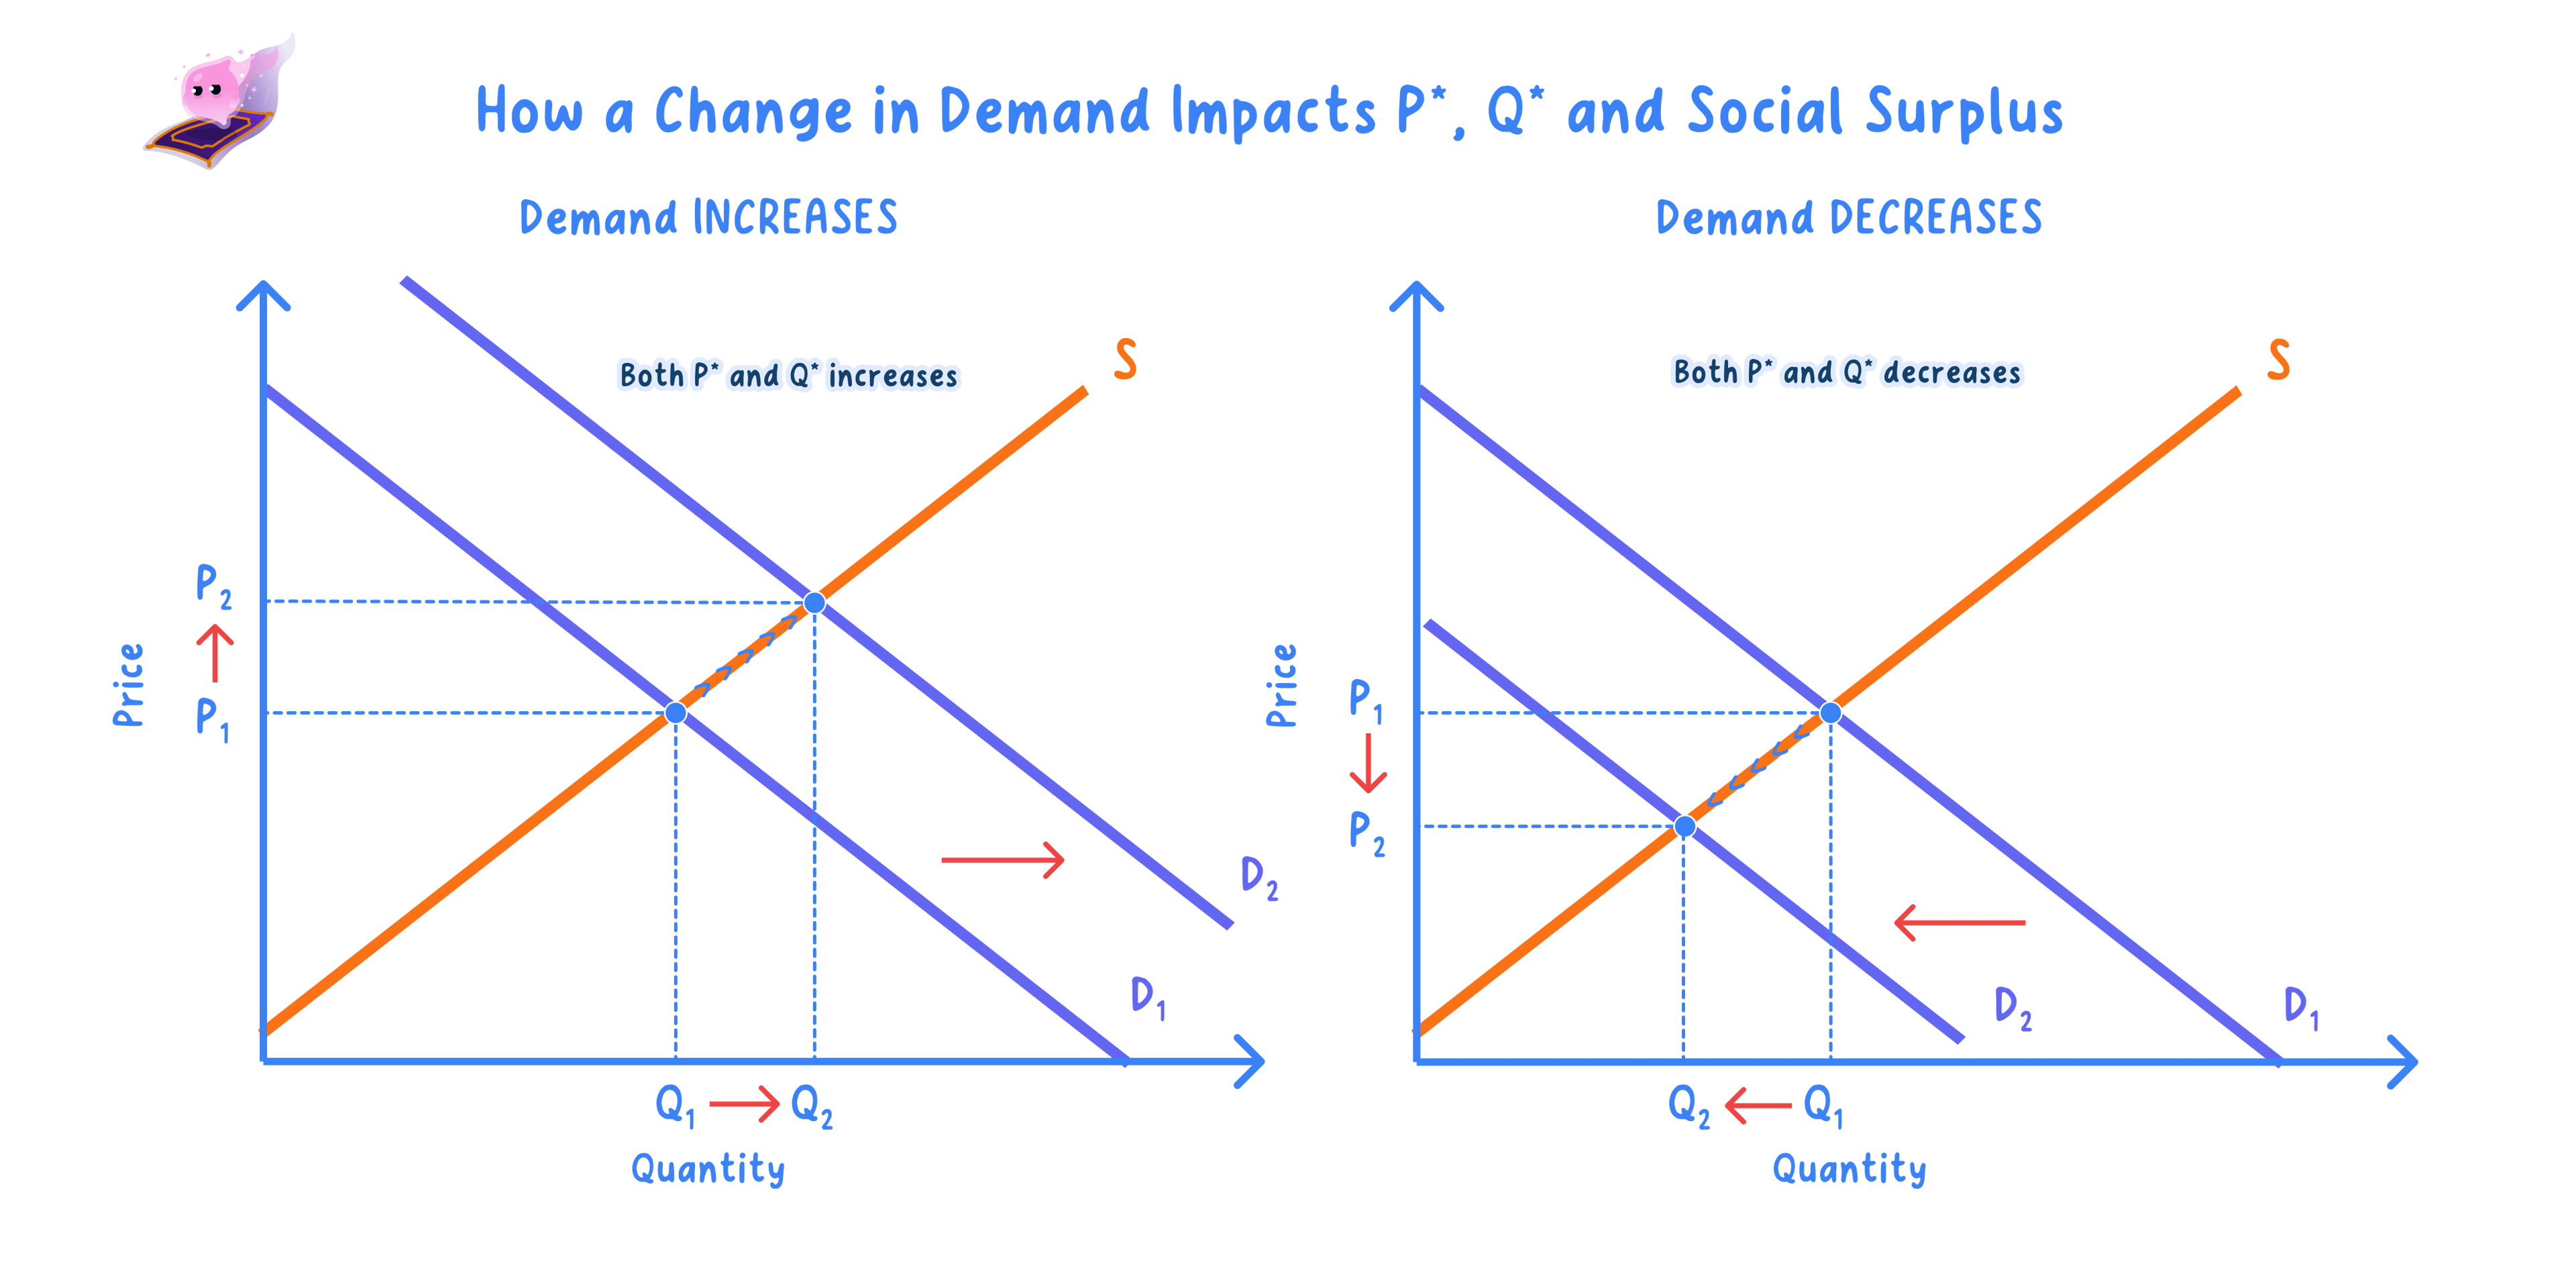
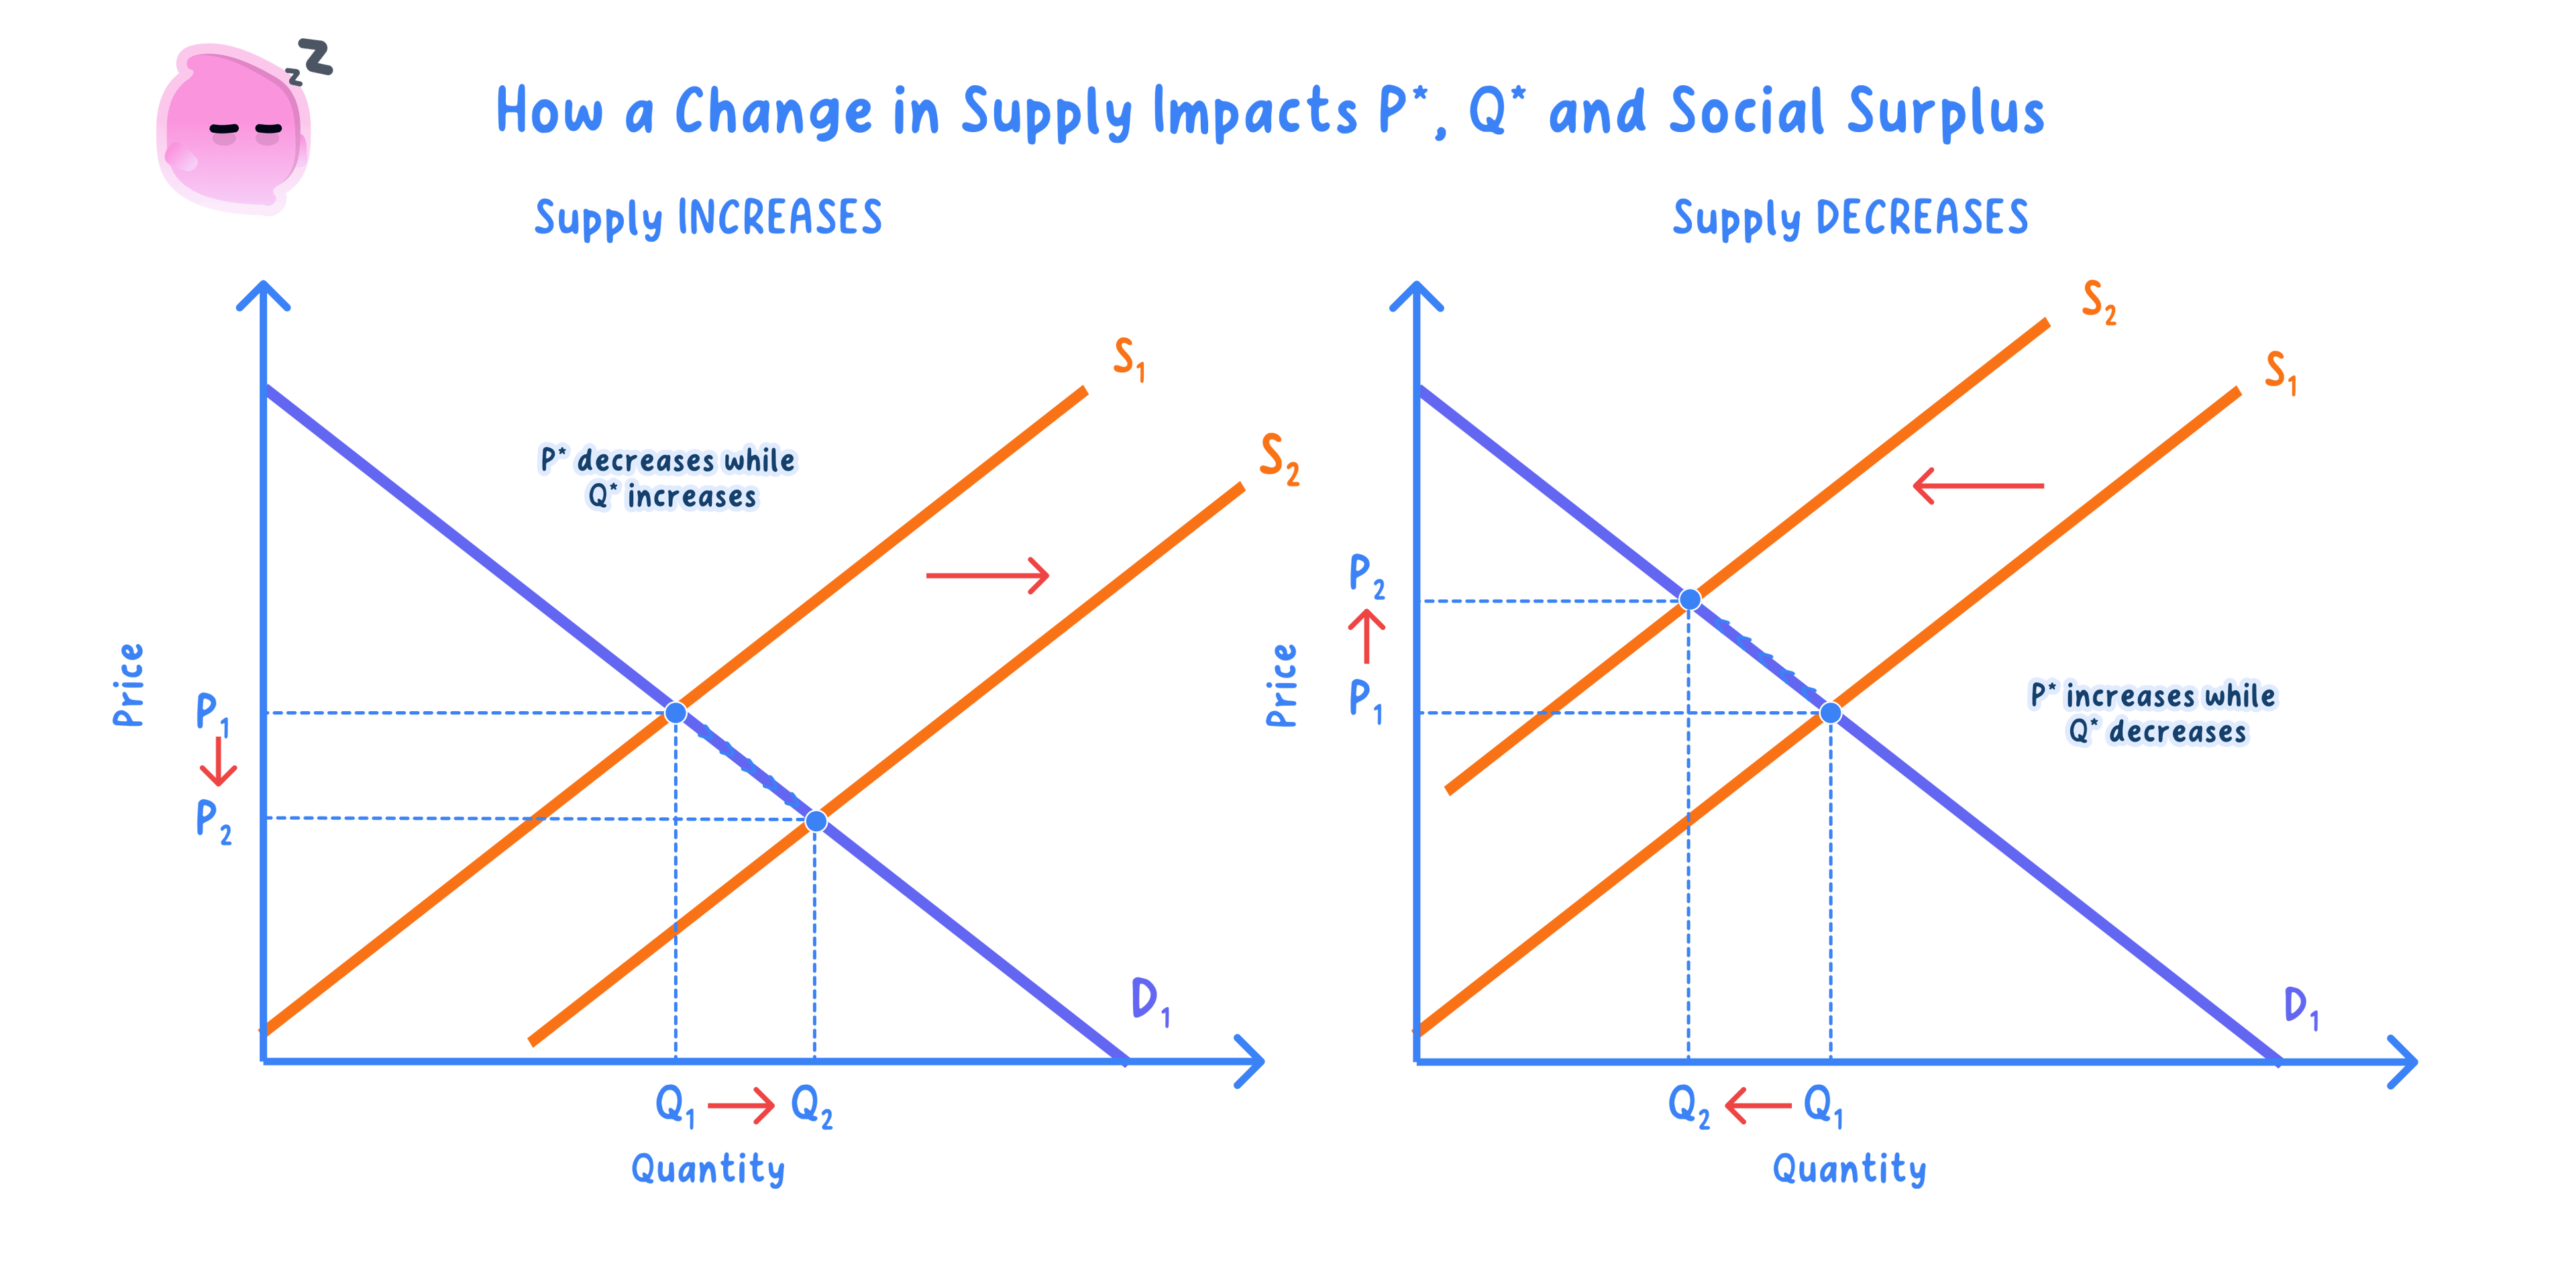
- A shift moves the market: a shift of either curve creates a new equilibrium at a different price and quantity.
- An increase in demand shifts demand right, raising both equilibrium price and quantity.
- An increase in supply shifts supply right, lowering price but raising quantity.
- When both curves shift together, either price or quantity is indeterminate until you know which shift is larger.
Real-world markets
- UK housing: strong demand meets supply that responds slowly, so higher demand mainly raises prices rather than the number of homes sold.
- Energy markets: a sudden supply disruption shifts supply left and pushes prices up sharply.
- The size of each price change depends on how price elastic demand and supply are, because inelastic curves force more of the adjustment onto price.
- Always draw and fully label the diagram, with titled price and quantity axes and both curves.
- Explain the adjustment process rather than just stating that a shortage or surplus exists.
- Move one curve at a time, read off the new equilibrium, then combine any second shift.
- Do not confuse a shortage with scarcity: a shortage is a disequilibrium at one price, while scarcity is the permanent economic problem.
- Do not shift both curves carelessly, because one of price or quantity then becomes indeterminate.
- Do not ignore elasticity when judging how large a price change will be.
- Where on a supply and demand diagram are the equilibrium price and quantity found?
- What is excess demand and when does it occur?
- How do market forces remove a surplus?
- How does an increase in demand affect equilibrium price and quantity?
- Why can a combined shift leave the change in price indeterminate?
